Overview
If your logs include timestamps in non-standard fields or embedded within the message, this guide will show you how to extract and parse the timestamp information into the standard OpenTelemetry timestamp field using SigNoz Logs Pipelines.
Example Log
Throughout this guide, we'll reference the following example raw log entry, which includes a timestamp field:
{
  "message": "Database connection established",
  "timestamp": "2025-10-27T05:30:17Z",
  "level": "INFO"
}
- The
timestampfield contains the timestamp2025-10-27T05:30:17Z. - We need to extract this timestamp and convert it into a proper
timestampfield for SigNoz.
Desired Outcome
By the end of this guide, we want to:
- Parse the JSON string in
bodyinto structured fields underattributes.parsed_body. - Extract the timestamp information from the
timestampfield. - Map the timestamp value to standard OpenTelemetry timestamp fields.
Here's how the log should look after we apply our pipelines.
{
  "body": "Database connection established",
  "id": "0iNztmsRoLqPNTa7qIA4TlpHNQQ",
  "timestamp": 1761543017000,
  "attributes": {
    "log.file.name": "test.log",
    "parsed_body": "{\"level\":\"INFO\",\"timestamp\":\"2025-10-27T05:30:17Z\"}"
  },
  "resources": {
    "service.name": "sample-logs"
  },
  "scope": {},
  "severity_text": "",
  "severity_number": 0,
  "trace_id": "",
  "span_id": "",
  "trace_flags": 0
}
Creating the Pipeline
Before we can parse timestamps, we need to create a pipeline that will filter out logs.
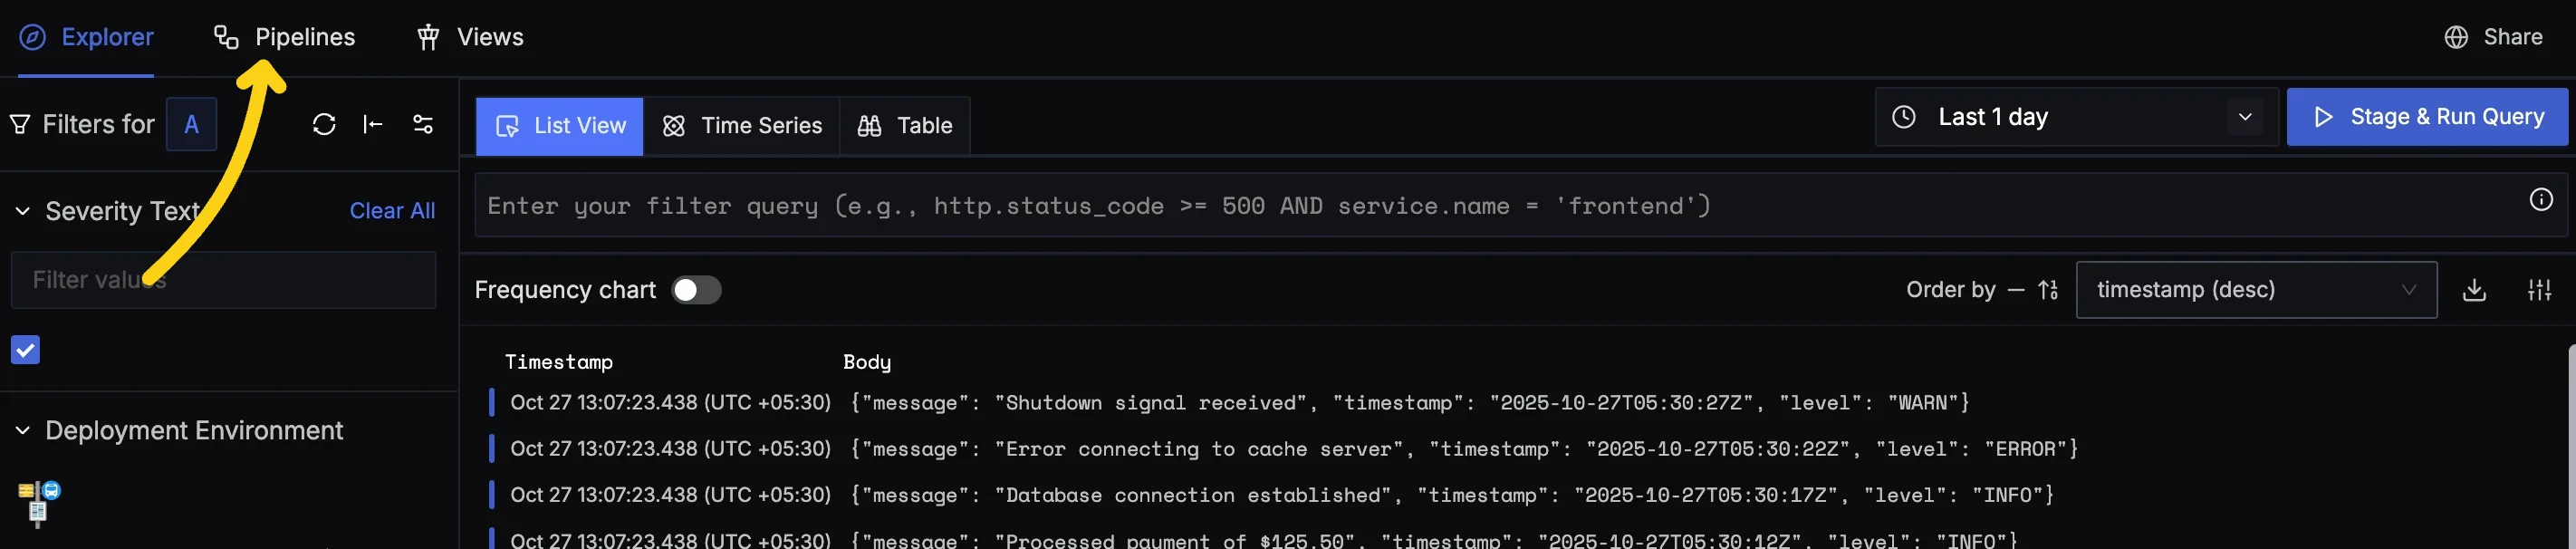
Step 1: Navigate to Pipelines Page
In SigNoz, go to Logs → Pipelines
Step 2: Create a new Pipeline
Open the "Create New Pipeline" dialog.
- If you do not have existing pipelines, press the "New Pipeline" button.
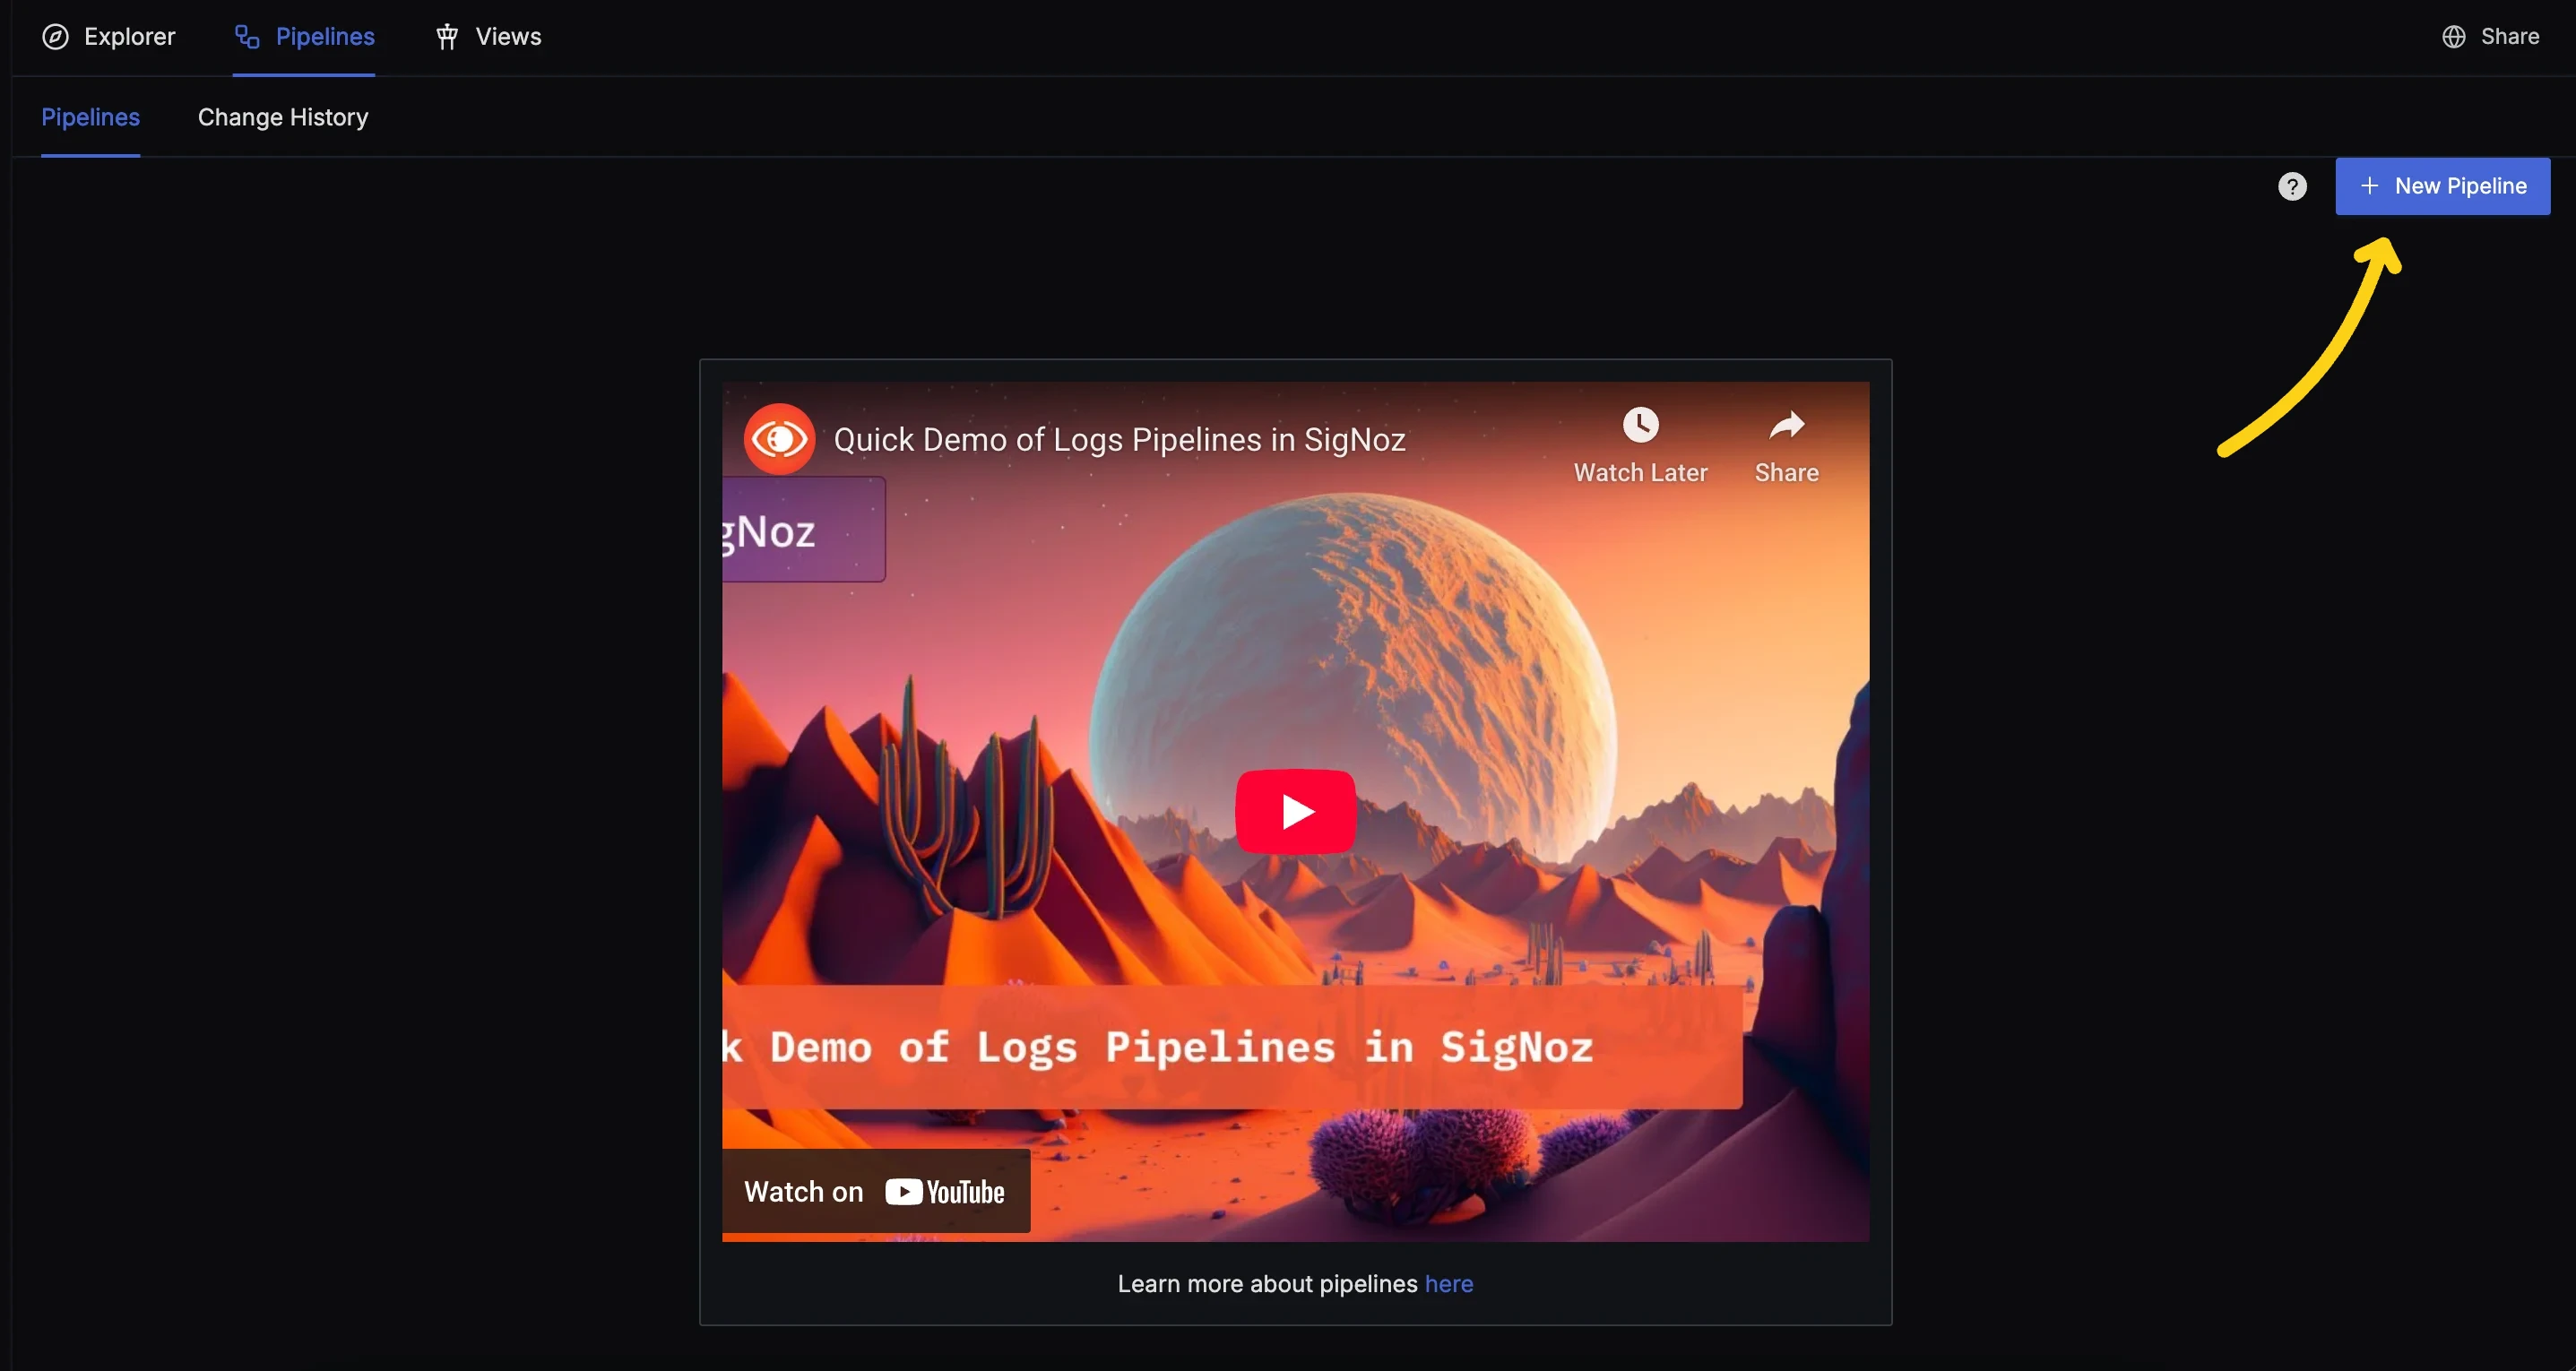
New Pipeline Button - If you already have some pipelines, press the "Enter Edit Mode" button and then click the "Add a New Pipeline" button at the bottom of the list of pipelines.
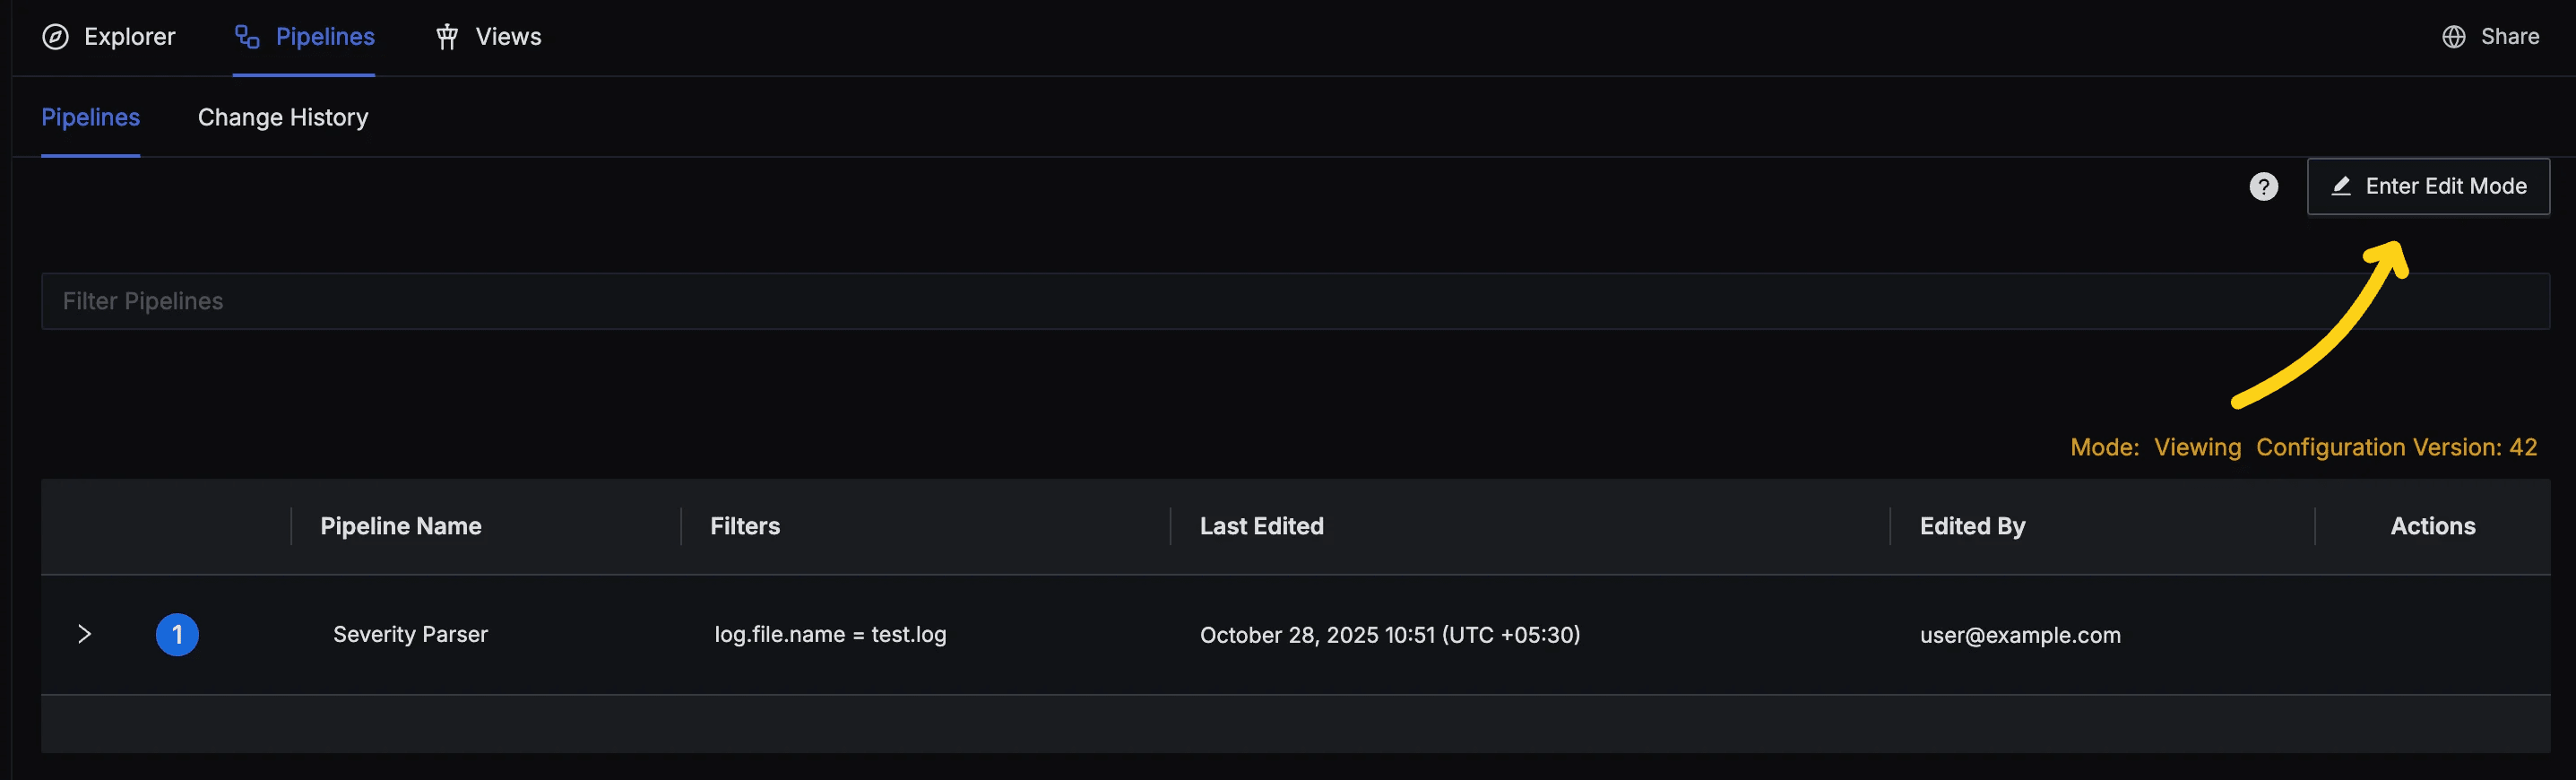
Enter Edit Mode button 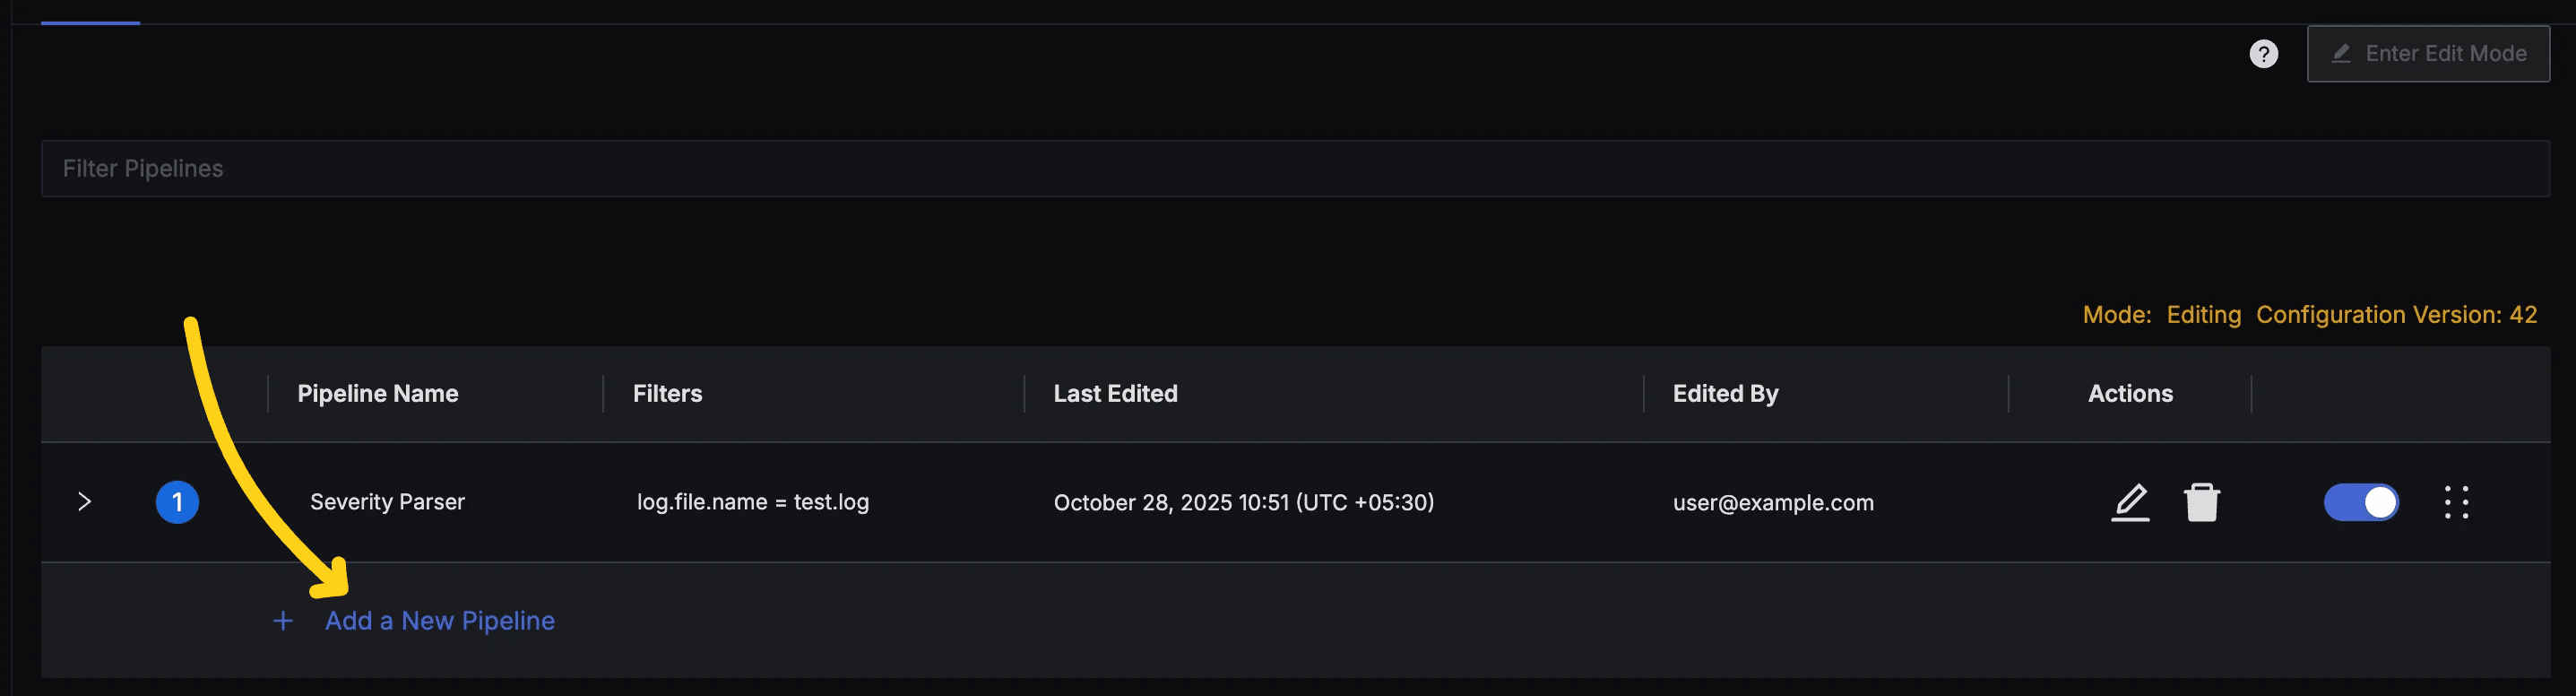
Add a New Pipeline button Provide details about the pipeline in the Create Pipeline Dialog.
- Name: Provide a pipeline name.
- Description: Add a detailed description for your pipeline (optional).
- Filter: Use the filter field to select the logs you want to process with the pipeline. For example
log.file.name = test.log. - Filtered Logs Preview: Use it to verify that the logs you want to process will be selected by the pipeline.
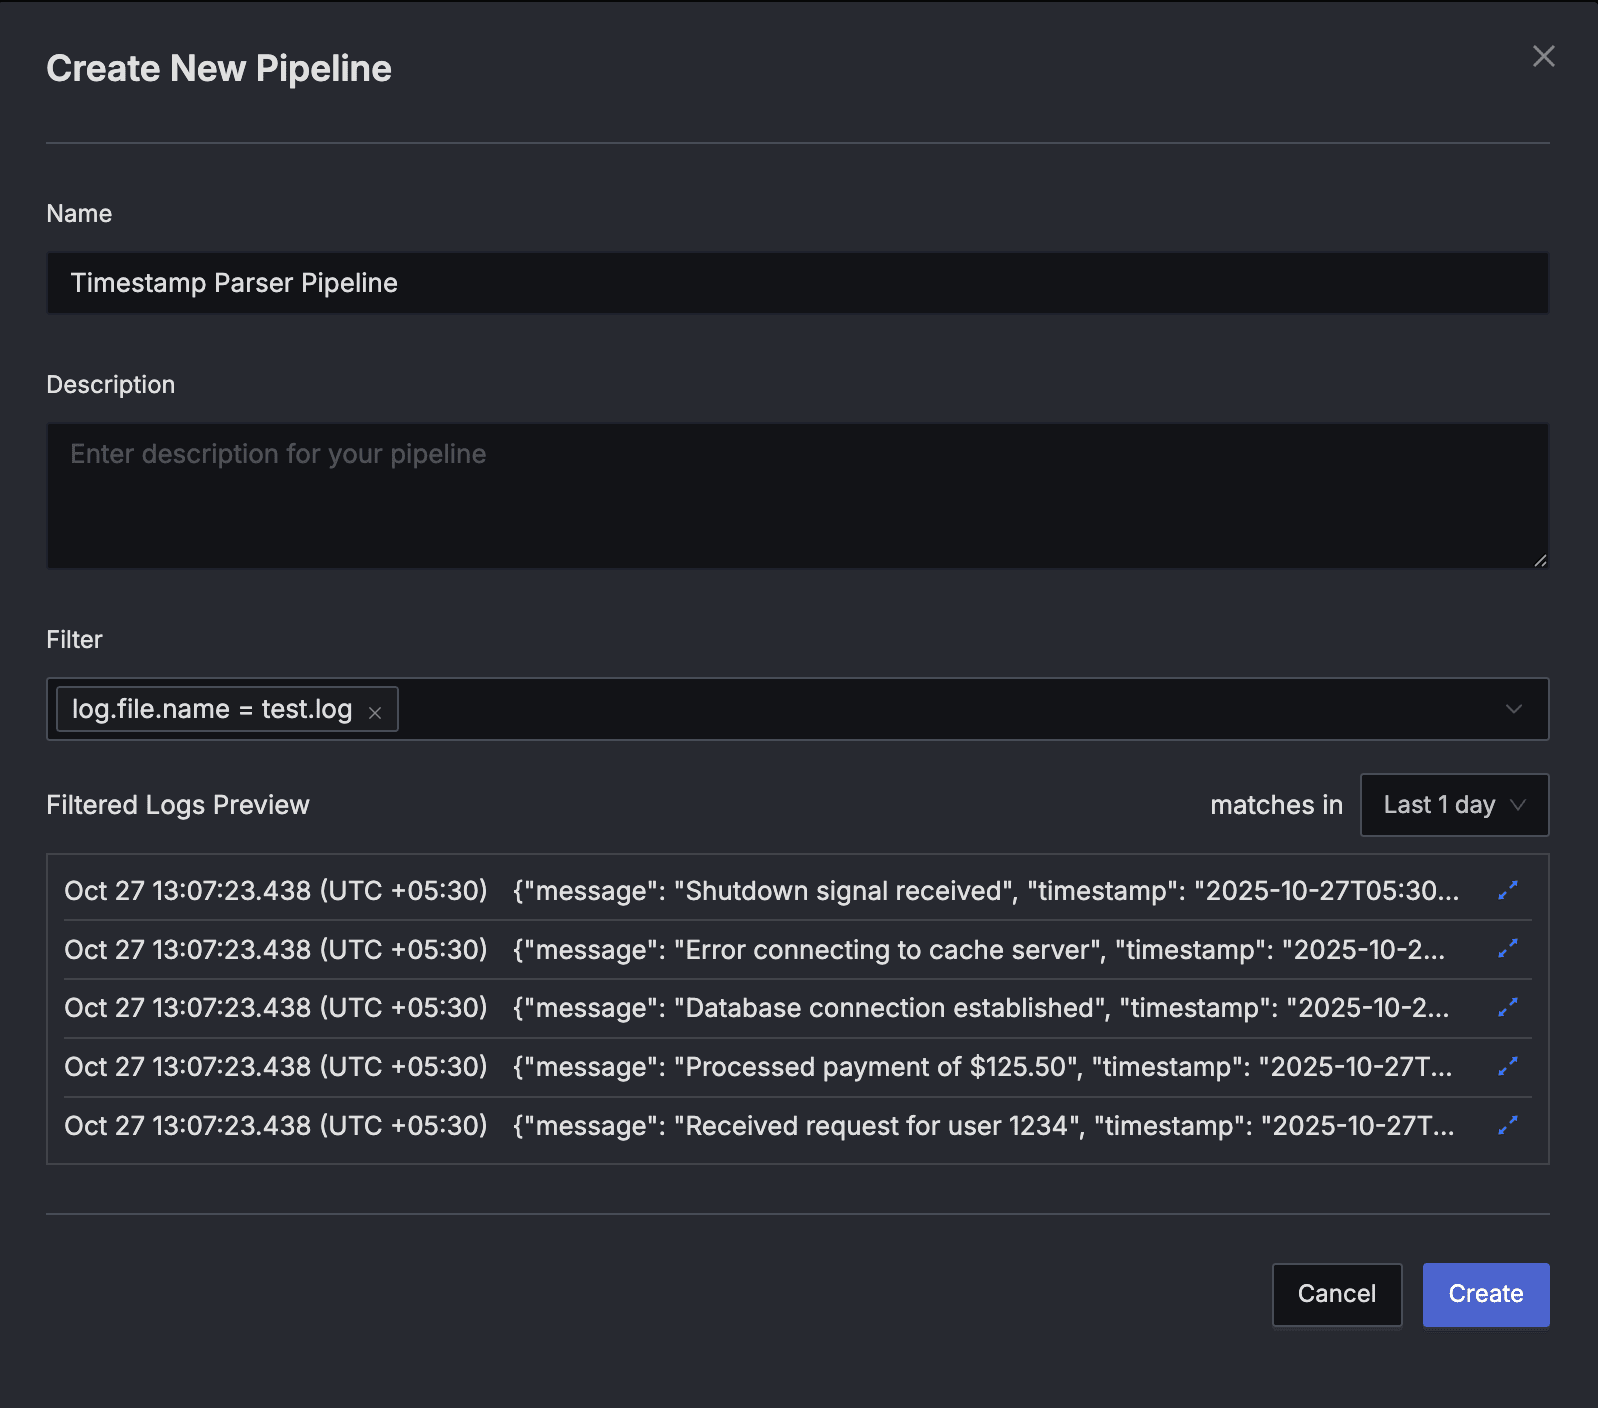
Create New Pipeline dialog Press the "Create" button to create the pipeline.
Steps to Parse JSON and Extract Timestamp
We'll use three processors in the SigNoz Logs Pipeline to transform the example log into the desired format:
- JSON Parser: Convert the JSON in
bodyinto structured fields inattributes. - Move Processor: Move the
messagefield from the parsed JSON intobody. - Timestamp Parser: Extract and map timestamp information from the
timestampfield.
Step 1: JSON Parser - Convert JSON in body to Structured Attributes
Our first step is to parse the raw JSON string residing in the body field so we can work with its fields directly (e.g., message, timestamp) under attributes.
Before Parsing
{
  "message": "Database connection established",
  "timestamp": "2025-10-27T05:30:17Z",
  "level": "INFO"
}
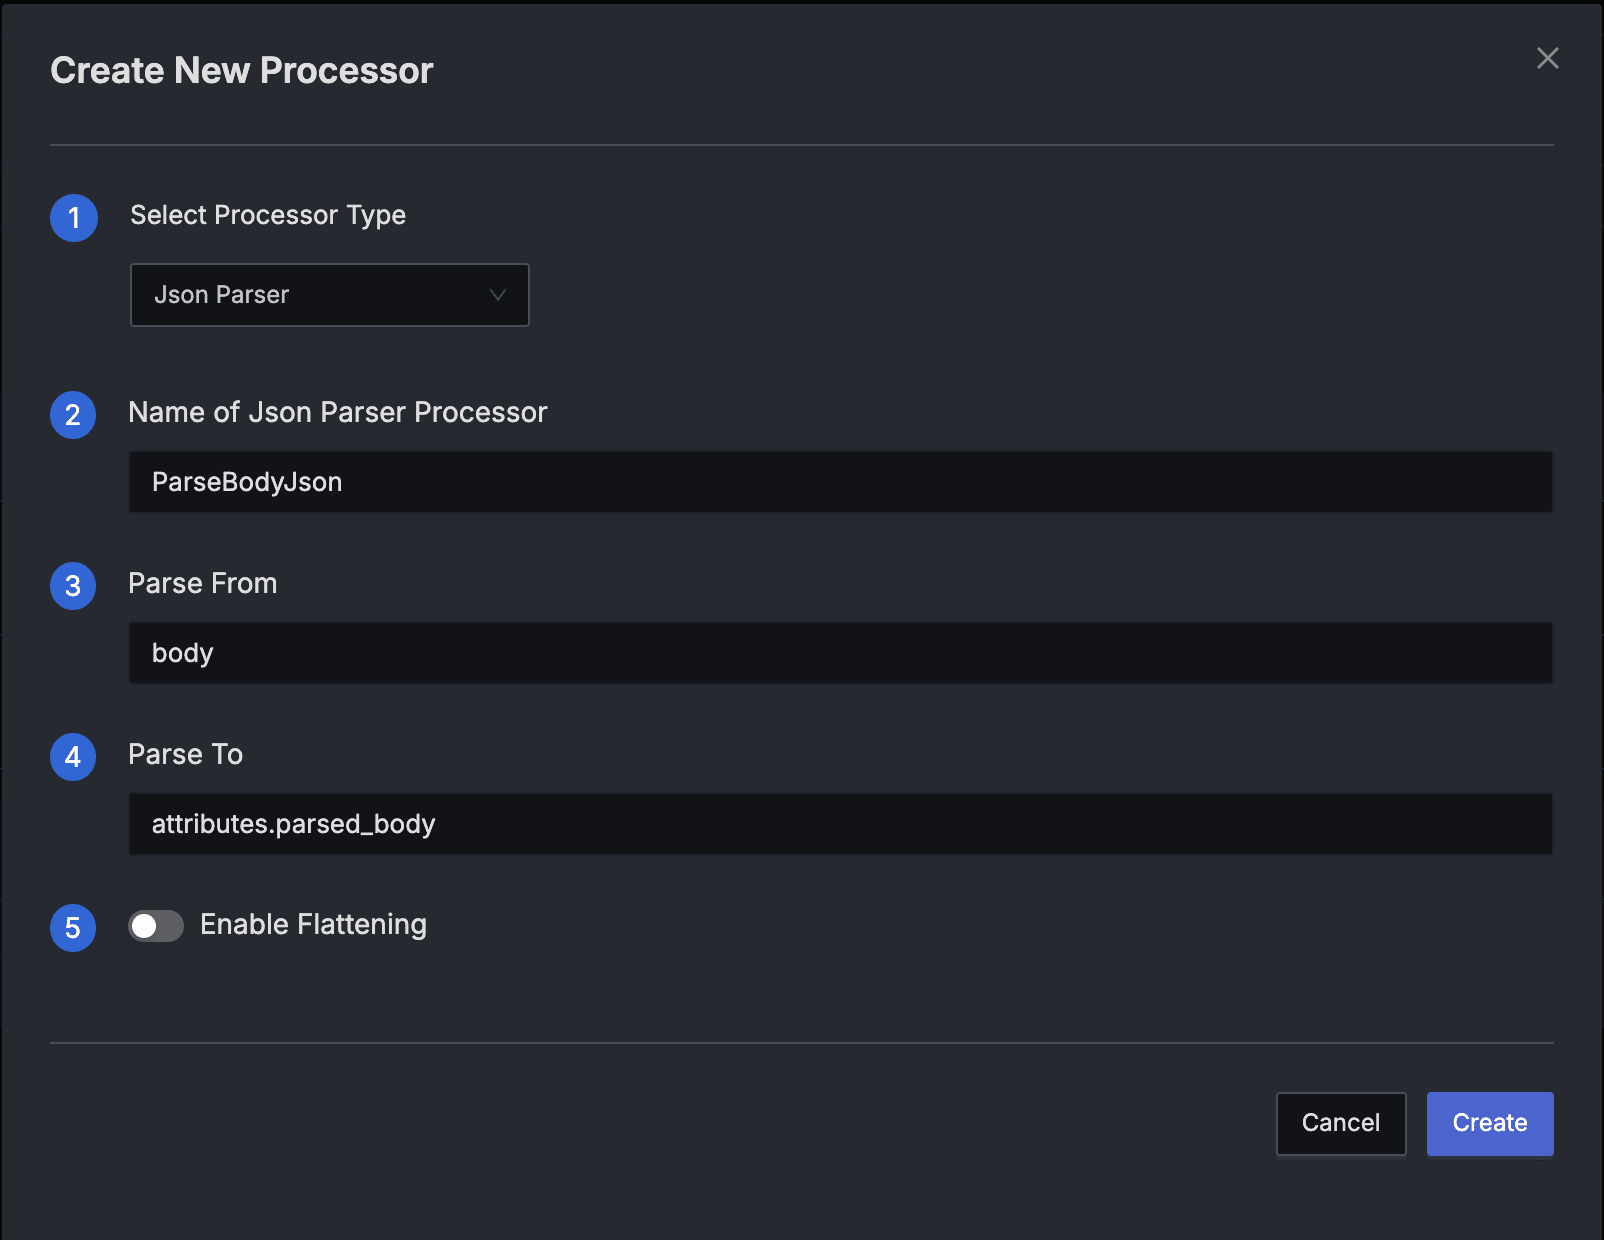
Processor Configuration
Type: JSON Parser
Name: ParseBodyJson
Parse From:
bodyParse To:
attributes.parsed_body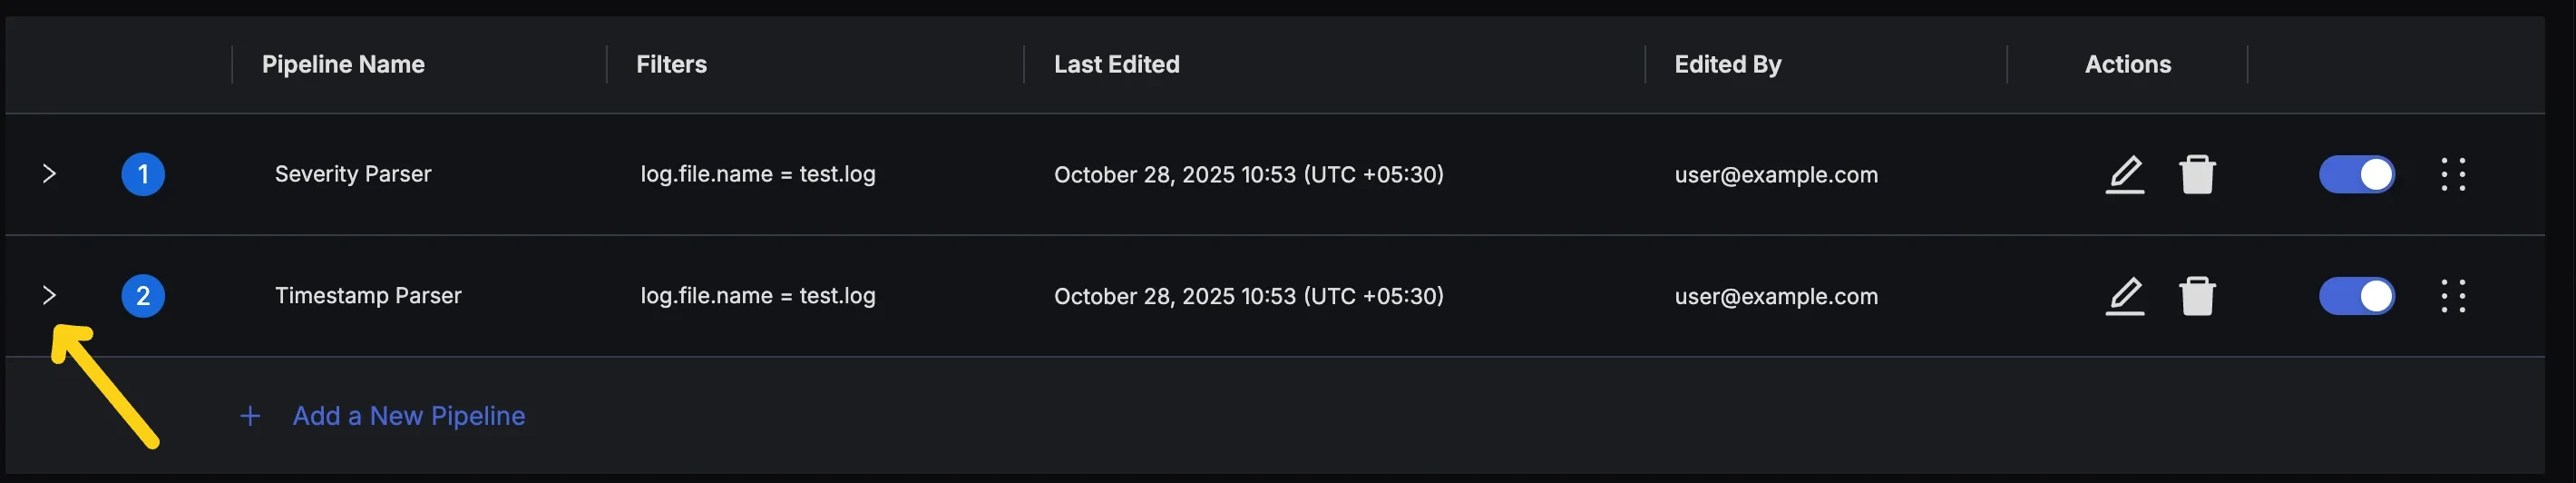
Expand Pipeline to access Processors - Click the Add Processor Button to bring up the Dialog for adding a new processor.
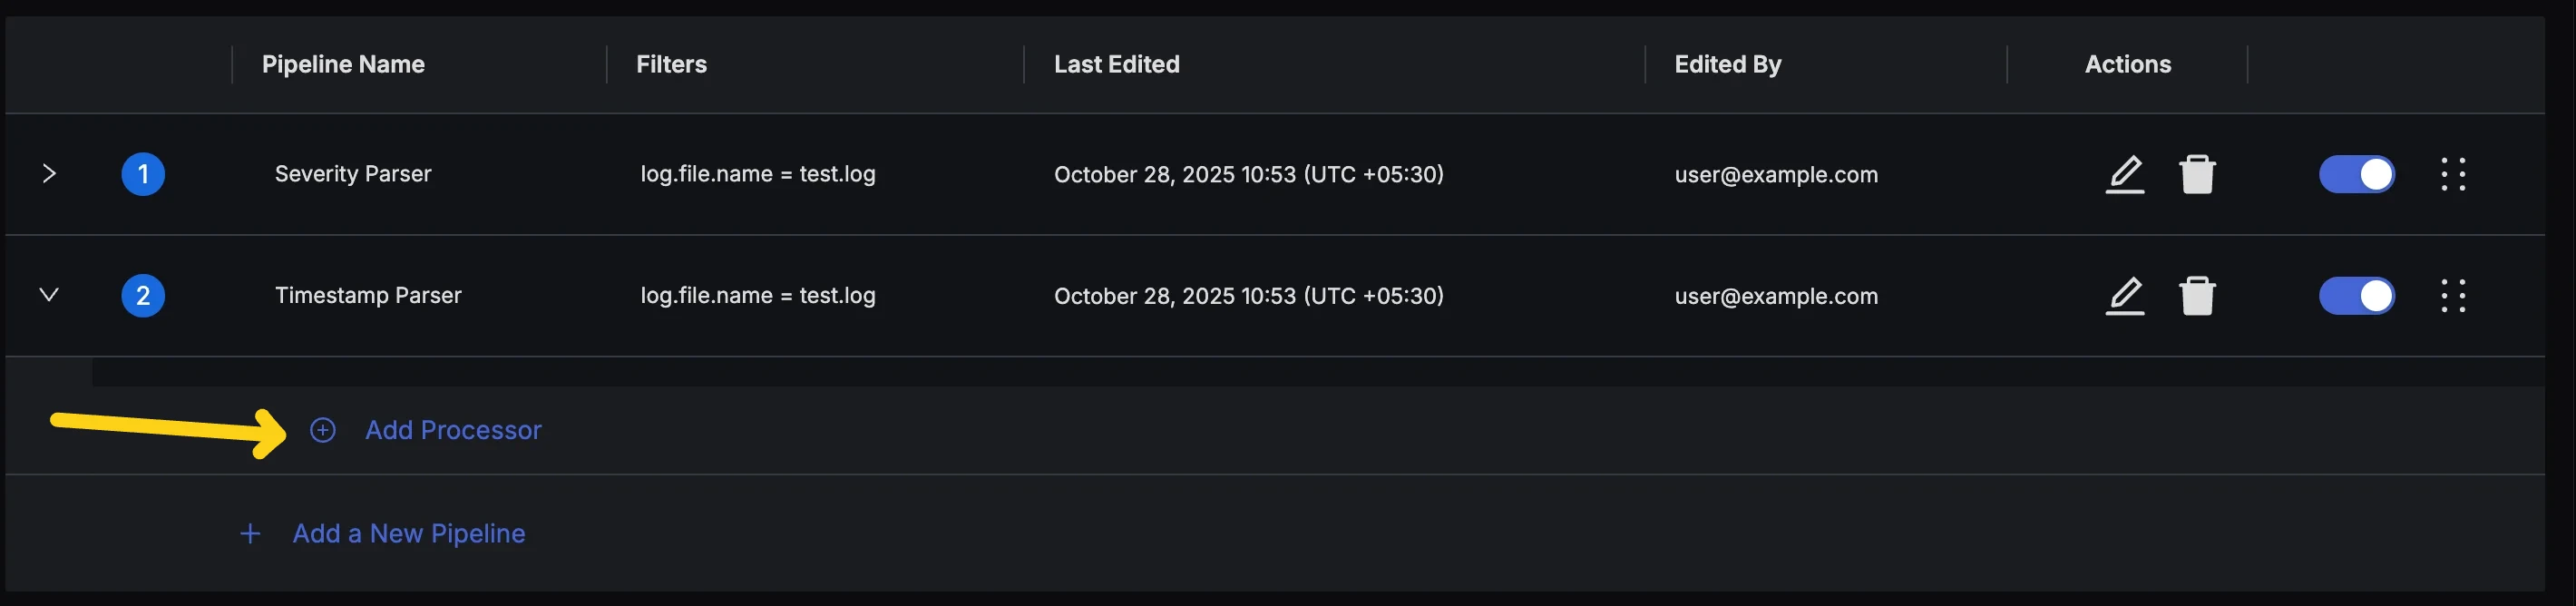
Add Processors Button
- Press the "Create" button to create the Processor.
After Parsing
{
  "body": "{\"message\": \"Database connection established\", \"timestamp\": \"2025-10-27T05:30:17Z\", \"level\": \"INFO\"}",
  "id": "0iNztmsRoLqPNTa7qIA4TlpHNQQ",
  "timestamp": 1761550643438.0002,
  "attributes": {
    "log.file.name": "test.log",
    "parsed_body": "{\"level\":\"INFO\",\"message\":\"Database connection established\",\"timestamp\":\"2025-10-27T05:30:17Z\"}"
  },
  "resources": {
    "service.name": "sample-logs"
  },
  "scope": {},
  "severity_text": "",
  "severity_number": 0,
  "trace_id": "",
  "span_id": "",
  "trace_flags": 0
}
Key Observations
- Fields like
messageandtimestampare now accessible inattributes.parsed_body. - The original
bodyfield still has the raw JSON string.
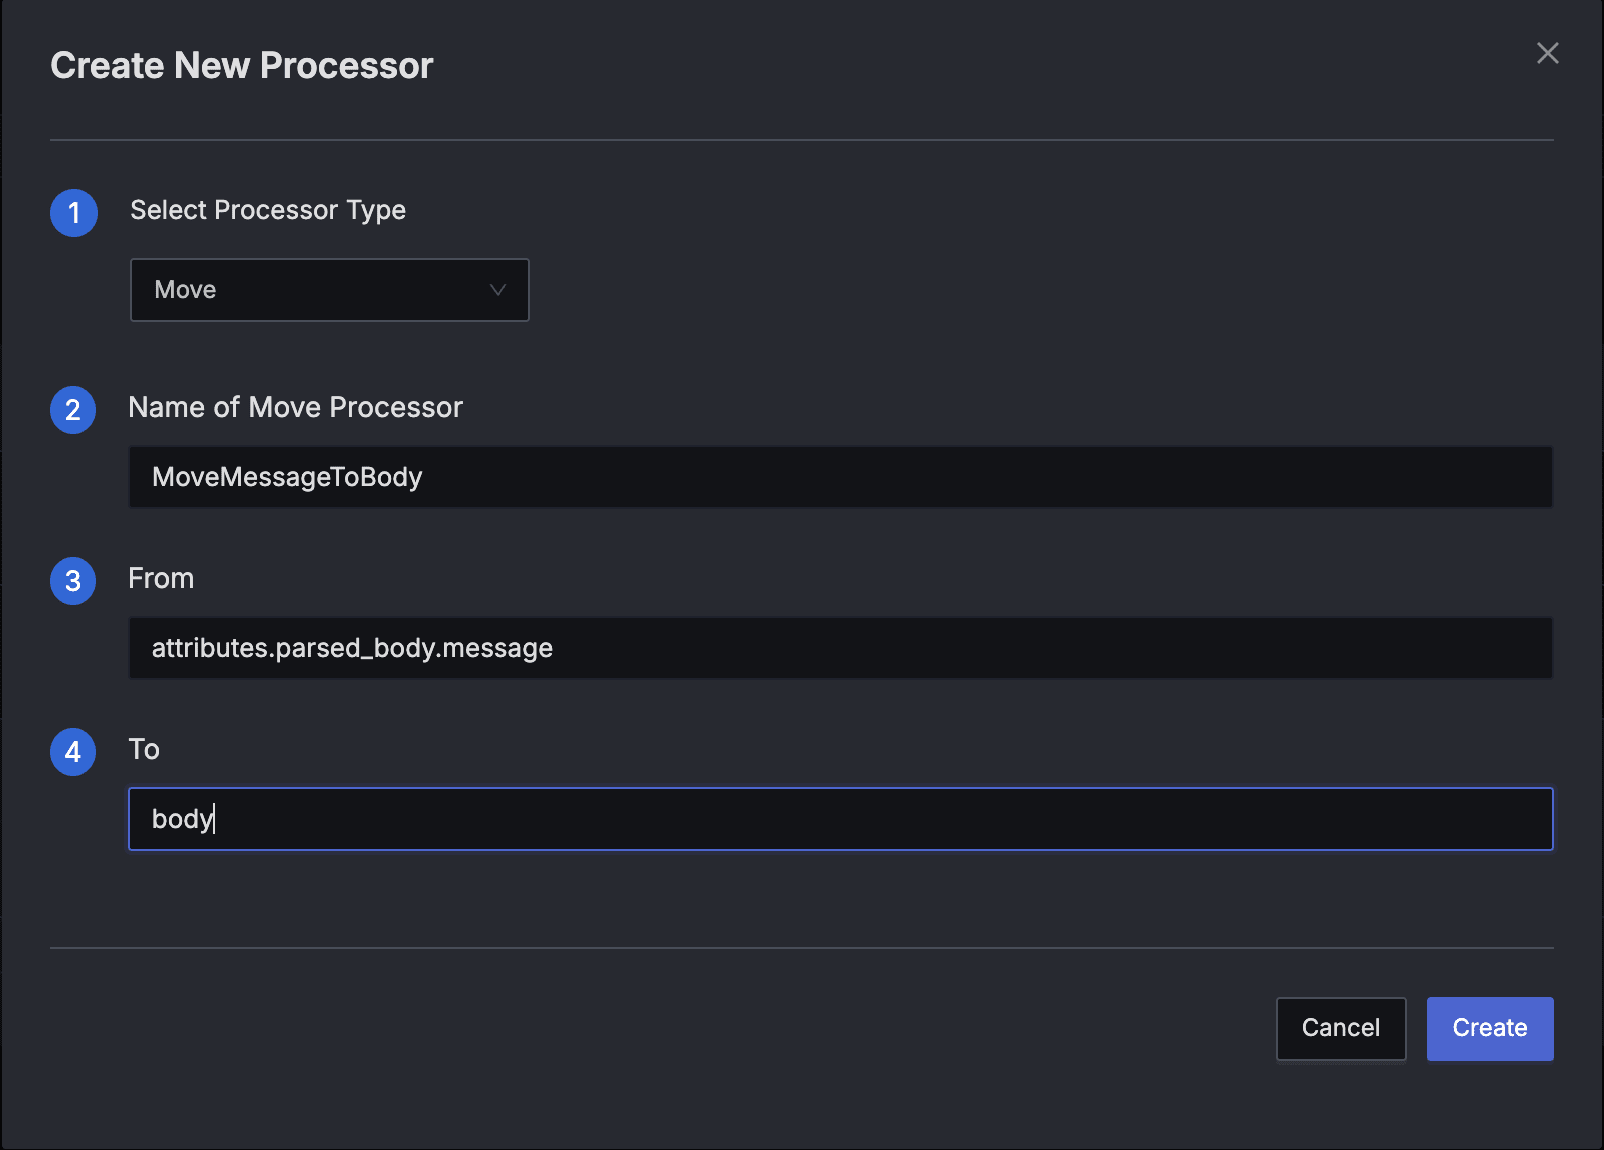
Step 2: Move Processor - Extract the Message Field to body
Now that the message is available at attributes.parsed_body.message, we can move it to the top-level body to clearly indicate that this is the main log message. This is an optional step and you can skip it if you want.
Before Moving Message
{
  "body": "{\"message\": \"Database connection established\", \"timestamp\": \"2025-10-27T05:30:17Z\", \"level\": \"INFO\"}",
  "id": "0iNztmsRoLqPNTa7qIA4TlpHNQQ",
  "timestamp": 1761550643438.0002,
  "attributes": {
    "log.file.name": "test.log",
    "parsed_body": "{\"level\":\"INFO\",\"message\":\"Database connection established\",\"timestamp\":\"2025-10-27T05:30:17Z\"}"
  },
  "resources": {
    "service.name": "sample-logs"
  },
  "scope": {},
  "severity_text": "",
  "severity_number": 0,
  "trace_id": "",
  "span_id": "",
  "trace_flags": 0
}
Processor Configuration
- Type: Move
- Name: MoveMessageToBody
- From:
attributes.parsed_body.message - To:
body
After Moving Message
{
  "body": "Database connection established",
  "id": "0iNztmsRoLqPNTa7qIA4TlpHNQQ",
  "timestamp": 1761550643438.0002,
  "attributes": {
    "log.file.name": "test.log",
    "parsed_body": "{\"level\":\"INFO\",\"timestamp\":\"2025-10-27T05:30:17Z\"}"
  },
  "resources": {
    "service.name": "sample-logs"
  },
  "scope": {},
  "severity_text": "",
  "severity_number": 0,
  "trace_id": "",
  "span_id": "",
  "trace_flags": 0
}
Key Observations
- The main log message is now in
body. attributes.parsed_body.messagehas been removed because Move transfers data rather than copying.
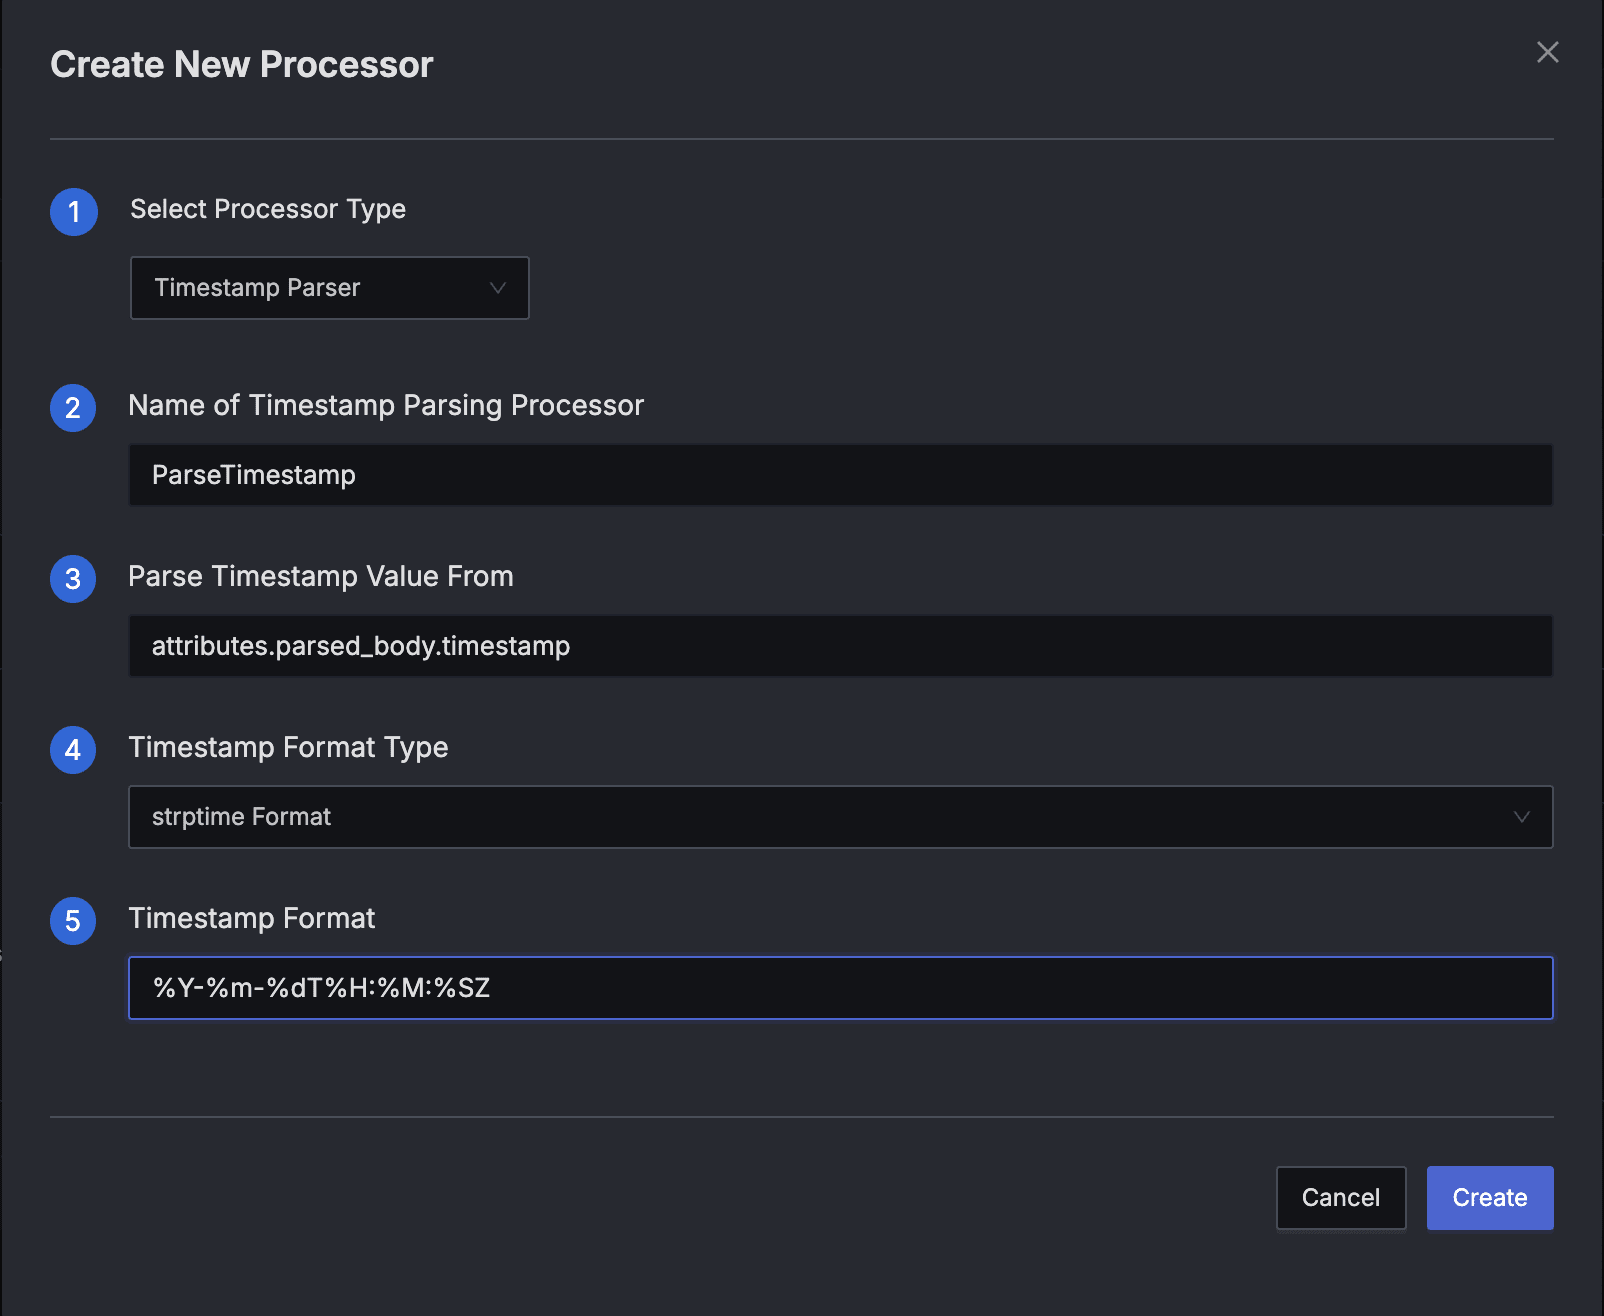
Step 3: Timestamp Parser - Extract and Map Timestamp Information
Now, we'll use the timestamp parser to extract the timestamp information from the attributes.parsed_body.timestamp field.
Before Parsing Timestamp
{
  "body": "Database connection established",
  "id": "0iNztmsRoLqPNTa7qIA4TlpHNQQ",
  "timestamp": 1761550643438.0002,
  "attributes": {
    "log.file.name": "test.log",
    "parsed_body": "{\"level\":\"INFO\",\"timestamp\":\"2025-10-27T05:30:17Z\"}"
  },
  "resources": {
    "service.name": "sample-logs"
  },
  "scope": {},
  "severity_text": "",
  "severity_number": 0,
  "trace_id": "",
  "span_id": "",
  "trace_flags": 0
}
Processor Configuration
- Type: Timestamp Parser
- Name: ParseTimestamp
- Parse Timestamp Value From:
attributes.parsed_body.timestamp - Timestamp Format Type:
strptime Format - Timestamp Format:
%Y-%m-%dT%H:%M:%SZ
Understanding the Timestamp Format
The format %Y-%m-%dT%H:%M:%SZ uses strptime directives to match the timestamp pattern. Here's the breakdown for each component:
%Y- 4-digit year (e.g., 2025)%m- 2-digit month (01-12)%d- 2-digit day of the month (01-31)T- Literal character 'T' (separator between date and time)%H- 2-digit hour in 24-hour format (00-23)%M- 2-digit minute (00-59)%S- 2-digit second (00-59)Z- Literal character 'Z' indicating UTC timezone
For the example timestamp 2025-10-27T05:30:17Z, this format parses to:
- Year: 2025
- Month: 10 (October)
- Day: 27
- Hour: 05
- Minute: 30
- Second: 17
- Timezone: UTC (Z)
You can learn more about timestamp strptime format in the strptime format guide.
After Parsing Timestamp
{
  "body": "Database connection established",
  "id": "0iNztmsRoLqPNTa7qIA4TlpHNQQ",
  "timestamp": 1761543017000,
  "attributes": {
    "log.file.name": "test.log",
    "parsed_body": "{\"level\":\"INFO\",\"timestamp\":\"2025-10-27T05:30:17Z\"}"
  },
  "resources": {
    "service.name": "sample-logs"
  },
  "scope": {},
  "severity_text": "",
  "severity_number": 0,
  "trace_id": "",
  "span_id": "",
  "trace_flags": 0
}
Key Observations:
timestampfield has been updated with the parsed value fromattributes.parsed_body.timestamp.
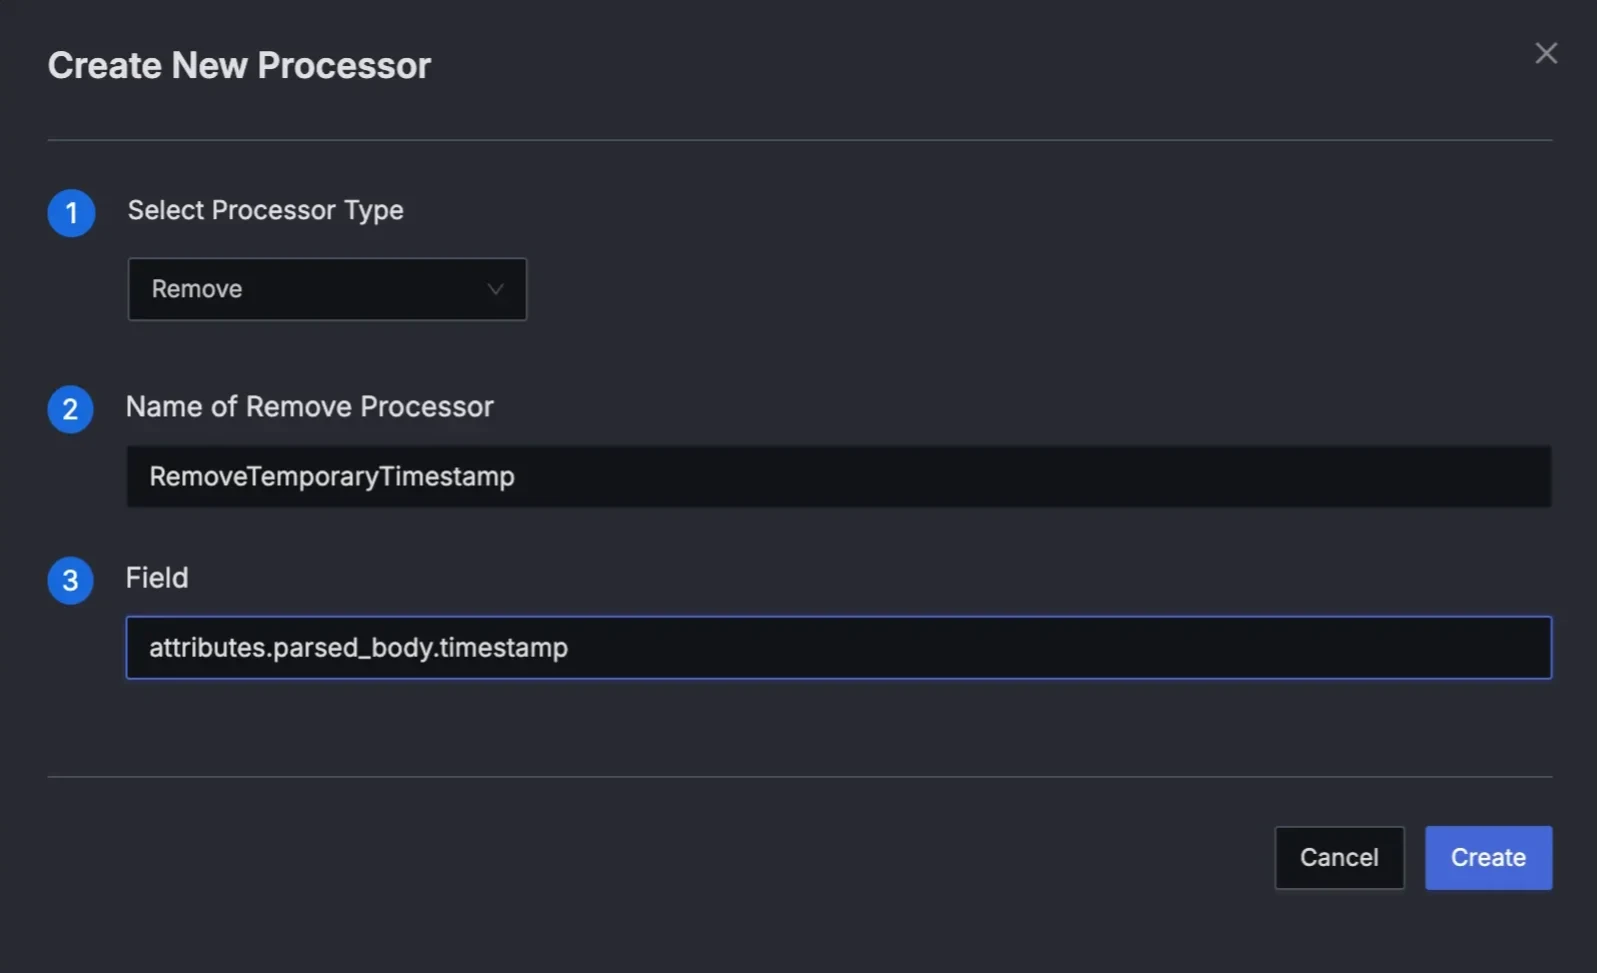
Step 4 (Optional): Clean Up - Organize Final Structure
Finally, let's remove the redundant timestamp from attributes.parsed_body field.
Before Cleanup
{
  "body": "Database connection established",
  "id": "0iNztmsRoLqPNTa7qIA4TlpHNQQ",
  "timestamp": 1761543017000,
  "attributes": {
    "log.file.name": "test.log",
    "parsed_body": "{\"level\":\"INFO\",\"timestamp\":\"2025-10-27T05:30:17Z\"}"
  },
  "resources": {
    "service.name": "sample-logs"
  },
  "scope": {},
  "severity_text": "",
  "severity_number": 0,
  "trace_id": "",
  "span_id": "",
  "trace_flags": 0
}
Remove Redundant Timestamp
Processor Configuration
- Type: Remove
- Name: RemoveTemporaryTimestamp
- Field:
attributes.parsed_body.timestamp
After Cleanup
{
  "body": "Database connection established",
  "id": "0iNztmsRoLqPNTa7qIA4TlpHNQQ",
  "timestamp": 1761543017000,
  "attributes": {
    "log.file.name": "test.log",
    "parsed_body": "{\"level\":\"INFO\"}"
  },
  "resources": {
    "service.name": "sample-logs"
  },
  "scope": {},
  "severity_text": "",
  "severity_number": 0,
  "trace_id": "",
  "span_id": "",
  "trace_flags": 0
}
Key Observations
- The redundant timestamp field has been removed from
attributes.parsed_body. - Only the
levelfield remains in the parsed body, keeping the structure clean.
Step 5: Preview and Validate Pipeline Processing
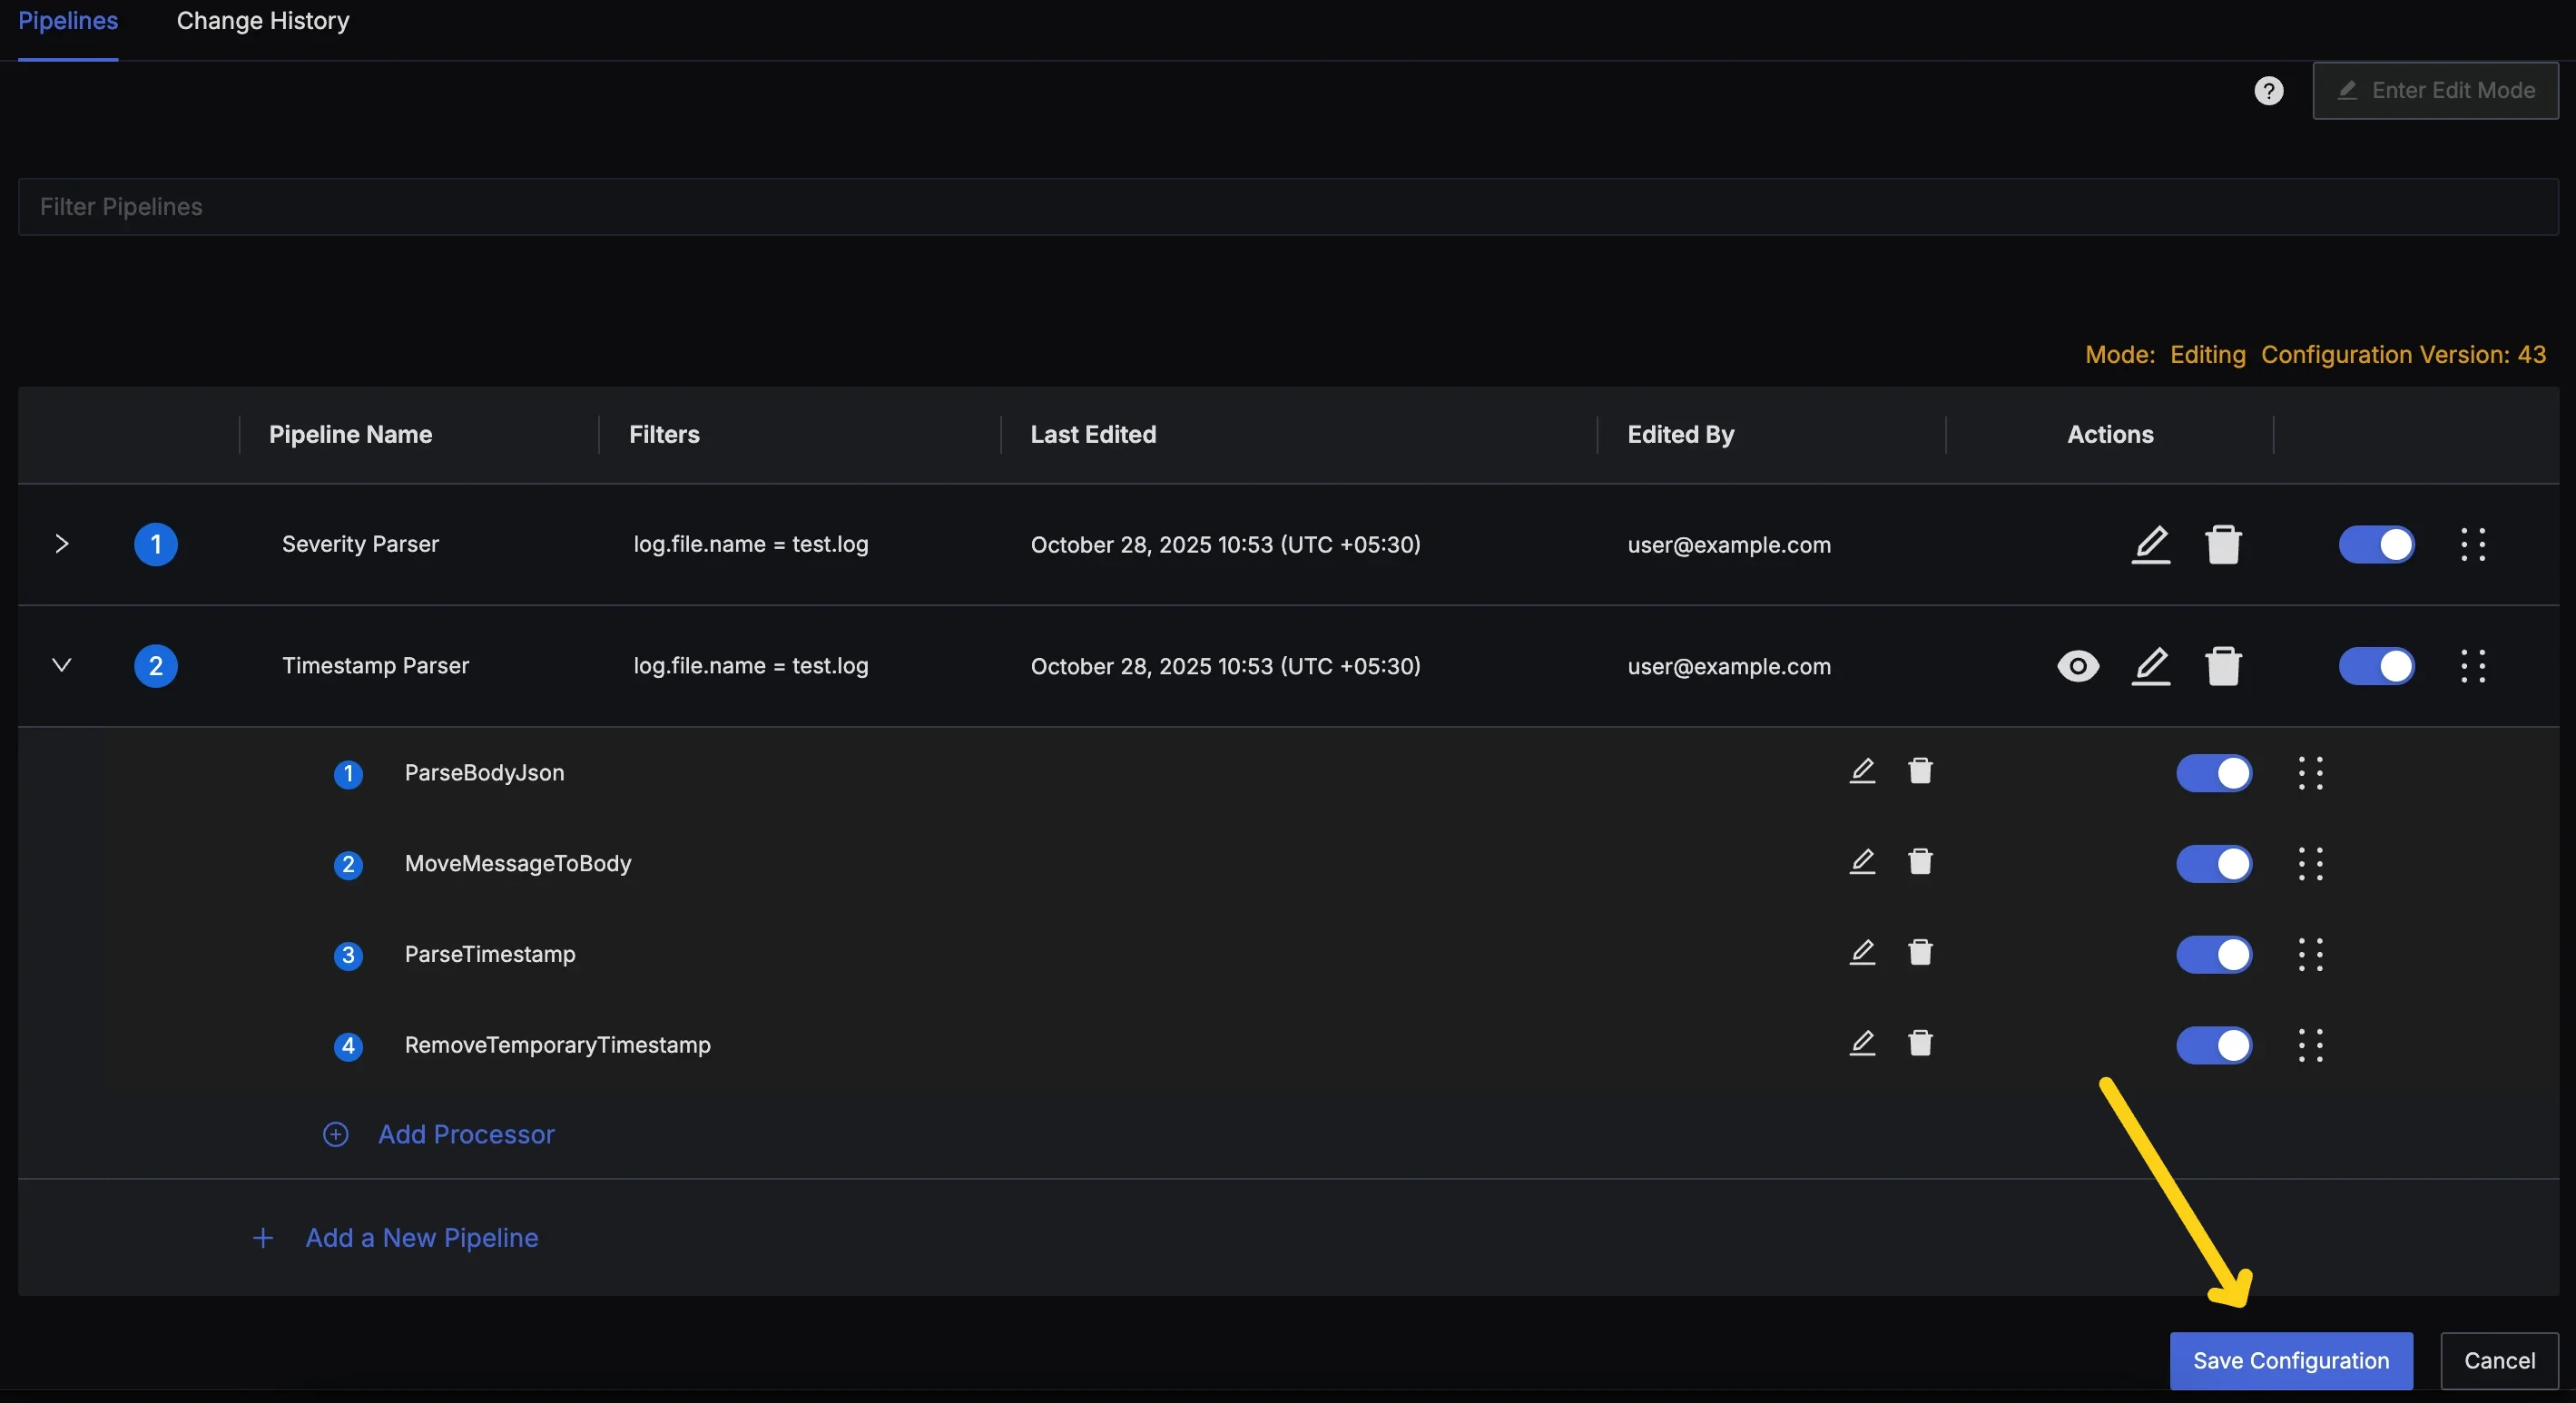
After adding all the processors, the final pipeline should look like this:
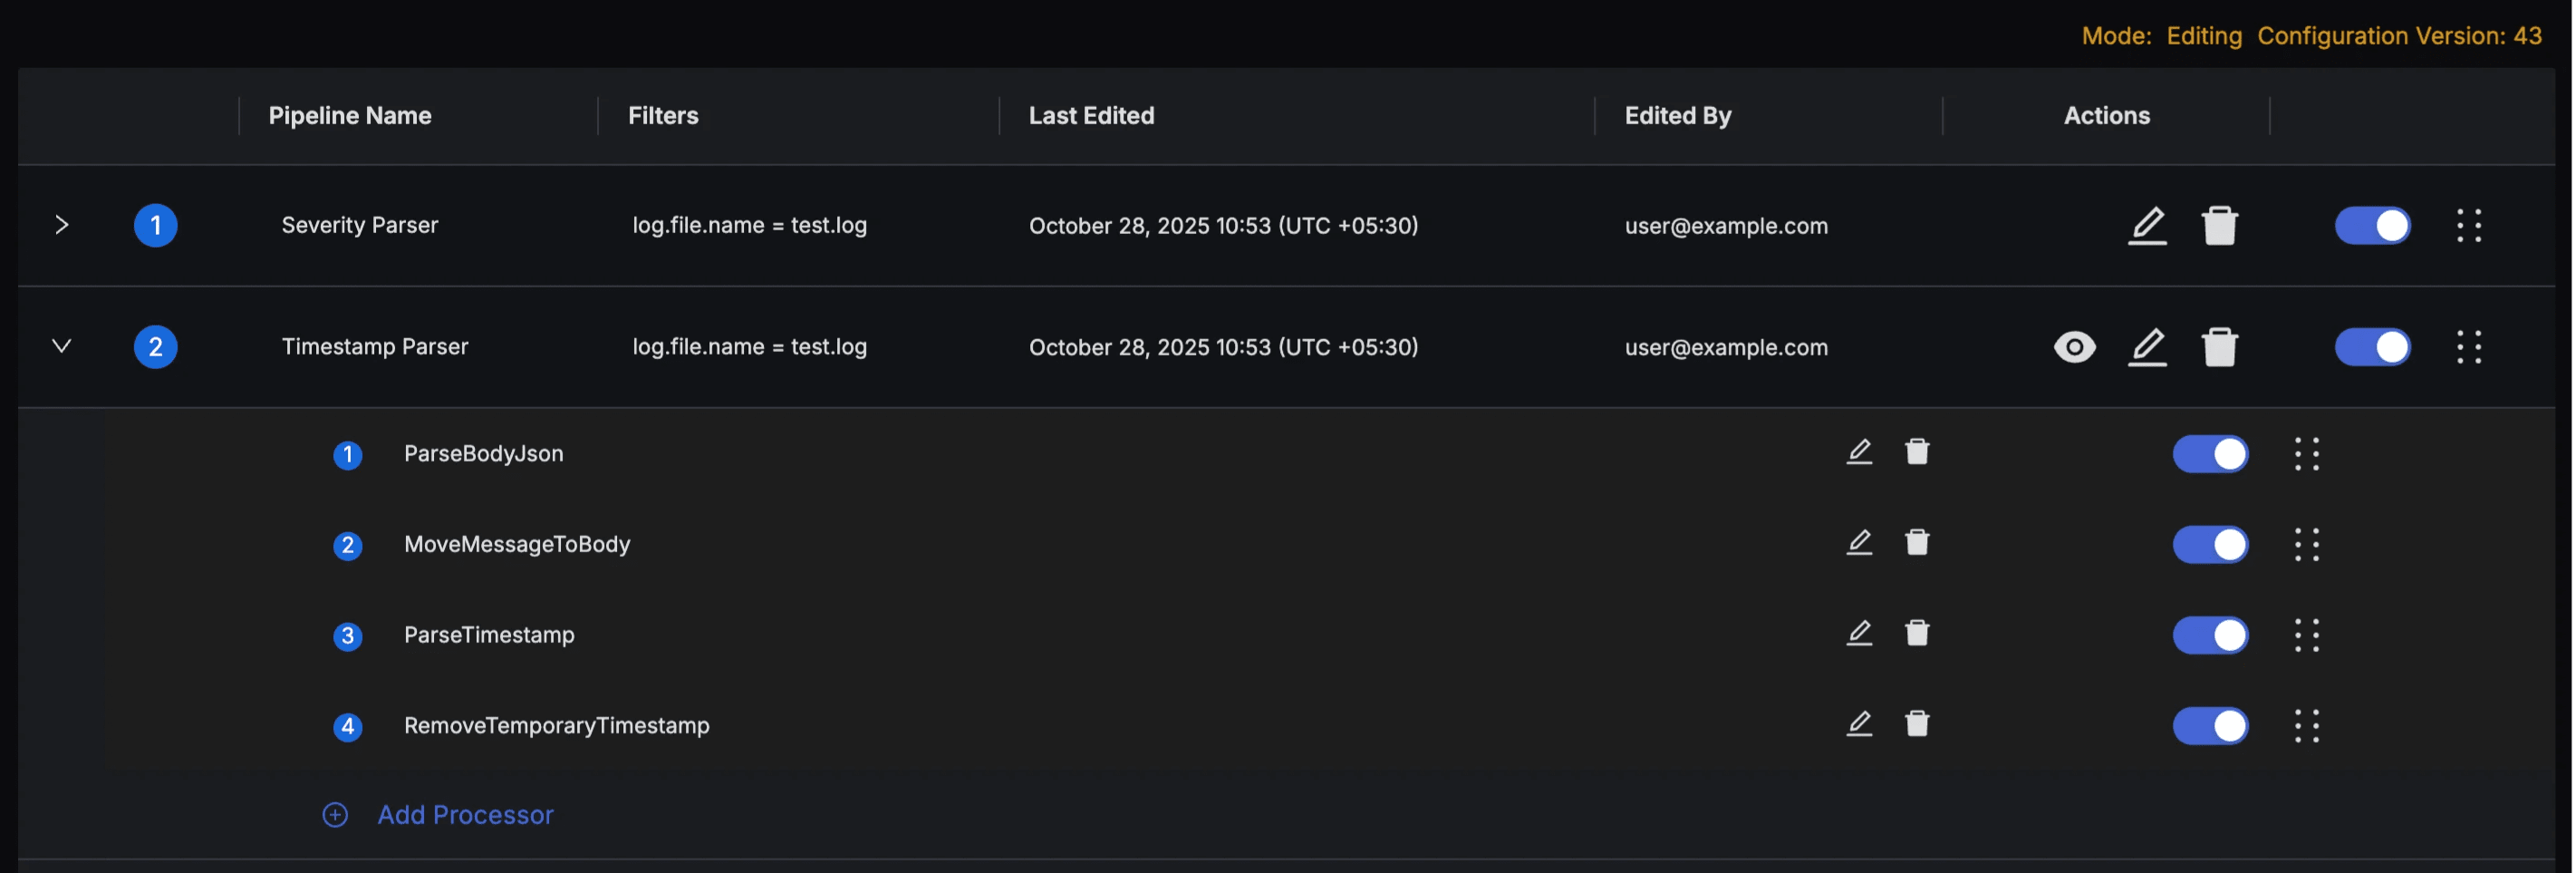
Before you save and deploy the pipeline, check the simulation of pipeline processing on some sample logs to validate that the pipeline works as intended. Click the "eye" icon in the actions column for the pipeline to bring up the Pipeline Preview Dialog.
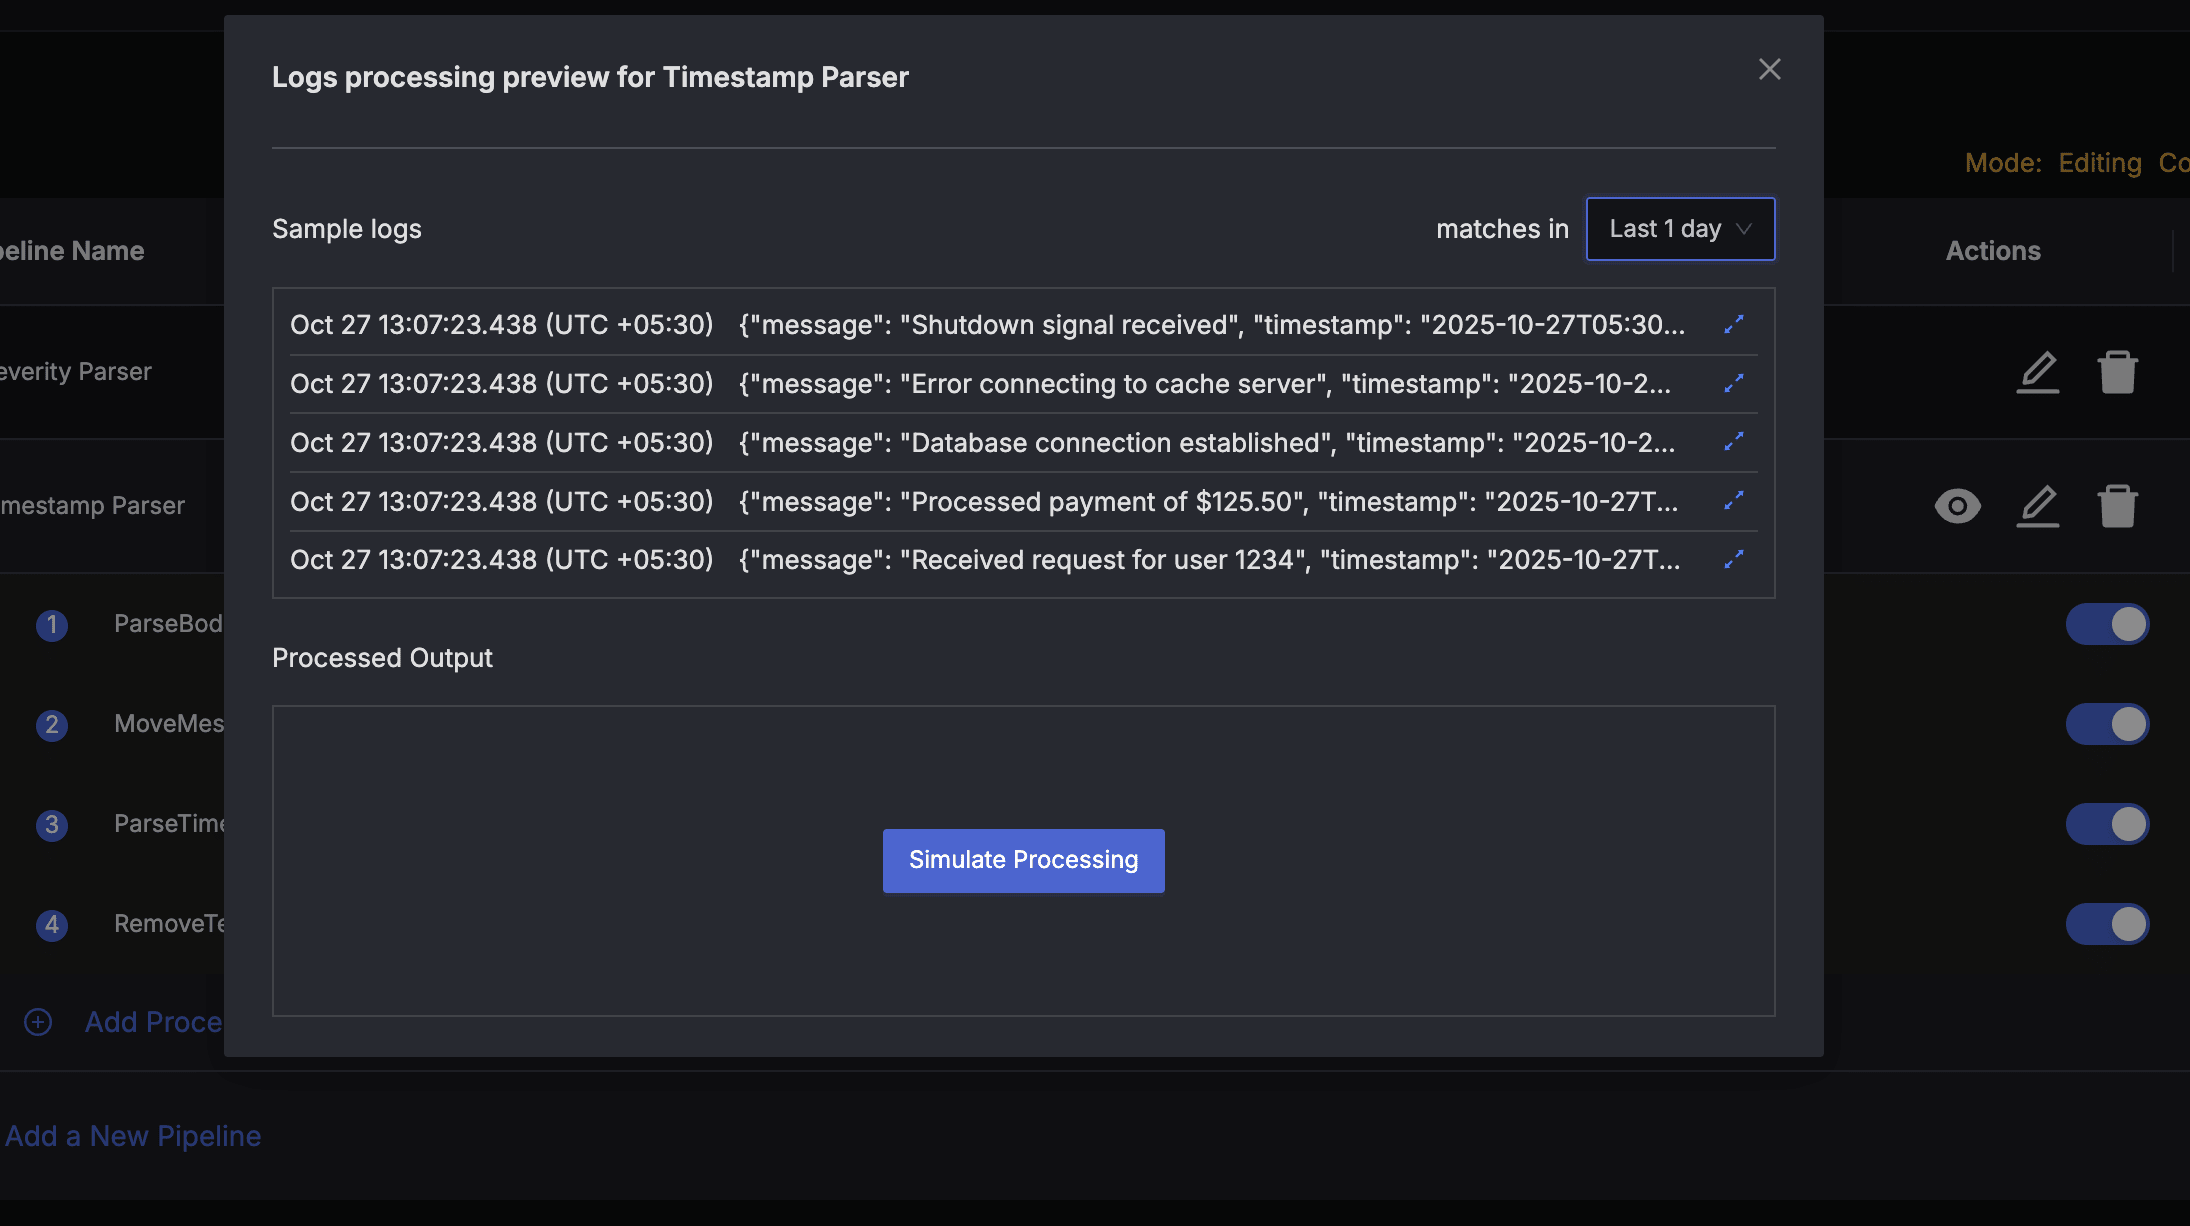
The Preview Dialog will pull sample logs queries. To simulate pipeline processing, press the Simulate Processing button in the bottom section of the Pipeline Preview Dialog. This will simulate pipeline processing on the sample logs and show the output.
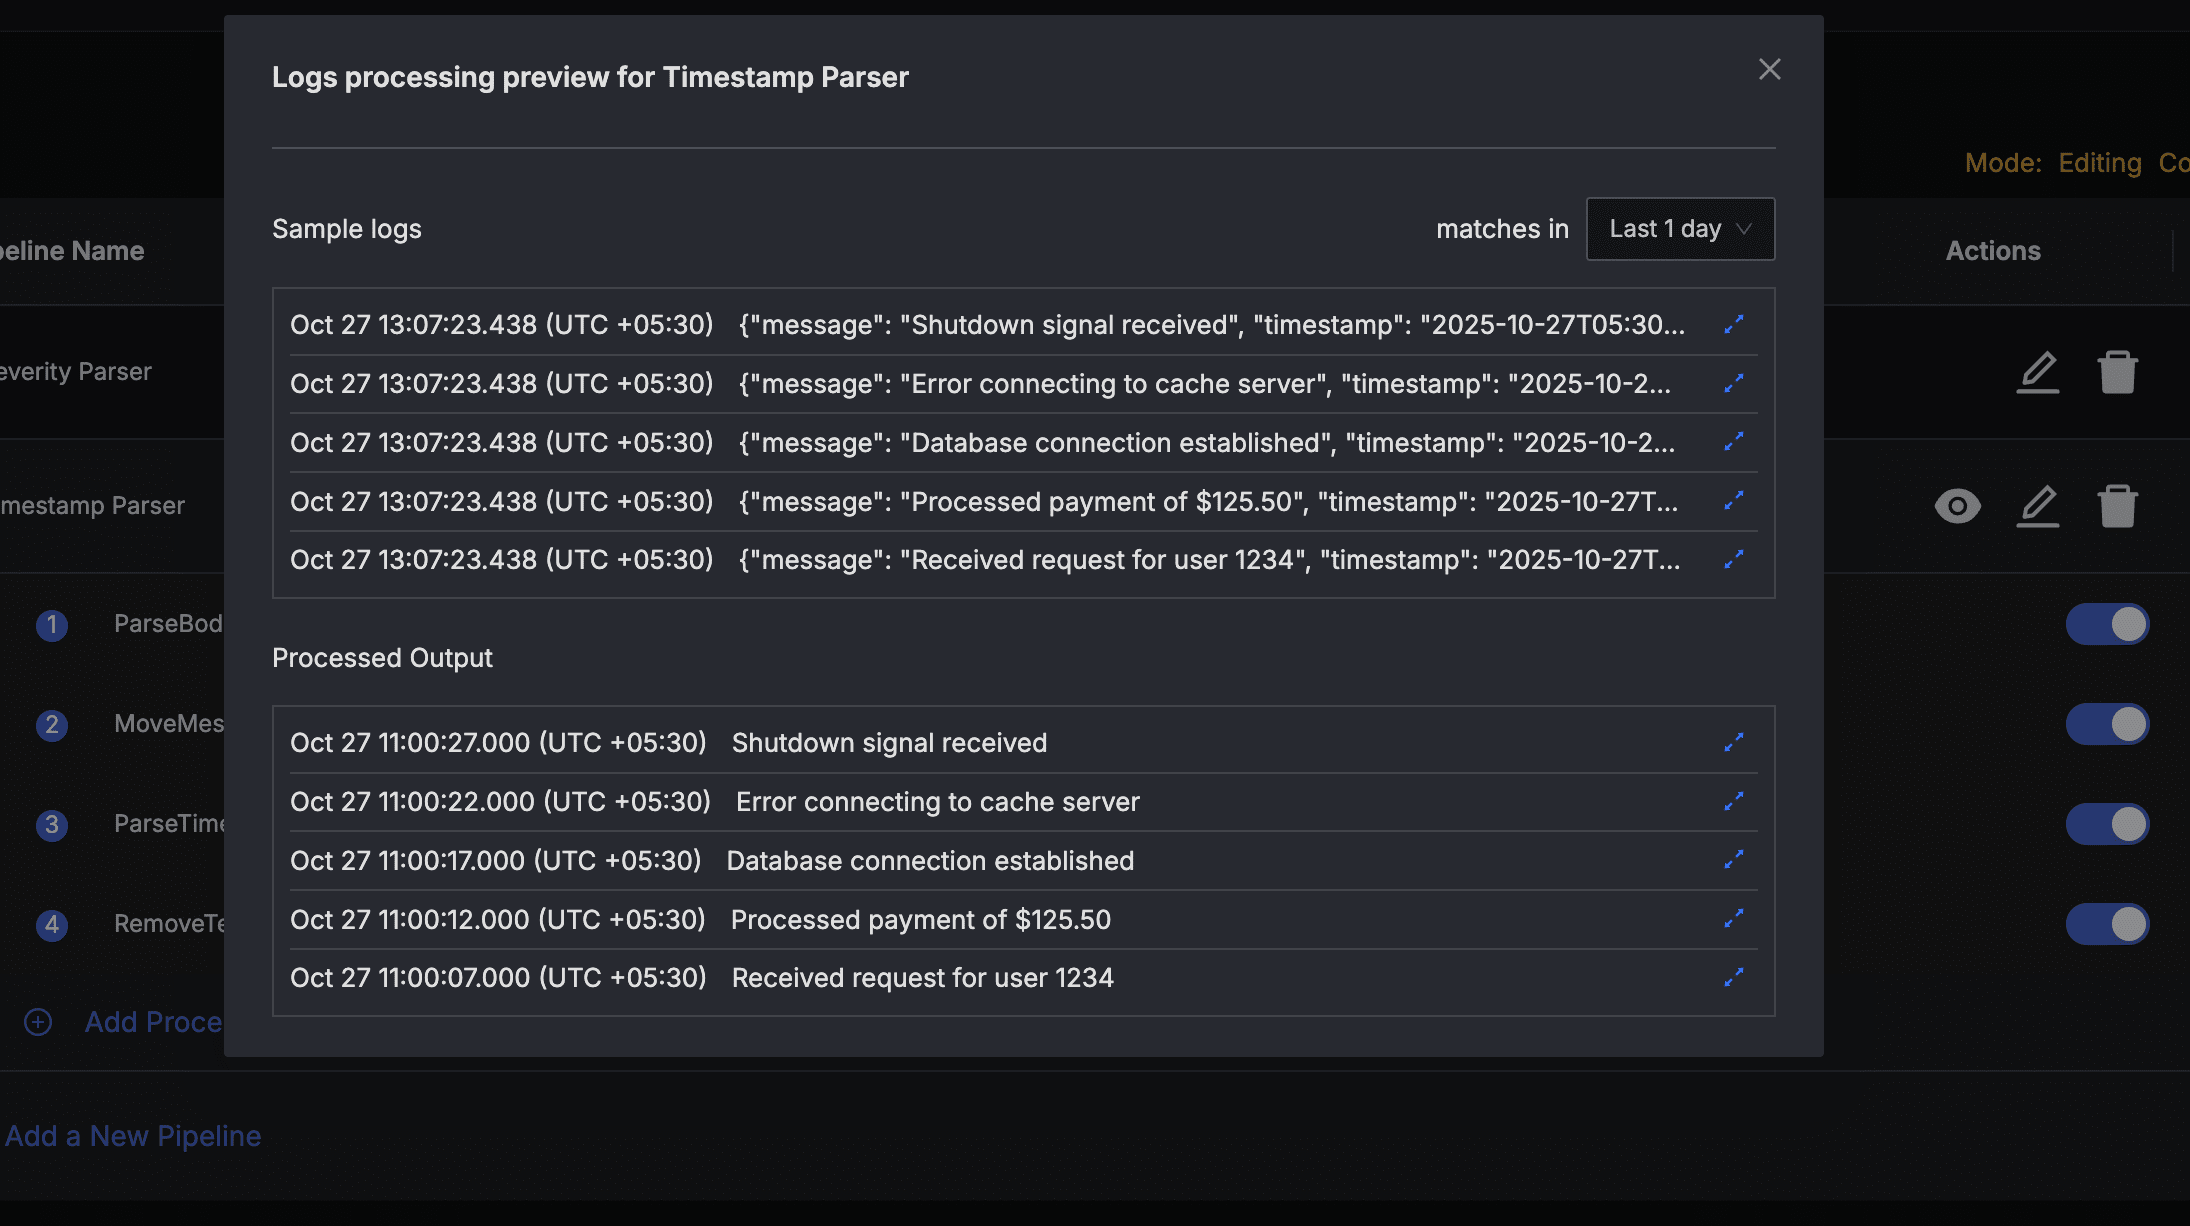
You can click on the expand icon on the right end of each processed log to open the detailed view for that log entry.
Step 6: Save Pipelines and Verify
After verifying the simulated logs in Pipeline Preview Dialog, to save the pipeline, press the Save Configuration button at the bottom of the pipelines list to save pipelines. This will store the latest state of your pipelines and will deploy them for pre-processing.
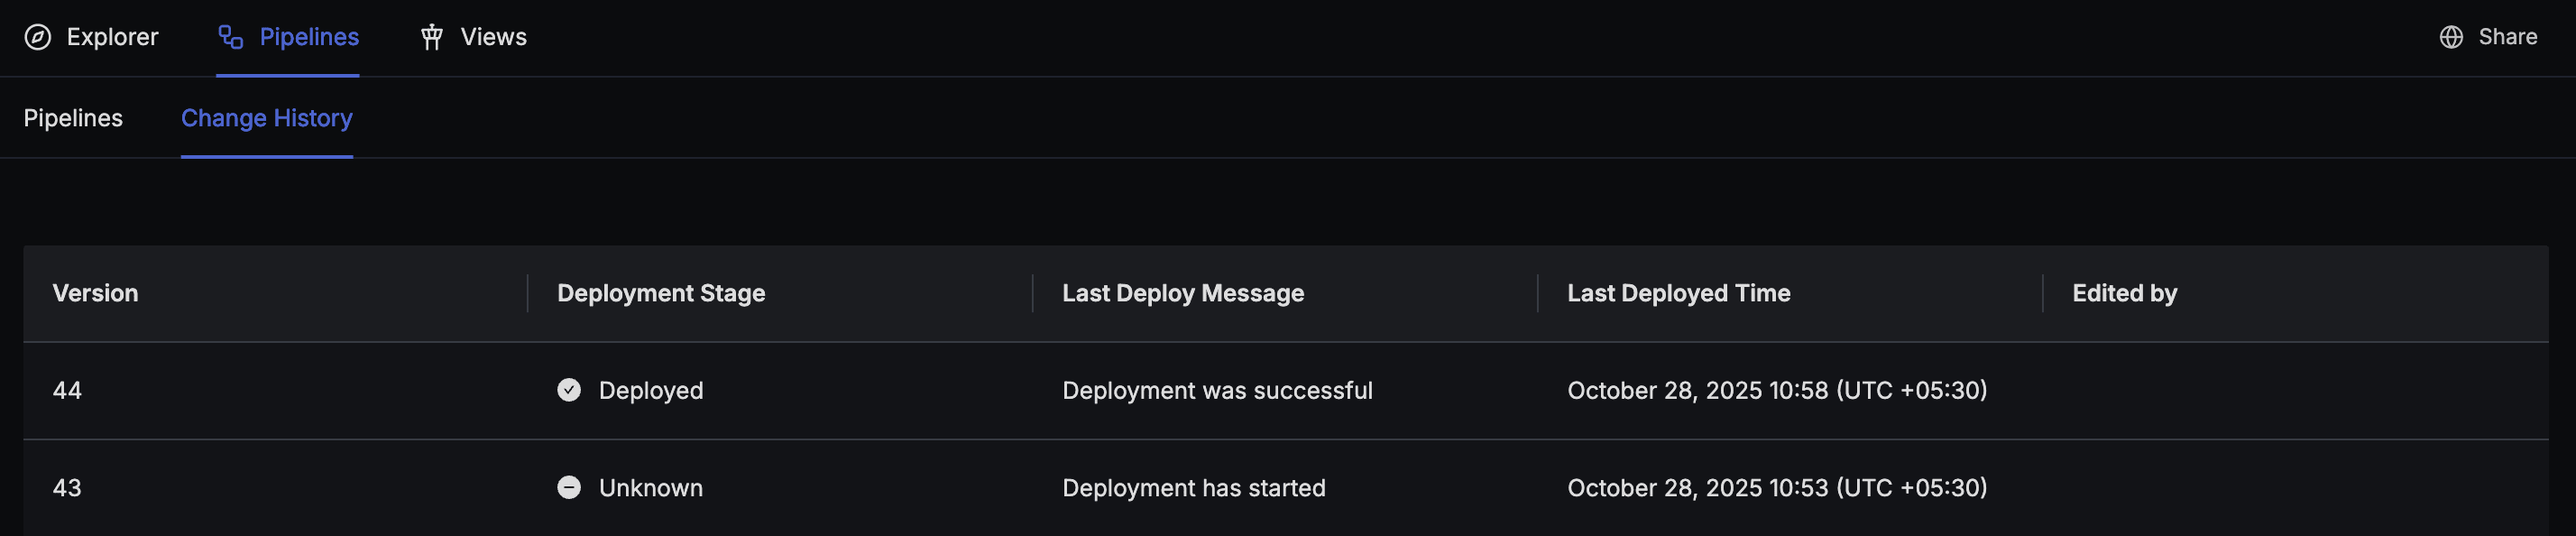
You can track the deployment status of your pipelines using the Change History tab at the top of pipelines.
Final Outcome
After applying these processors in sequence, your log now has:
- The main log message clearly displayed in
body. - Properly mapped timestamp at the top level for filtering and alerting.
Get Help
If you need help with the steps in this topic, please reach out to us on SigNoz Community Slack.
If you are a SigNoz Cloud user, please use in product chat support located at the bottom right corner of your SigNoz instance or contact us at cloud-support@signoz.io.
