Introduction
Celery is a distributed task queue, written in Python, that allows you to offload time-consuming tasks from your main application, enabling asynchronous execution and improving responsiveness. Celery is a simple, flexible, and reliable distributed system to process vast amounts of messages, while providing operations with the tools required to maintain such a system. It’s a task queue with focus on real-time processing, while also supporting task scheduling.
There are two ways of instrumentation Celery metrics and traces:
-
Using Auto-instrumentation: This is the recommended way of instrumenting celery metrics and traces. As the name suggests, you need not make any code changes to your Celery code. Setting up appropriate dependencies and environment variables is sufficient to instrument the metrics and traces.
-
Using Manual Instrumentation: This is generally used when you want to push out some custom metrics or traces. This requires you to make changes in your Celery code in order to push out the metrics and traces.
Both these methods are described in detail below.
Using Auto-instrumentation
This is the recommended approach for instrumenting metrics and traces. The metrics and traces can be auto-instrumented from
Celery using opentelemetry-instrument.
Step 1: Installing opentelemetry-instrumentation
You need to install the OpenTelemetry instrumentation dependency using pip as:
pip install opentelemetry-instrumentation
Step 2: Setup environment variables
You need to ensure all the environment variables are setup on the celery components in order to send all the telemetry to your locally running otel collector agent. Here are the environment variables that need to be set:
env:
  - name: CELERY_BROKER_URL
    value: amqp://guest:guest@rabbitmq:5672//
  - name: OTEL_SERVICE_NAME
    value: "celery_worker1"
  - name: OTEL_EXPORTER_OTLP_PROTOCOL
    value: "http/protobuf"
  - name: OTEL_EXPORTER_OTLP_LOGS_ENDPOINT
    value: "http://otel-collector-service:4318/v1/logs"
  - name: OTEL_EXPORTER_OTLP_METRICS_ENDPOINT
    value: "http://otel-collector-service:4318/v1/metrics"
  - name: OTEL_EXPORTER_OTLP_TRACES_ENDPOINT
    value: "http://otel-collector-service:4318/v1/traces"
Step 3: Setup OpenTelemetry Collector
Install and configure OpenTelemetry for scraping the metrics from Celery. Follow OpenTelemetry Binary Usage in Virtual Machine guide for detailed instructions.
Create a file config.yaml. Here, we will setup the OpenTelemetry Collector config where we will use prometheus receiver which will scrape the metrics from the Confluent Cloud Metrics API.
Here are the contents of the config.yaml file:
receivers:
  otlp:
    protocols:
      grpc:
        endpoint: 0.0.0.0:4317
      http:
        endpoint: 0.0.0.0:4318
  prometheus:
    config:
      scrape_configs:
        - job_name: 'flower'
          scrape_interval: 1s
          metrics_path: /metrics
          static_configs:
            - targets: ['flower:5555']
processors:
  batch:
    timeout: 10s
exporters:
  debug:
#    verbosity: detailed
  otlp:
    endpoint: "ingest.<region>.signoz.cloud:443"
    tls:
      insecure: false
    headers:
      "signoz-ingestion-key": "<your-ingestion-key>"
service:
  pipelines:
    metrics:
      receivers: [otlp, prometheus]
      exporters: [otlp, debug]
    logs:
      receivers: [otlp]
      exporters: [otlp, debug]
    traces:
      receivers: [otlp]
      exporters: [otlp, debug]
<region>: Your SigNoz Cloud region<your-ingestion-key>: Your SigNoz ingestion key
receivers:
  otlp:
    protocols:
      grpc:
        endpoint: 0.0.0.0:4317
      http:
        endpoint: 0.0.0.0:4318
  prometheus:
    config:
      scrape_configs:
        - job_name: 'flower'
          scrape_interval: 1s
          metrics_path: /metrics
          static_configs:
            - targets: ['flower:5555']
processors:
  batch:
    timeout: 10s
exporters:
  debug:
#    verbosity: detailed
  otlp:
    endpoint: "<IP of machine hosting SigNoz>:4317"
    tls:
      insecure: true
service:
  pipelines:
    metrics:
      receivers: [otlp, prometheus]
      exporters: [otlp, debug]
    logs:
      receivers: [otlp]
      exporters: [otlp, debug]
    traces:
      receivers: [otlp]
      exporters: [otlp, debug]
After successful configuration start the OpenTelemetry Collector using following command:
./otelcol-contrib --config ./config.yaml &> otelcol-output.log & echo "$!" > otel-pid
Step 4: Auto-instrumenting Celery
You can now use opentelemetry-instrument command to auto-instrument Celery.
For example, if you have your task generators named as generator1.py you can run the following command to enable
auto instrumentation for generators.
opentelemetry-instrument python generator1.py
Using Manual Instrumentation
You can also manually instrument the Celery metrics using OpenTelemetry SDK. The manual instrumentation approach should only be adopted in case you want to export custom metrics and traces.
Step 1: Setup dependencies
You need to install various python dependencies for OpenTelemetry instrumentation:
pip install celery \
            redis \
            opentelemetry-api \
            opentelemetry-sdk \
            opentelemetry-instrumentation-celery \
            opentelemetry-exporter-otlp
Step 2: Configuring OpenTelemetry SDK
The following code instruments the OpenTelemetry metrics for Celery.
from opentelemetry import metrics, trace
from opentelemetry.exporter.otlp.proto.grpc.trace_exporter import (
    OTLPSpanExporter,
)
from opentelemetry.instrumentation.celery import CeleryInstrumentor
from opentelemetry.sdk.resources import Resource
from opentelemetry.sdk.metrics import MeterProvider
from opentelemetry.sdk.metrics.export import (
    ConsoleMetricExporter,
    PeriodicExportingMetricReader,
)
from opentelemetry.sdk.trace import TracerProvider
from opentelemetry.sdk.trace.export import BatchSpanProcessor

CeleryInstrumentor().instrument()

#Setup traces provide
resource = Resource.create(attributes={
    "service.name": "celery-service",
})
trace.set_tracer_provider(TracerProvider(resource=resource))
span_processor = BatchSpanProcessor(OTLPSpanExporter())
trace.get_tracer_provider().add_span_processor(span_processor)

#Setup metrics provider
metric_reader = PeriodicExportingMetricReader(ConsoleMetricExporter())
provider = MeterProvider(metric_readers=[metric_reader])

# Sets the global default meter provider
metrics.set_meter_provider(provider)

# Creates a meter from the global meter provider
meter = metrics.get_meter("celery.service")
This file needs to be imported for instrumenting the metric from any Celery application.
Step 3: Setup OpenTelemetry Collector
Install and configure OpenTelemetry for scraping the metrics from Celery. Follow OpenTelemetry Binary Usage in Virtual Machine guide for detailed instructions.
Create a file config.yaml. Here, we will setup the OpenTelemetry Collector config where we will use prometheus receiver which will scrape the metrics from the Confluent Cloud Metrics API.
Here are the contents of the config.yaml file:
receivers:
  otlp:
    protocols:
      grpc:
        endpoint: 0.0.0.0:4317
      http:
        endpoint: 0.0.0.0:4318
  prometheus:
    config:
      scrape_configs:
        - job_name: 'flower'
          scrape_interval: 1s
          metrics_path: /metrics
          static_configs:
            - targets: ['flower:5555']
processors:
  batch:
    timeout: 10s
exporters:
  debug:
#    verbosity: detailed
  otlp:
    endpoint: "ingest.<region>.signoz.cloud:443"
    tls:
      insecure: false
    headers:
      "signoz-ingestion-key": "<your-ingestion-key>"
service:
  pipelines:
    metrics:
      receivers: [otlp, prometheus]
      exporters: [otlp, debug]
    logs:
      receivers: [otlp]
      exporters: [otlp, debug]
    traces:
      receivers: [otlp]
      exporters: [otlp, debug]
<region>: Your SigNoz Cloud region<your-ingestion-key>: Your SigNoz ingestion key
receivers:
  otlp:
    protocols:
      grpc:
        endpoint: 0.0.0.0:4317
      http:
        endpoint: 0.0.0.0:4318
  prometheus:
    config:
      scrape_configs:
        - job_name: 'flower'
          scrape_interval: 1s
          metrics_path: /metrics
          static_configs:
            - targets: ['flower:5555']
processors:
  batch:
    timeout: 10s
exporters:
  debug:
#    verbosity: detailed
  otlp:
    endpoint: "<IP of machine hosting SigNoz>:4317"
    tls:
      insecure: true
service:
  pipelines:
    metrics:
      receivers: [otlp, prometheus]
      exporters: [otlp, debug]
    logs:
      receivers: [otlp]
      exporters: [otlp, debug]
    traces:
      receivers: [otlp]
      exporters: [otlp, debug]
After successful configuration start the OpenTelemetry Collector using following command:
./otelcol-contrib --config ./config.yaml &> otelcol-output.log & echo "$!" > otel-pid
Step 4: Setup Celery Application
You can now proceed to your Celery application code. It is necessary that you import the Celery instrumentation file in order to instrument the metrics.
# Import the instrumentation setup early
import instrumentation  # This will instrument Celery tasks

from celery import Celery

# Initialize the Celery app (adjust the broker URL as needed)
app = Celery('tasks', broker='redis://localhost:6379/0')

# Define the task
@app.task
def add(x, y):
    return x + y
You can now run the Celery application as follows:
celery -A tasks worker --loglevel=info
The task can then be invoked using the Python console as:
> from tasks import add
# Invoke `add` task with two values to be added
> add.delay(1, 4)
Step 5: Enabling flower metrics collection (Optional)
While using celery, you can optionally enable flower metrics collection. You can read about flower in the official docs .
You can start flower using the following command:
celery -A tasks.app flower
Flower supports prometheus format so we can use prometheus receiver from the collector.
Once flower is added to all your celery executors you can add the below config in the receivers of the OpenTelemetry collector:
prometheus:
  config:
    scrape_configs:
      - job_name: 'flower'
        scrape_interval: 1s
        metrics_path: /metrics
        static_configs:
          - targets: ['flower:5555']
Celery Dashboard in SigNoz
Open the SigNoz Dashboard, and navigate to Messaging Queues from the left navigation menu. Select Celery from the top of the page. Once the metrics start flowing in, you should see the dashboard getting populated with metrics as shown below.
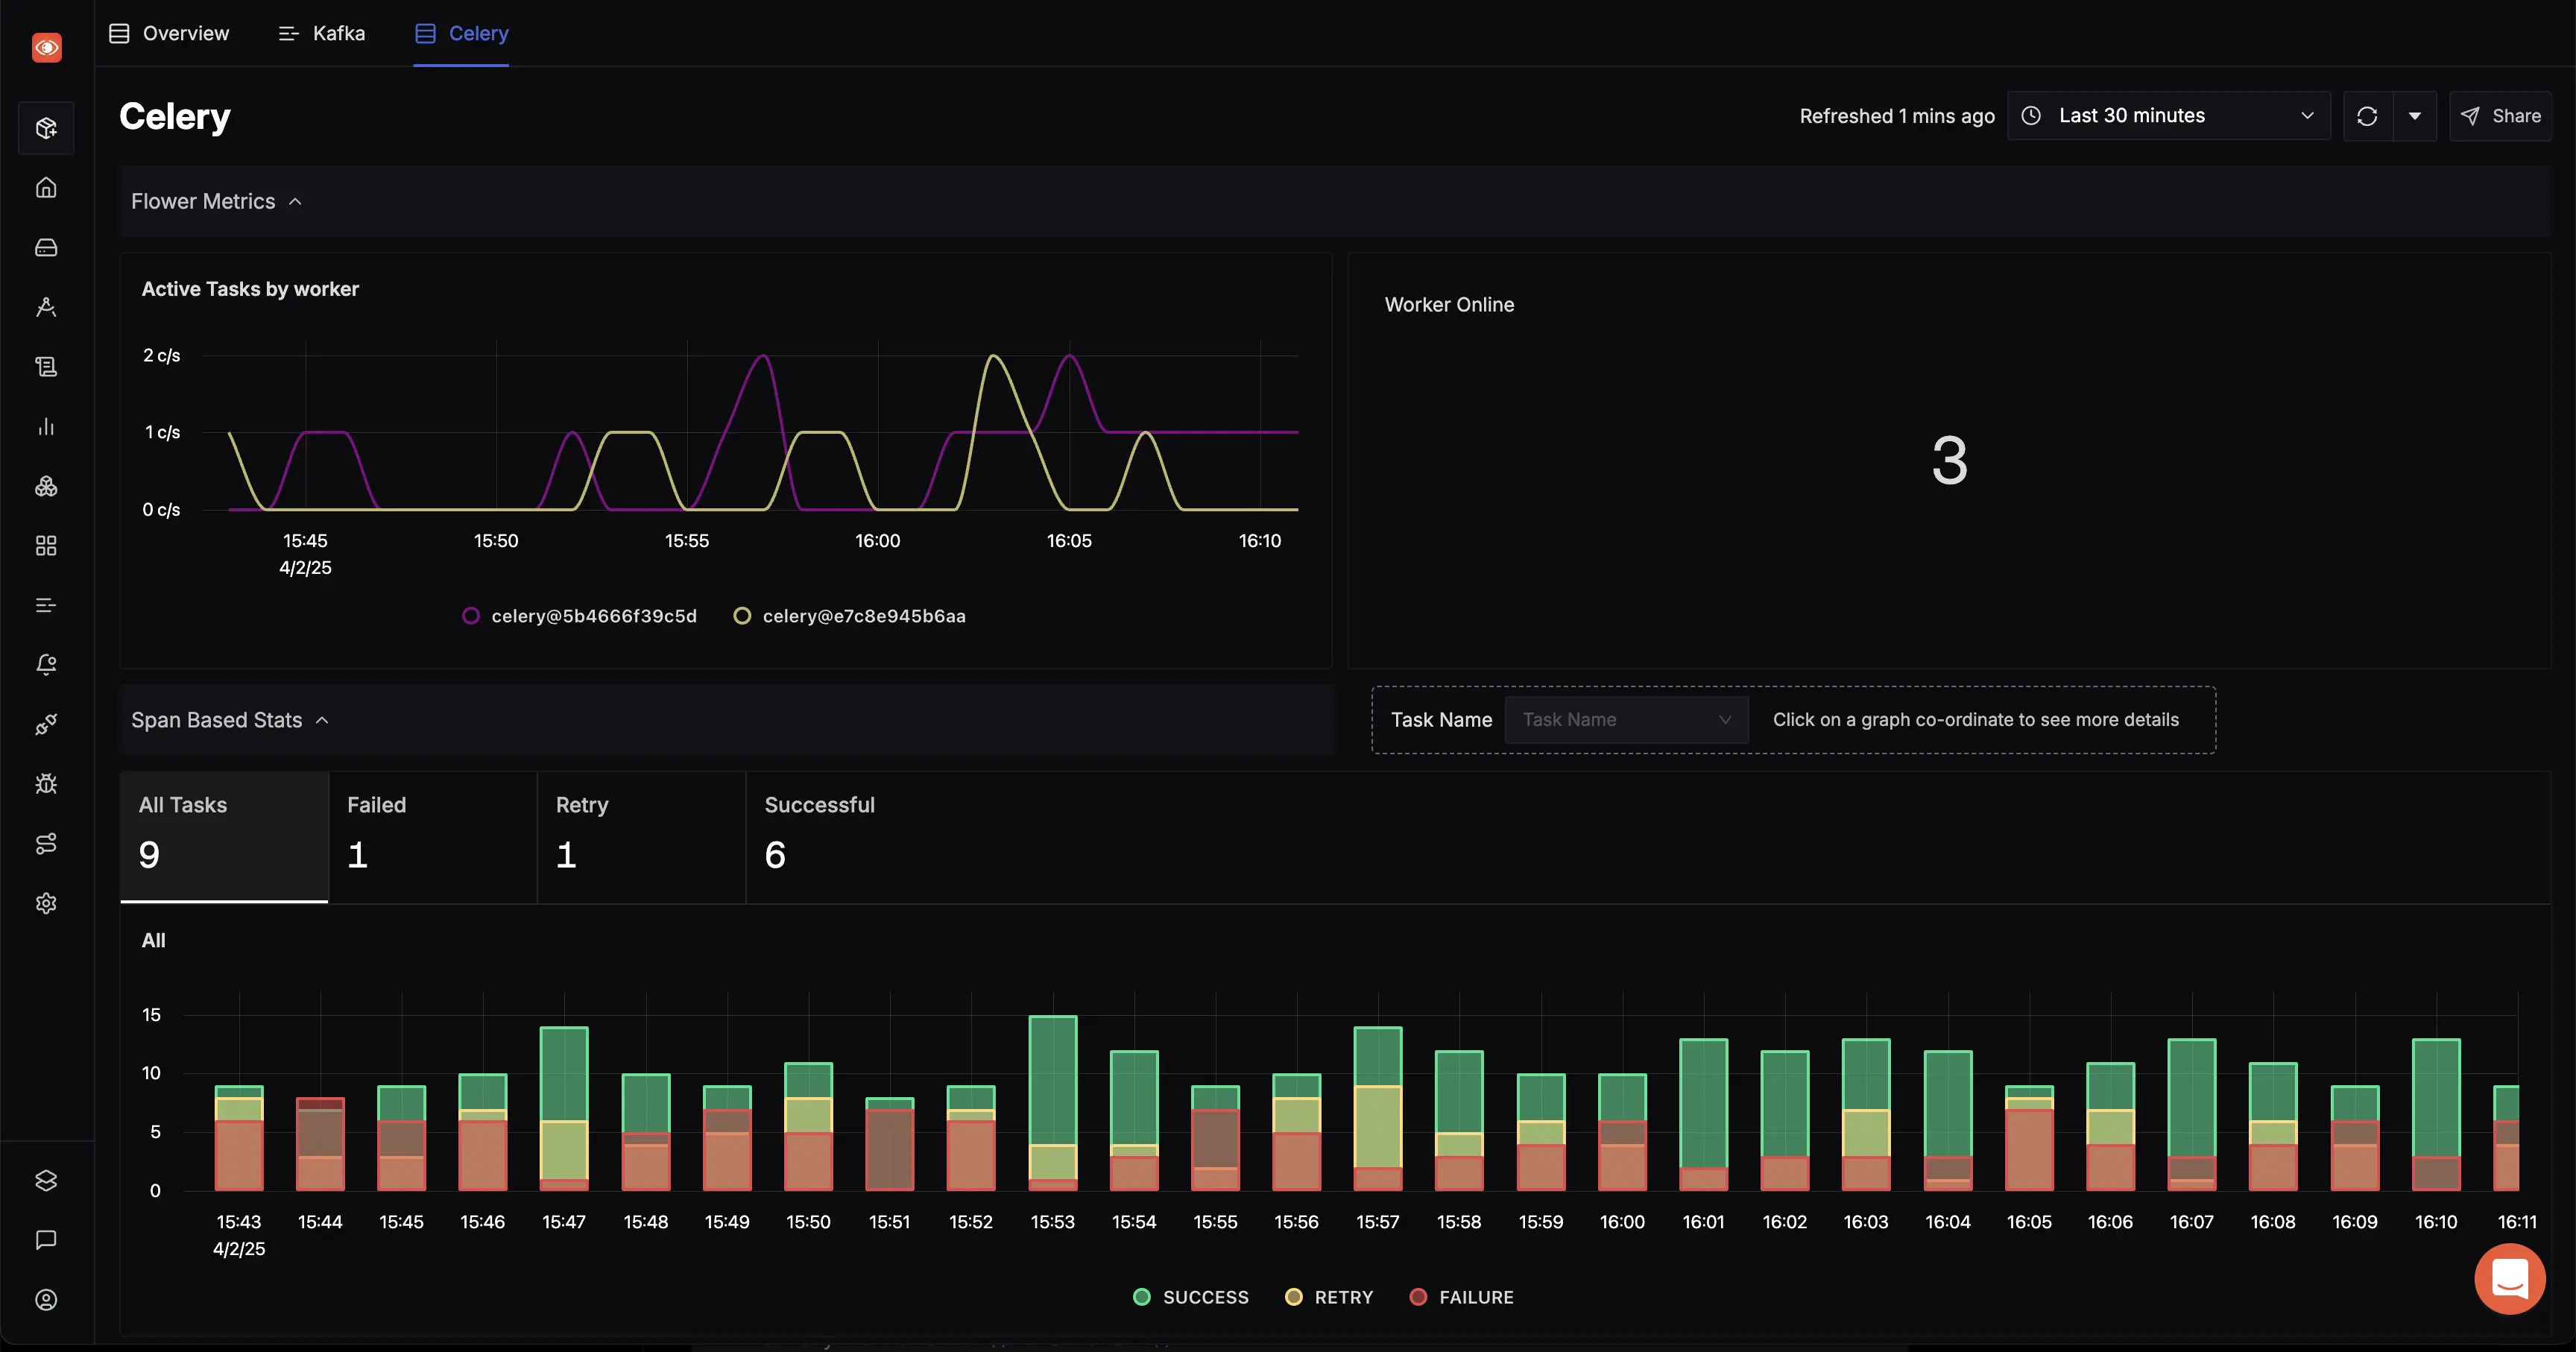
Celery Dashboard
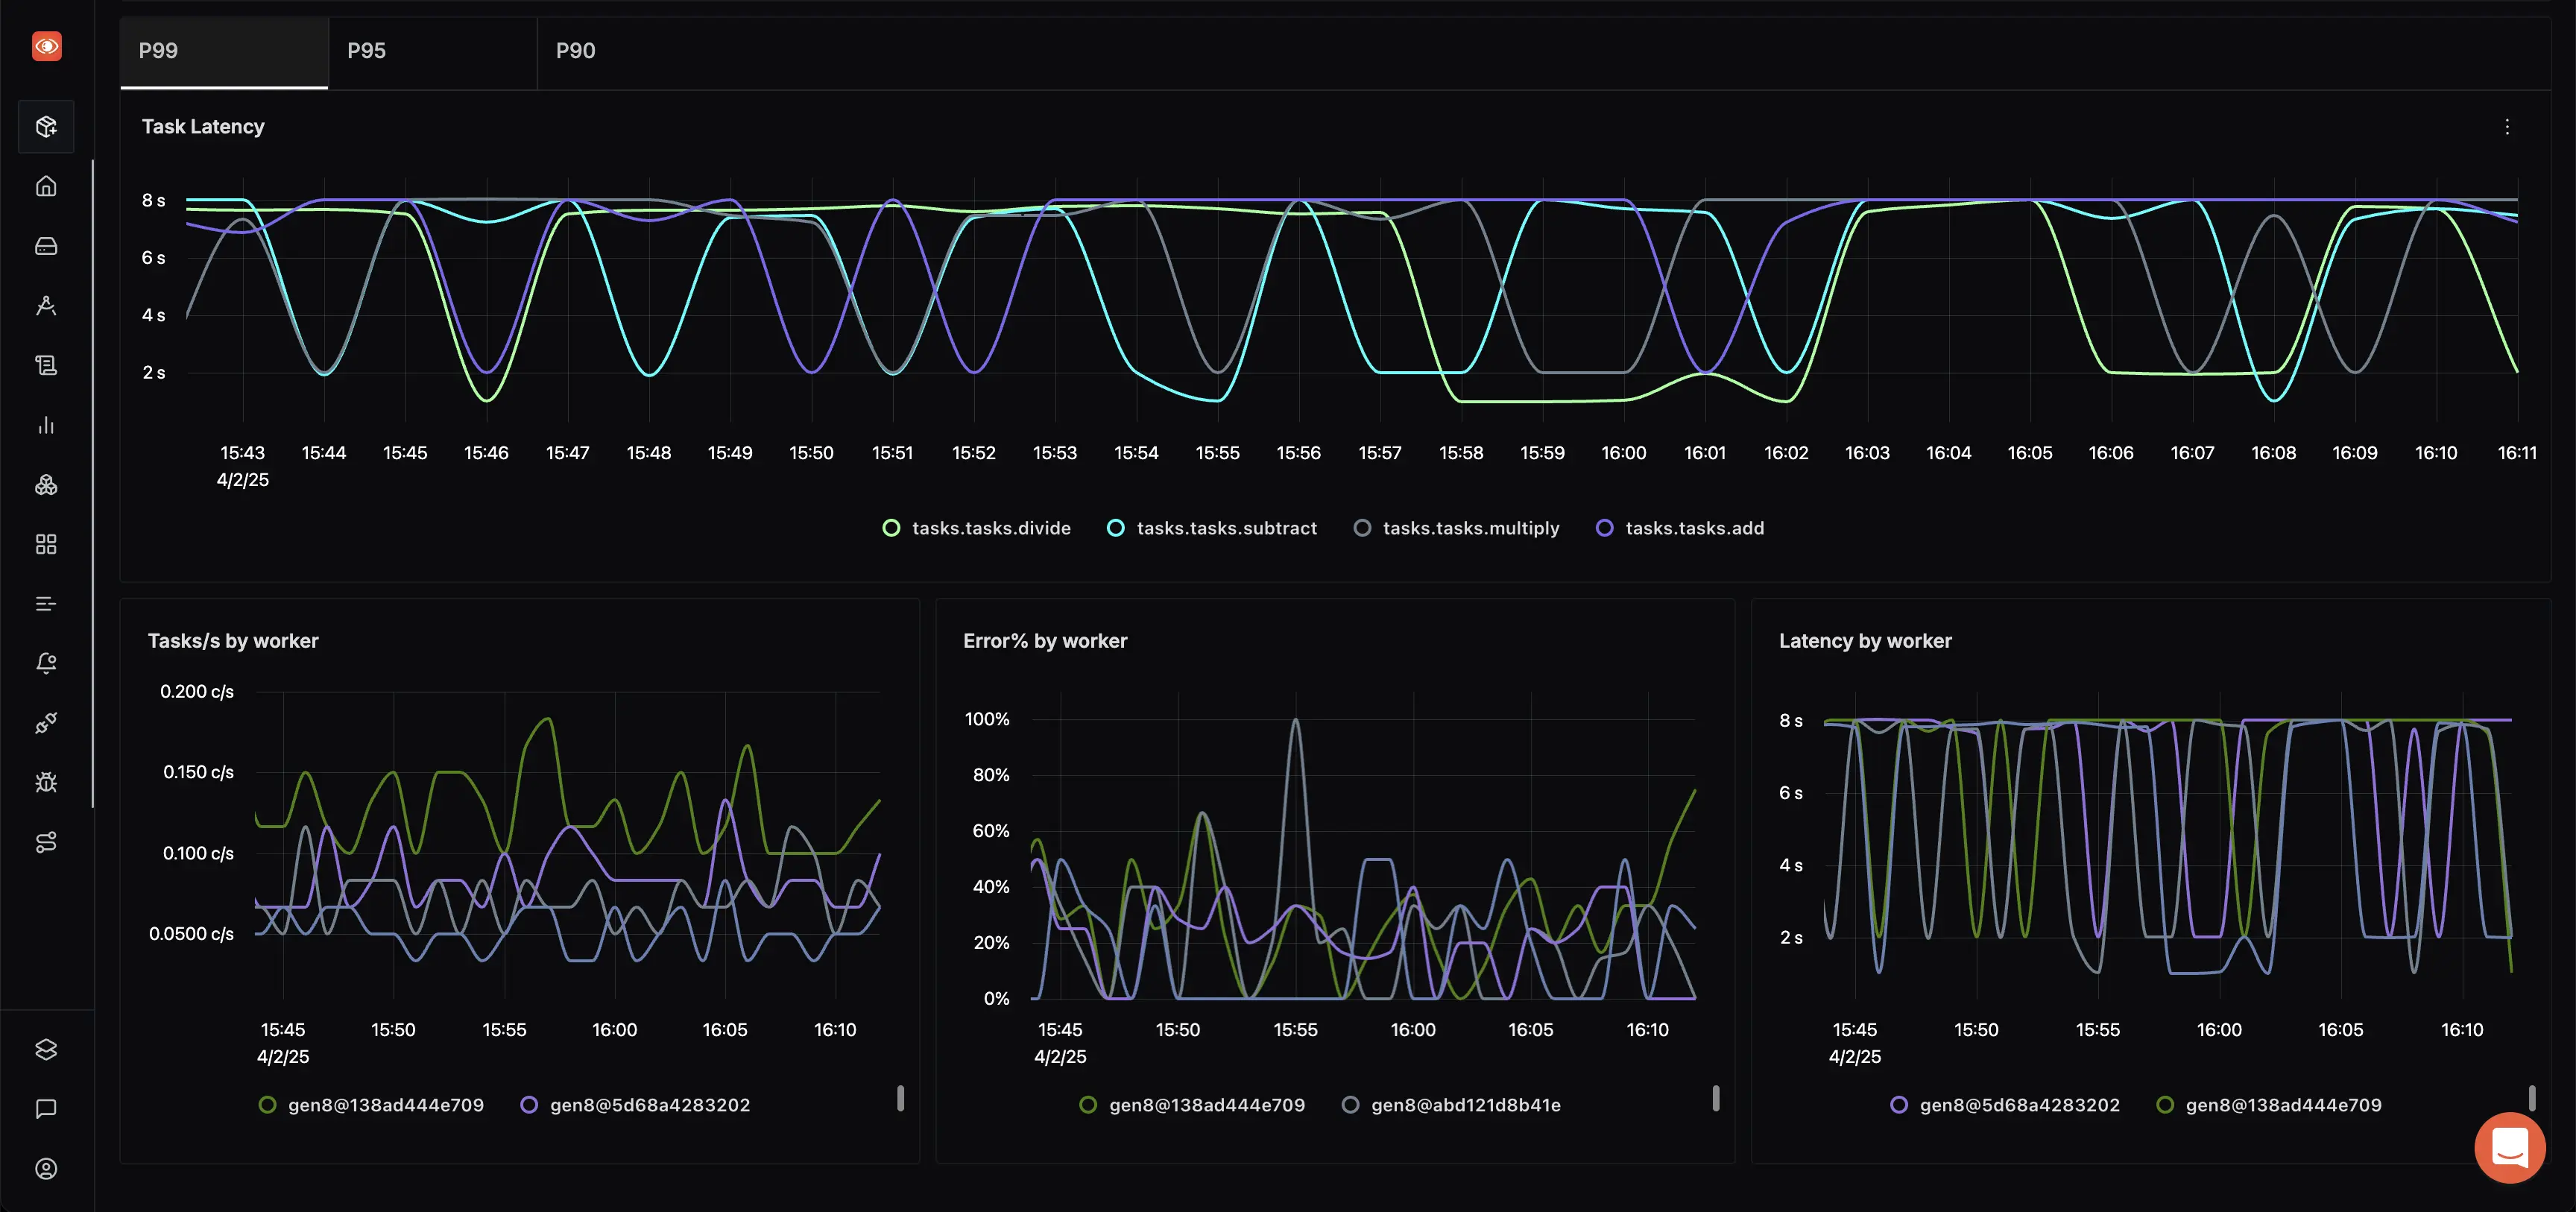
Celery Dashboard (continued)
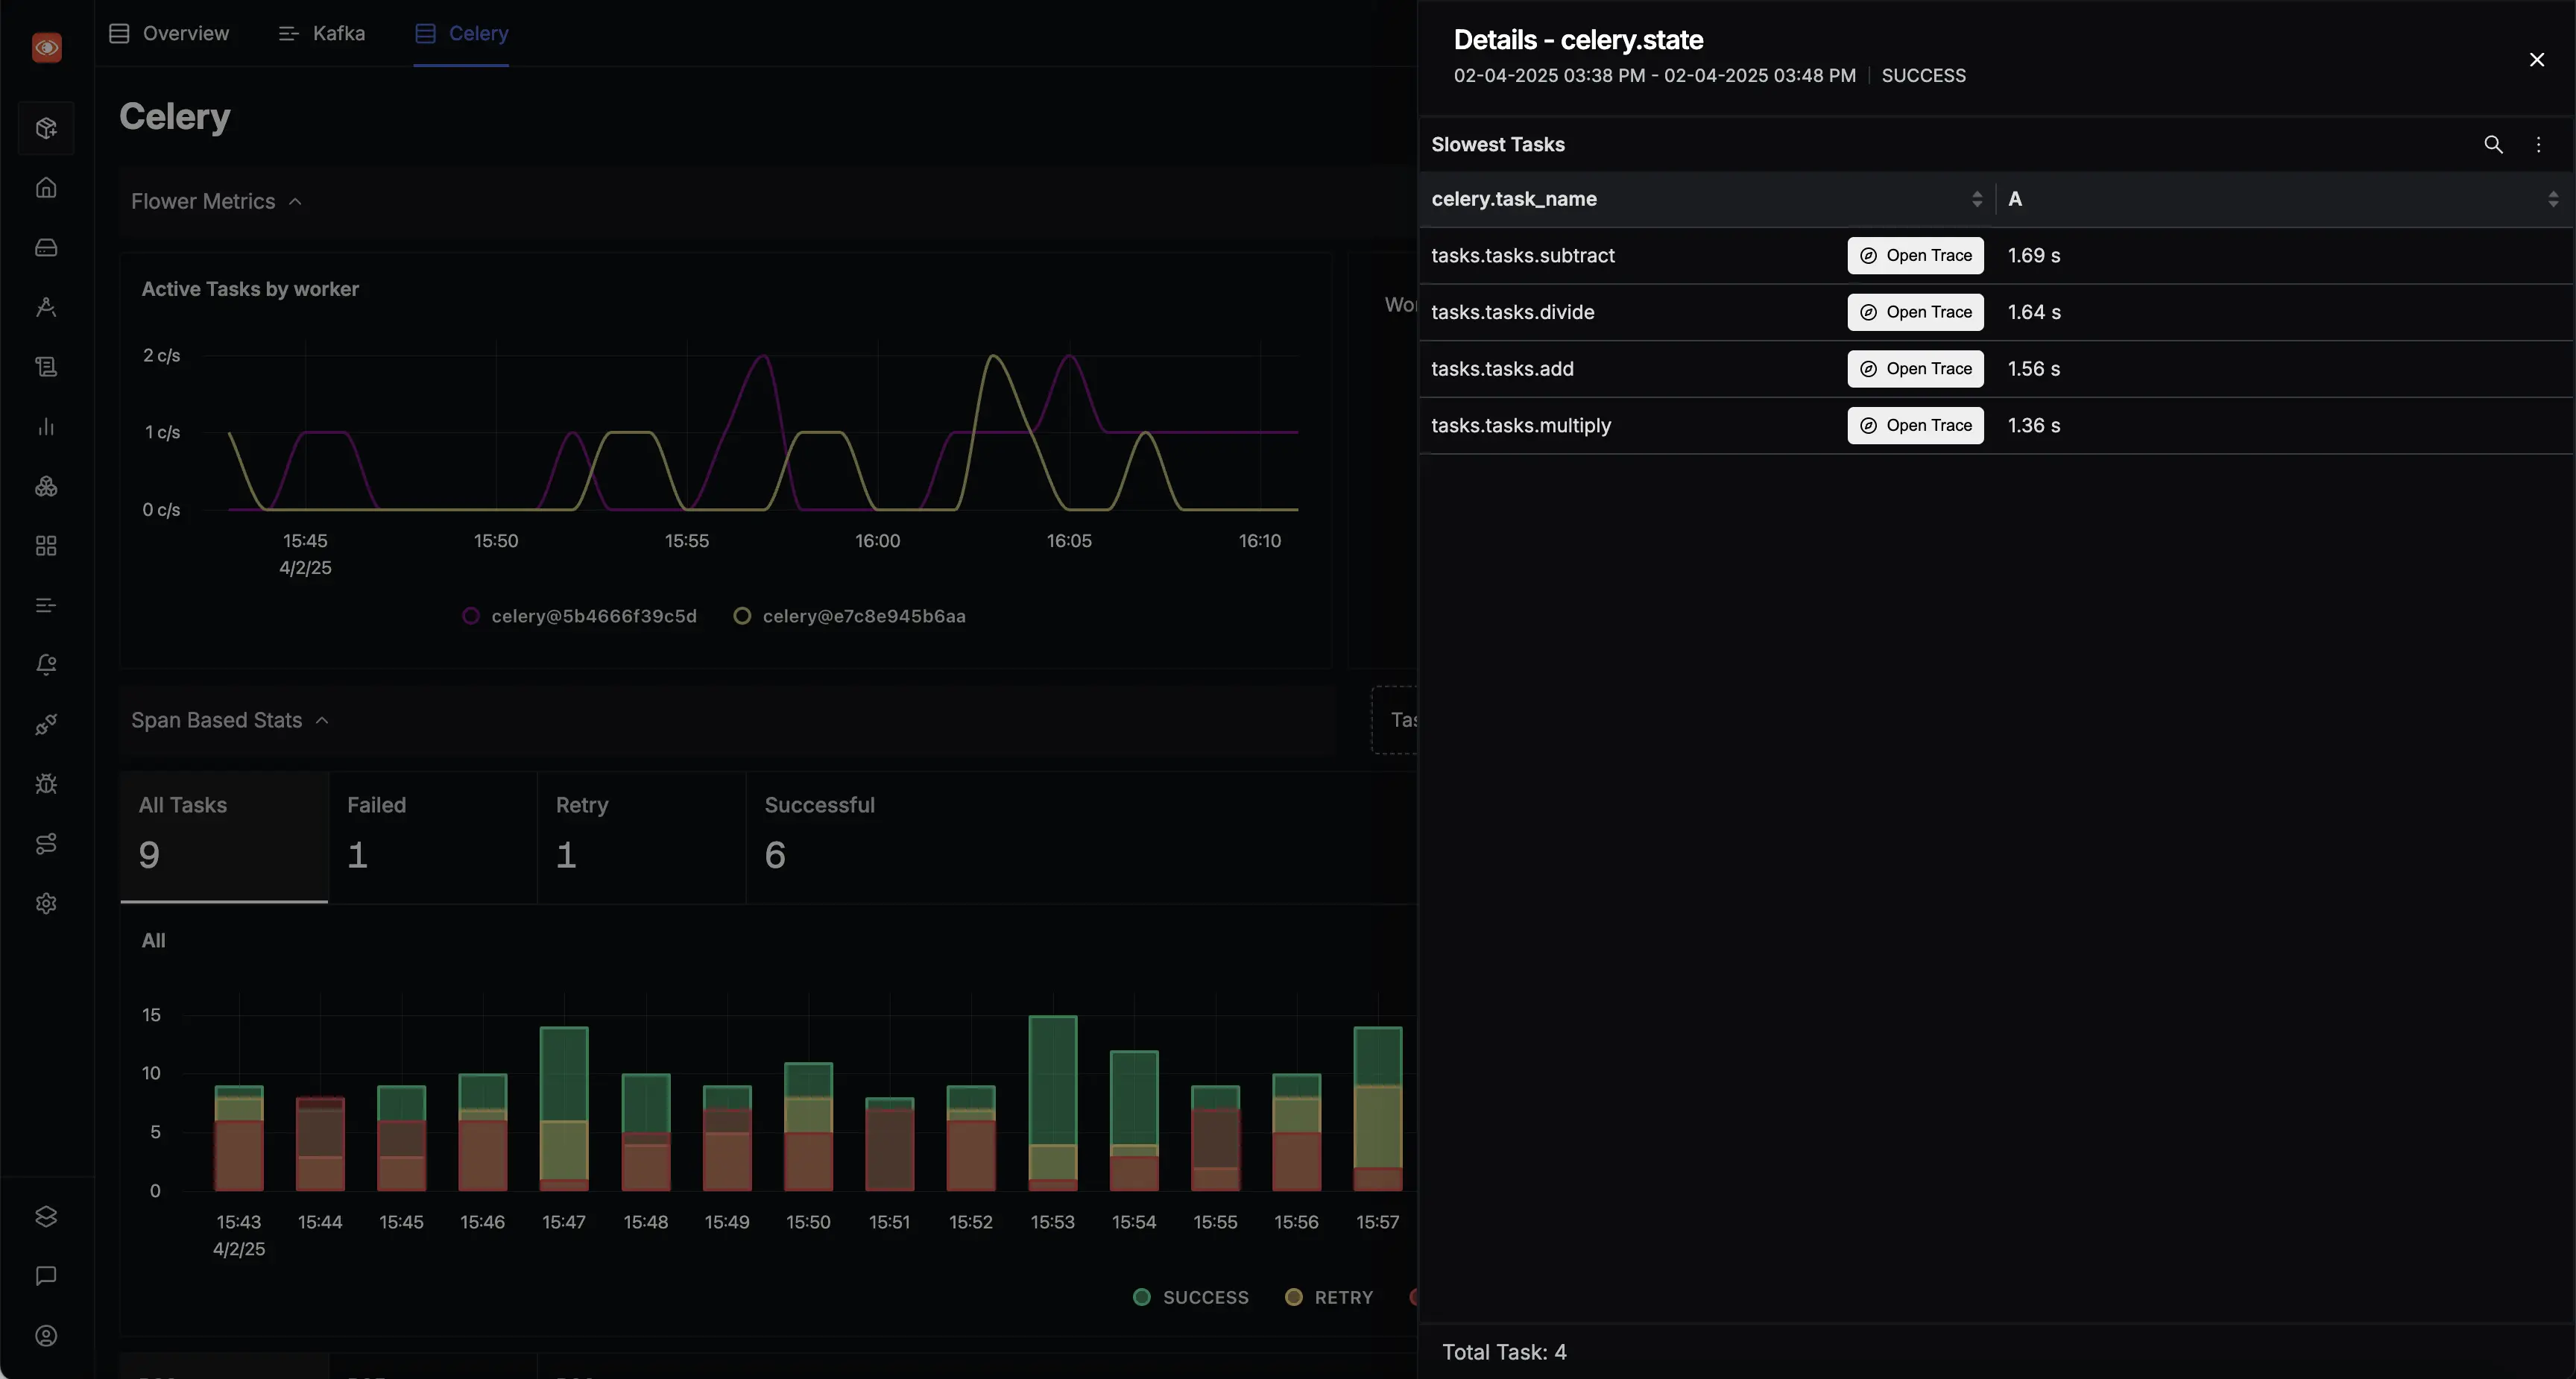
Celery Traces Panel
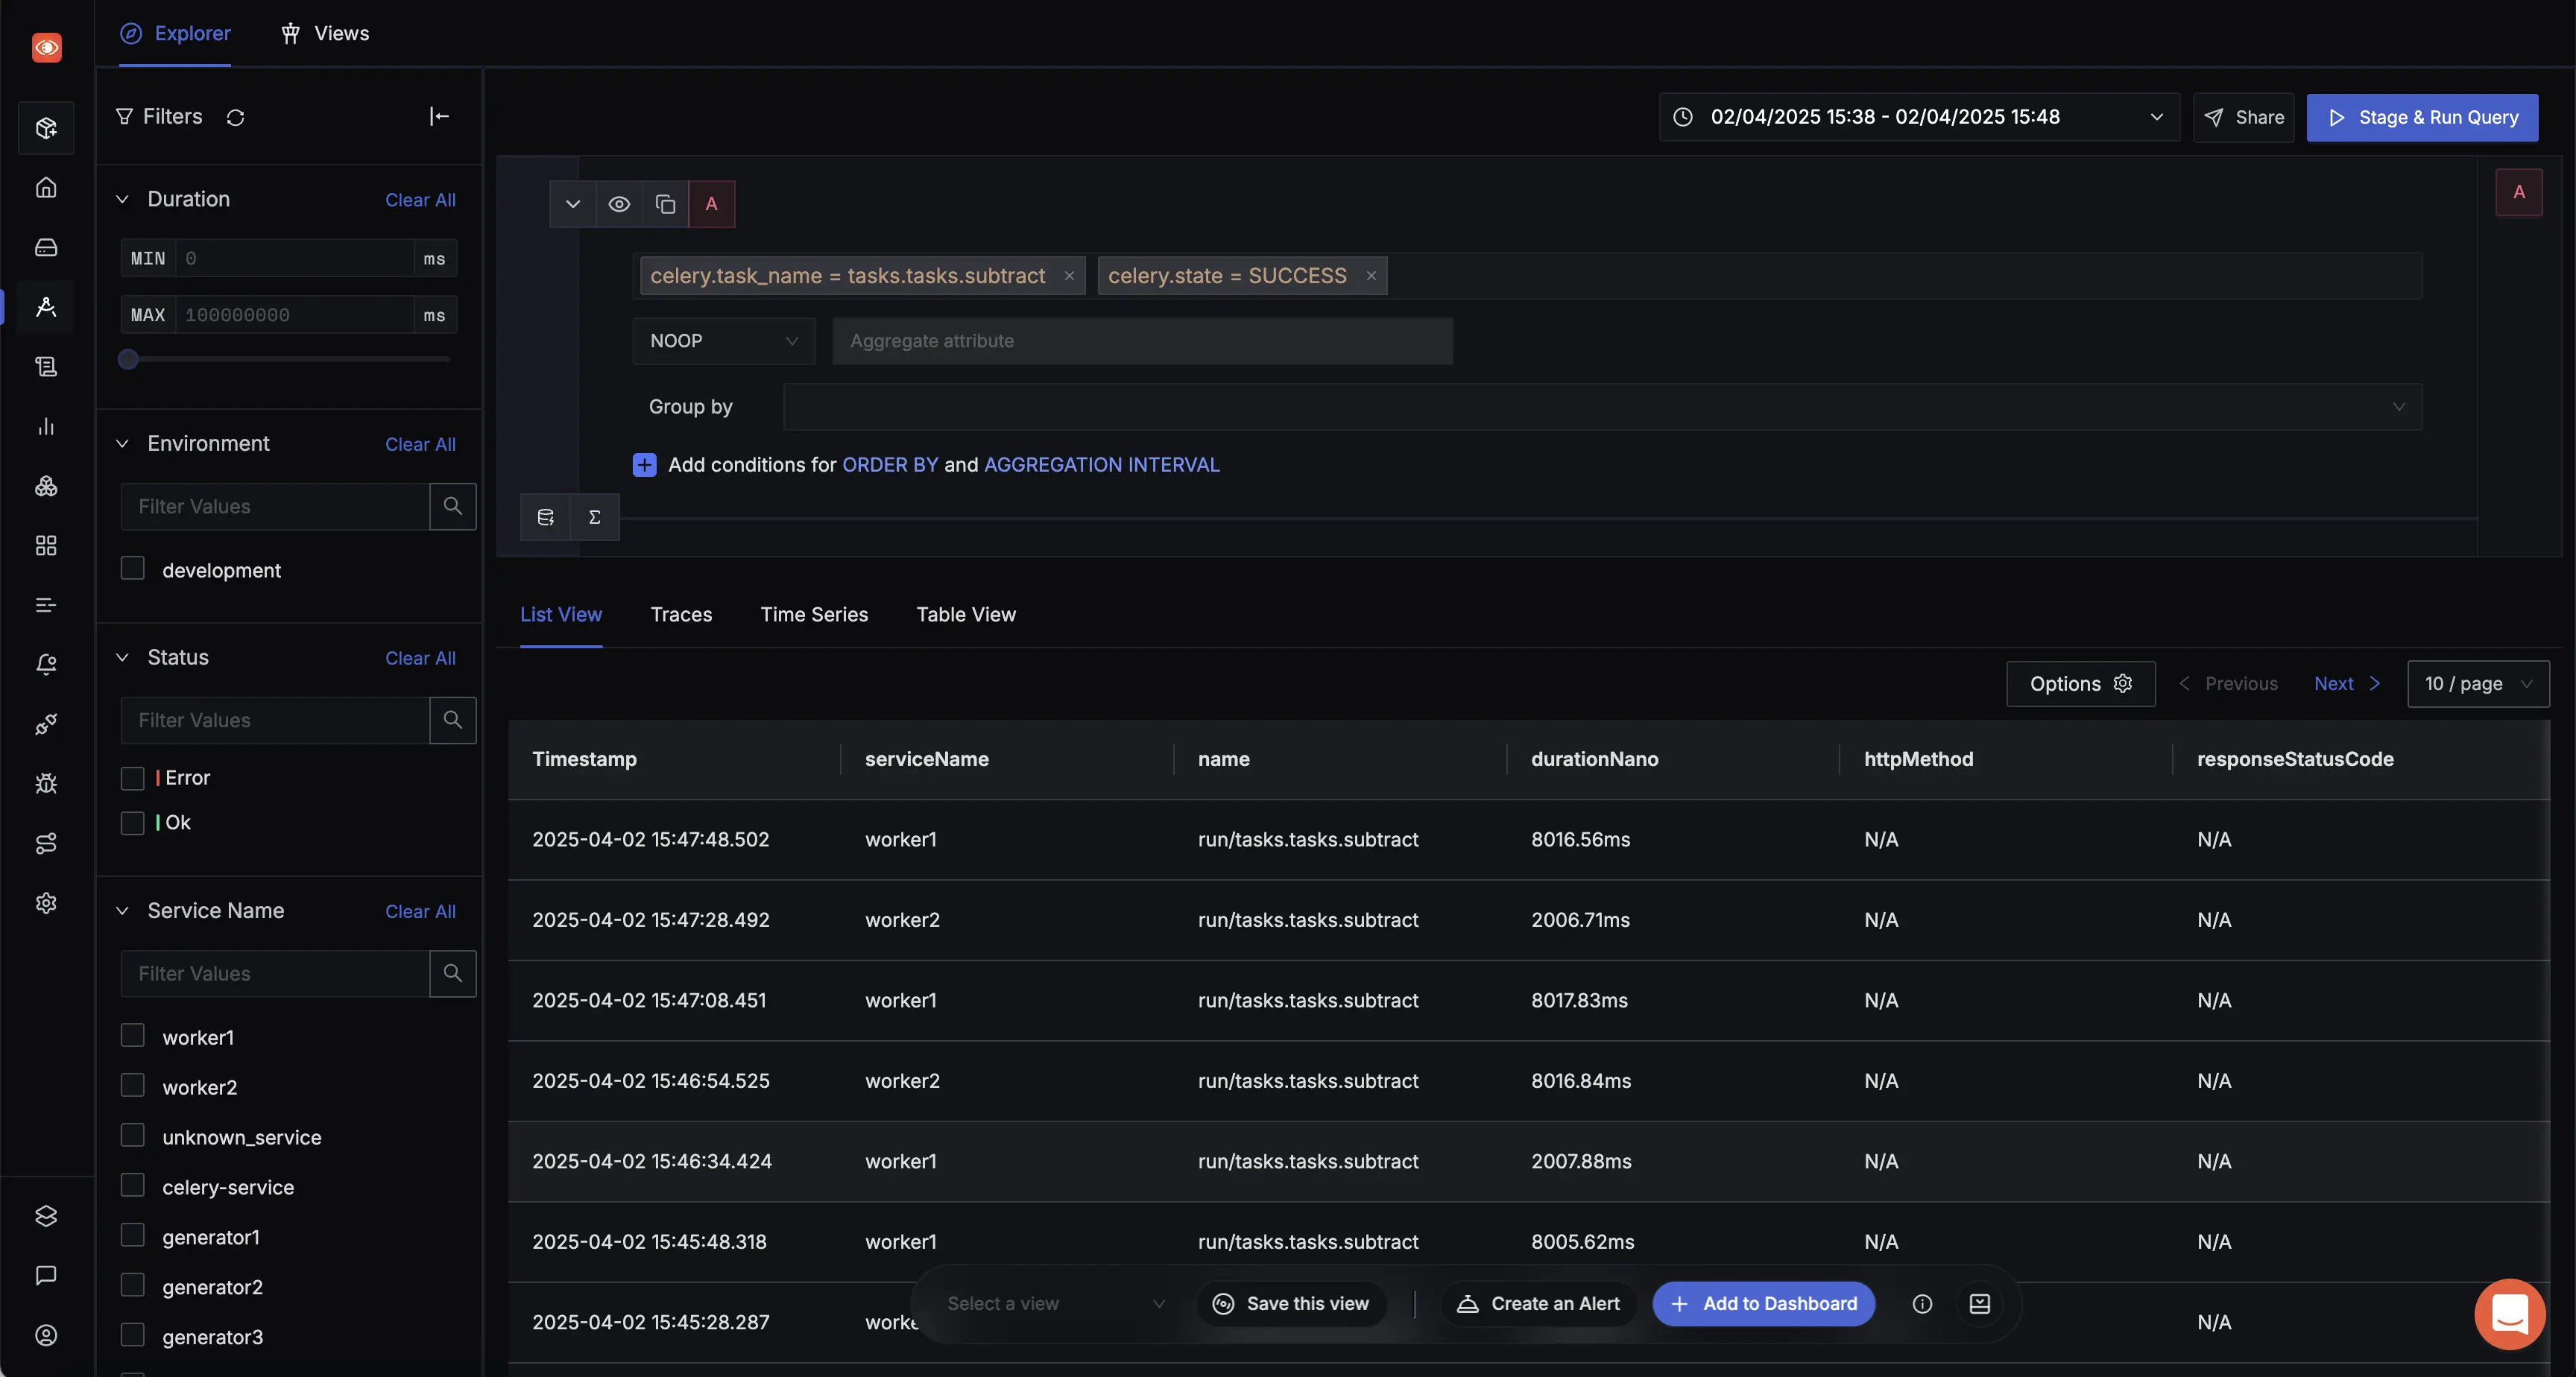
Detailed Celery Traces
Troubleshooting
Worker Online Status Shows 0
If your Celery dashboard shows "Worker Online: 0" even when workers are running, this is likely because task events are disabled by default. The "Worker Online" status relies on the flower_worker_online metric from Flower, which requires the worker_send_task_events setting to be enabled.
To fix this, start your Celery worker with the -E flag to enable task events:
celery -A your_app worker --loglevel=info -E
Alternatively, you can enable task events in your Celery configuration:
# In your Celery configuration
worker_send_task_events = True
Once enabled, the dashboard will properly track and display worker online status.
For more information, refer to the Celery configuration documentation and monitoring guide .
