Table of Contents
Introduction
Kafka is a widely-used distributed messaging system designed to handle large volumes of real-time data. It is commonly employed for building scalable, fault-tolerant data pipelines and stream processing systems. Kafka allows producers to send messages to topics, which are partitioned to support scalability, and consumers to subscribe and process these messages asynchronously.
Key components of Kafka include:
- Producers: Applications that publish messages to Kafka topics.
- Consumers: Applications that subscribe to topics and consume messages.
- Brokers: Kafka servers that manage data flow and ensure message persistence.
- Topics: Categories to which producers send messages and consumers subscribe to.
- Partitions: Divisions within a topic to ensure scalability and parallel processing.
- Consumer Groups: Groups of consumers that allow load distribution across multiple instances.
- ZooKeeper/KRaft: Manages coordination between brokers (in older Kafka versions, ZooKeeper is used; newer versions use KRaft).
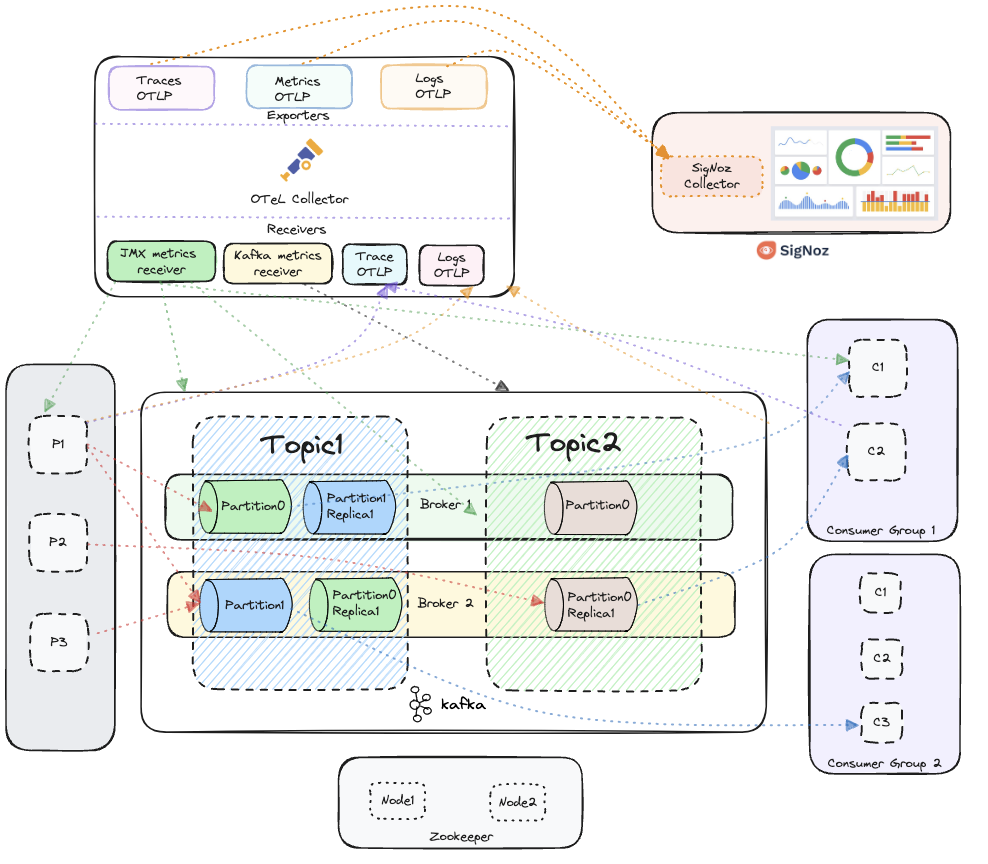
In this documentation, we will guide you through setting up Kafka monitoring with OpenTelemetry and SigNoz. You'll learn how to instrument Kafka's components—producers, consumers, topics, and brokers—so that you can collect key metrics, traces and logs. This will help you gain deep insights into the performance and behavior of your Kafka cluster.

Kafka integrated with OpenTelemetry for collecting metrics, traces and logs, visualized in SigNoz
Prerequisites
Before you begin, ensure the following prerequisites are met:
- Java Development Kit (JDK): Ensure that JDK 8 or higher is installed on your system.
- Apache Kafka: Kafka should be installed and running for your environment.
- Kafka Producer and Consumer Applications: You will need Kafka producer and consumer applications in Java (Support for other languages will be added soon).
- Kafka Client Library: Make sure the Kafka client libraries are included in your project. You can find the official Kafka client libraries from Apache here.
- OpenTelemetry Java Agent: Download the OpenTelemetry Java auto-instrumentation agent JAR. Follow the setup guide from the official OpenTelemetry documentation here or directly download the latest agent JAR from here.
Once these are set up, you will be ready to proceed with Kafka monitoring and instrumentation.
Steps to Follow
This guide follows these primary steps:
- Kafka Setup
- OpenTelemetry Java Agent Installation
- Java Producer-Consumer App Setup
- SigNoz Setup
- OpenTelemetry Collector Setup
Step 1: Kafka Setup
1.1 Kafka Installation
Download the latest Kafka release and extract it.
For example, if the latest release is 2.13-3.7.0 then you can extract it using the follwing command:
# Extract the downloaded Kafka folder
tar -xzf kafka_2.13-3.7.0.tgz
cd kafka_2.13-3.7.0
1.2 Start Kafka
Kafka can be started using ZooKeeper or KRaft. We will use ZooKeeper:
bin/zookeeper-server-start.sh config/zookeeper.properties
1.3 Configure and Start Brokers
Create two server properties files s1.properties and s2.propertiesto start two brokers:
Make sure you are inside the kafka folder that you extracted in the step before.
# make sure you are inside the extracted kafka folder

cp config/server.properties config/s1.properties
cp config/server.properties config/s2.properties
Edit s1.properties:
vi config/s1.properties
Add the following configurations:
broker.id=1
listeners=PLAINTEXT://localhost:9092
log.dirs=/tmp/kafka_logs-1
zookeeper.connect=localhost:2181
Edit s2.properties:
vi config/s2.properties
Add the following configurations:
broker.id=2
listeners=PLAINTEXT://localhost:9093
log.dirs=/tmp/kafka_logs-2
zookeeper.connect=localhost:2181
Start Broker 1 with JMX port enabled:
JMX_PORT=2020 bin/kafka-server-start.sh config/s1.properties
Start Broker 2 in a new terminal with JMX port enabled:
JMX_PORT=2021 bin/kafka-server-start.sh config/s2.properties
1.4 Create Kafka Topics
Create two Kafka topics:
bin/kafka-topics.sh --create --topic topic1 --bootstrap-server localhost:9092 --replication-factor 2 --partitions 2
bin/kafka-topics.sh --create --topic topic2 --bootstrap-server localhost:9092 --replication-factor 2 --partitions 1
1.5 Verify Kafka Setup
List the Kafka topics and their partitions:
bin/kafka-topics.sh --describe --topic topic1 --bootstrap-server localhost:9092
bin/kafka-topics.sh --describe --topic topic2 --bootstrap-server localhost:9092
1.6 Test Kafka Setup
Produce Messages:
bin/kafka-console-producer.sh --topic topic1 --bootstrap-server localhost:9092
Type some messages and press Enter to send.
Consume Messages:
Open a new terminal and run:
bin/kafka-console-consumer.sh --topic topic1 --from-beginning --bootstrap-server localhost:9092
You should see the messages you produced.
Step 2: OpenTelemetry Java Agent Installation
2.1 Java Agent Setup
Install the latest OpneTelemetry Java Agent:
wget https://github.com/open-telemetry/opentelemetry-java-instrumentation/releases/latest/download/opentelemetry-javaagent.jar
2.2 (Optional) Configure OpenTelemetry Java Agent
Refer to the OpenTelemetry Java Agent configurations for advanced setup options.
Step 3: Java Producer-Consumer App Setup
3.1 Running the Producer and Consumer Apps with OpenTelemetry Java Agent
Ensure you have Java and Maven installed.
Compile your Java producer and consumer applications: Ensure your producer and consumer apps are compiled and ready to run.
Run Producer App with Java Agent:
java -javaagent:/path/to/opentelemetry-javaagent.jar \
     -Dotel.service.name=producer-svc \
     -Dotel.traces.exporter=otlp \
     -Dotel.metrics.exporter=otlp \
     -Dotel.logs.exporter=otlp \
     -jar /path/to/your/producer.jar
Run Consumer App with Java Agent:
java -javaagent:/path/to/opentelemetry-javaagent.jar \
     -Dotel.service.name=consumer-svc \
     -Dotel.traces.exporter=otlp \
     -Dotel.metrics.exporter=otlp \
     -Dotel.logs.exporter=otlp \
     -Dotel.instrumentation.kafka.producer-propagation.enabled=true \
     -Dotel.instrumentation.kafka.experimental-span-attributes=true \
     -Dotel.instrumentation.kafka.metric-reporter.enabled=true \
     -jar /path/to/your/consumer.jar
Step 4: OpenTelemetry Collector Setup
Set up the OpenTelemetry Collector to collect JMX metrics from Kafka and spans from producer and consumer clients, then forward them to SigNoz.
4.1 Download the JMX Metrics Collector
Download the JMX metrics collector necessary for Kafka metrics collection.
You can download the latest .jar file for the opentelemetry jmx metrics using this release link.
4.2 Install the OpenTelemetry Collector
Install the local OpenTelemetry Collector Contrib.
Using the Binary:
Download the OpenTelemetry Collector Contrib binary. You can follow this doc to download the binary for your Operating System.
Place the binary in the root of your project directory.
Update config file
Update you collector config with the follwing:
receivers:
  # Read more about kafka metrics receiver - https://github.com/open-telemetry/opentelemetry-collector-contrib/blob/main/receiver/kafkametricsreceiver/README.md
  kafkametrics:
    brokers:
      - localhost:9092
      - localhost:9093
      - localhost:9094
    protocol_version: 2.0.0
    scrapers:
      - brokers
      - topics
      - consumers
  # Read more about jmx receiver - https://github.com/open-telemetry/opentelemetry-collector-contrib/blob/main/receiver/jmxreceiver/README.md
  jmx/1:
    # configure the path where you installed opentelemetry-jmx-metrics jar
    jar_path: path/to/opentelemetry-jmx-metrics.jar #change this to the path to you opentelemetry-jmx-metrics jar file you downloaded above
    endpoint: service:jmx:rmi:///jndi/rmi://localhost:9991/jmxrmi
    target_system: jvm,kafka,kafka-consumer,kafka-producer
    collection_interval: 10s
    log_level: info
    resource_attributes:
      broker.name: broker1
  jmx/2:
    jar_path: ${PWD}/opentelemetry-jmx-metrics.jar
    endpoint: service:jmx:rmi:///jndi/rmi://localhost:9992/jmxrmi
    target_system: jvm,kafka,kafka-consumer,kafka-producer
    collection_interval: 10s
    log_level: info
    resource_attributes:
      broker.name: broker2
exporters:
  otlp:
    endpoint: "ingest.{region}.signoz.cloud:443"
    tls:
      insecure: false
    headers:
      "signoz-ingestion-key": "<your-ingestion-key>"
  debug:
    verbosity: detailed

service:
  pipelines:
    metrics:
      receivers: [kafkametrics, jmx/1, jmx/2]
      exporters: [otlp]
receivers:
  # Read more about kafka metrics receiver - https://github.com/open-telemetry/opentelemetry-collector-contrib/blob/main/receiver/kafkametricsreceiver/README.md
  kafkametrics:
    brokers:
      - localhost:9092
      - localhost:9093
      - localhost:9094
    protocol_version: 2.0.0
    scrapers:
      - brokers
      - topics
      - consumers
  # Read more about jmx receiver - https://github.com/open-telemetry/opentelemetry-collector-contrib/blob/main/receiver/jmxreceiver/README.md
  jmx/1:
    # configure the path where you installed opentelemetry-jmx-metrics jar
    jar_path: path/to/opentelemetry-jmx-metrics.jar #change this to the path to you opentelemetry-jmx-metrics jar file you downloaded above
    endpoint: service:jmx:rmi:///jndi/rmi://localhost:9991/jmxrmi
    target_system: jvm,kafka,kafka-consumer,kafka-producer
    collection_interval: 10s
    log_level: info
    resource_attributes:
      broker.name: broker1
  jmx/2:
    jar_path: ${PWD}/opentelemetry-jmx-metrics.jar
    endpoint: service:jmx:rmi:///jndi/rmi://localhost:9992/jmxrmi
    target_system: jvm,kafka,kafka-consumer,kafka-producer
    collection_interval: 10s
    log_level: info
    resource_attributes:
      broker.name: broker2
exporters:
   otlp:
     endpoint: "<IP of machine hosting SigNoz>:4317"
     tls:
       insecure: true
  debug:
    verbosity: detailed

service:
  pipelines:
    metrics:
      receivers: [kafkametrics, jmx/1, jmx/2]
      exporters: [otlp]
The config file sets up the OpenTelemetry Collector to gather Kafka and JVM metrics from multiple brokers(2 brokers in the above config) via Kafka metrics scraping and JMX, and exports the telemetry data to SigNoz using the OTLP exporter.
Run the collector
Run the collector with the above configuration :
./otelcol-contrib --config path/to/config.yaml
Step 5: Visualize data in SigNoz
To see your Producer and Consumer app traces:
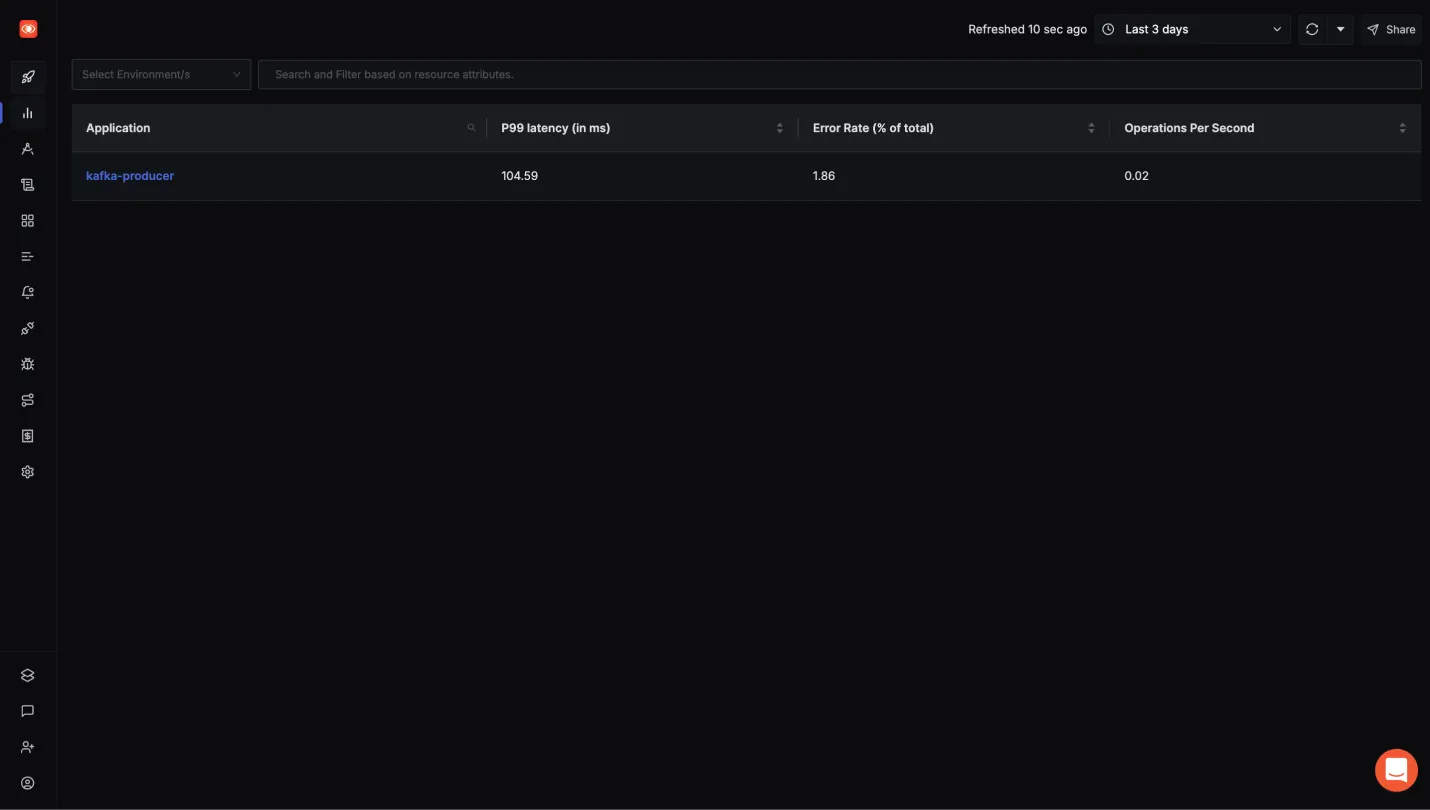
- Head over to Services tab in your SigNoz instance.
- You should be able to see your apps in the list along with some application metrics.
- Click on the service of your choice to see more detailed application metrics and related traces.

Kafka Producer app in Services tab of SigNoz
To see the Kafka Metrics:
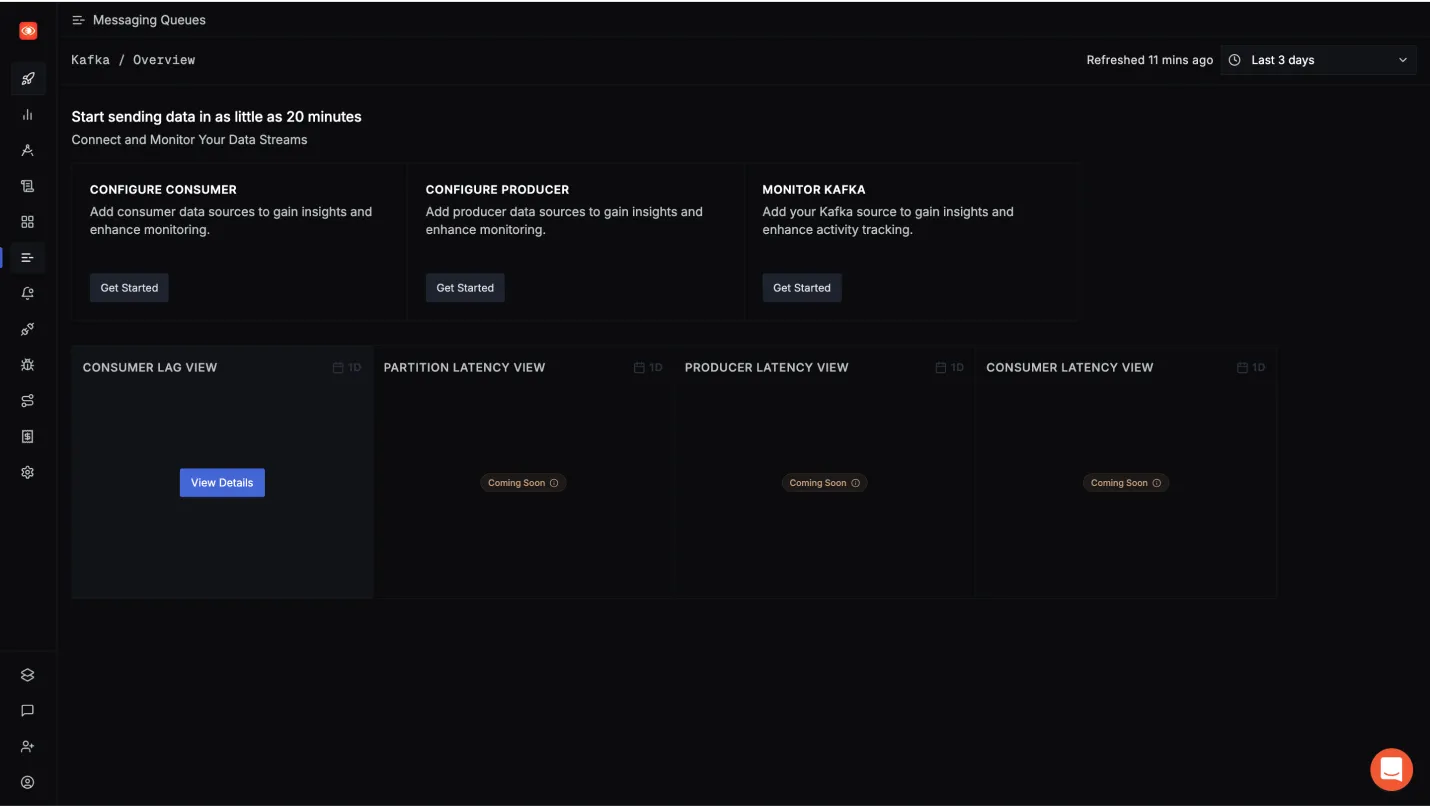
- Head over to Messaging Queues tab in your SigNoz instance.
- You will get different Options like Consumer Lag View etc., to see various kafka related metrics.

Messaging Queues tab in SigNoz
