Introduction
The Kafka monitoring feature in SigNoz helps you track key metrics like consumer lag, producer latency, and partition throughput to detect bottlenecks early. By automatically discovering producers and consumers instrumented with OpenTelemetry, SigNoz provides a unified view of your event streaming pipelines. From high-level metrics down to detailed trace data. Once your services are properly instrumented, you can access Kafka queues, metrics and traces in one place, enabling you to pinpoint issues faster, optimize configurations, and maintain high-performing Kafka clusters without extra setup.
Kafka Tab at a Glance
After navigating to the Messaging Queues section, select Kafka to access the Kafka overview dashboard.
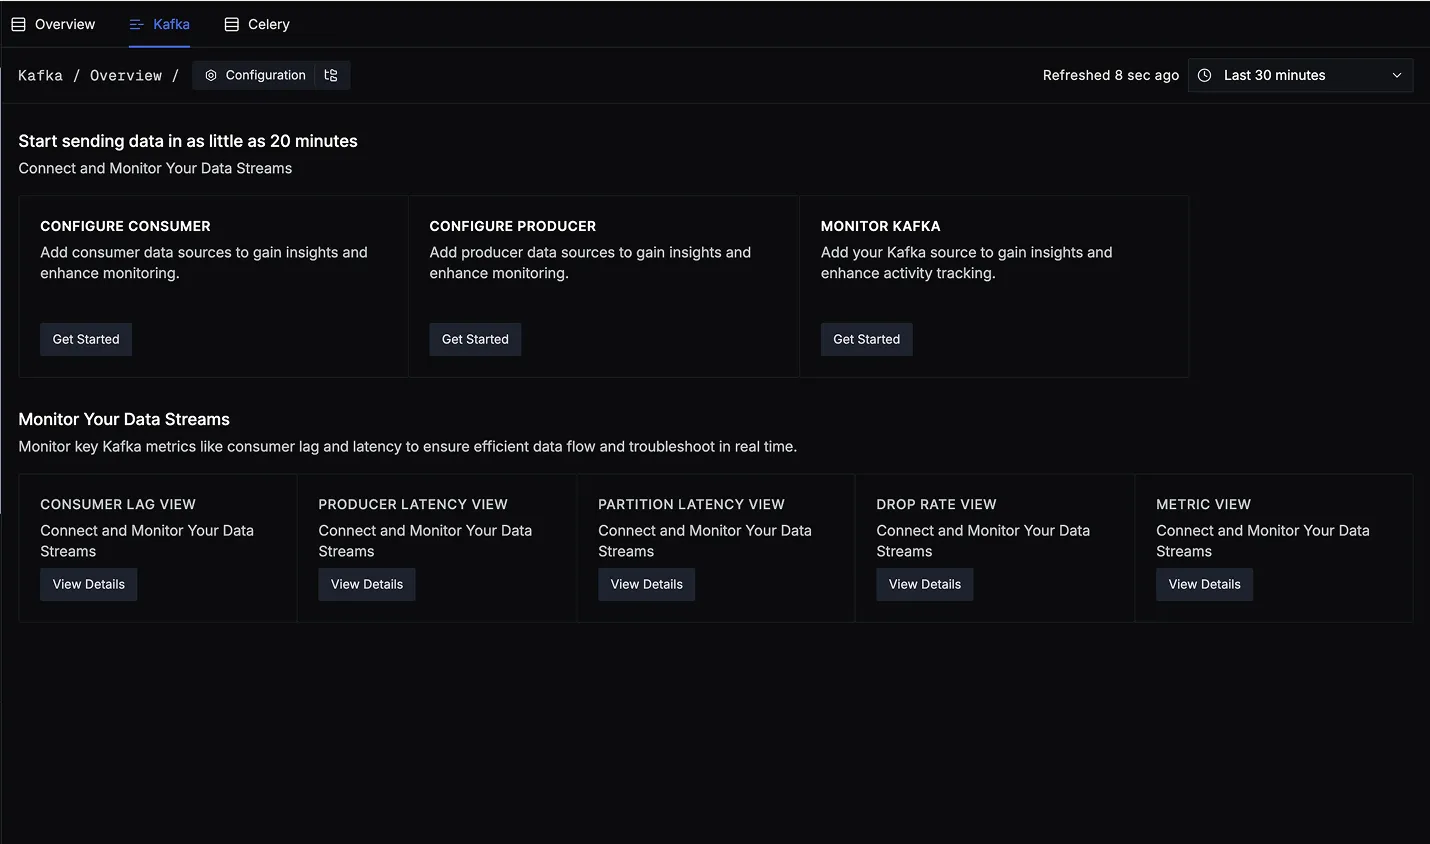
This dashboard is divided into two key sections:
Start Sending Data
Get started with instrumentation and tracking:
- Configure Consumer – Add consumer data sources to gain insights and enable monitoring.
- Configure Producer – Add producer data sources for full visibility into publish-side performance.
- Monitor Kafka – Add your Kafka source to enable activity tracking and system-level metrics.
Each card has a Get Started button to guide you through setup.
Monitor Your Data Streams
Track essential Kafka metrics using the following dedicated views. Each helps you monitor and troubleshoot specific aspects of your data streams:
- Consumer Lag View – Visualize how many messages are yet to be processed by each consumer group across topics and partitions. Useful for identifying slow consumers or uneven partition assignment.
- Producer Latency View – Analyze how long producers take to send messages to Kafka, helping detect delays caused by network issues, broker overload, or inefficient batching.
- Partition Latency View – Inspect latencies per topic-partition combination to uncover imbalances or hotspots where certain partitions experience higher delays than others.
- Drop Rate View – Detect and investigate messages that exceeded predefined latency thresholds. Helps pinpoint time-sensitive messages that were processed too slowly or dropped.
- Metric View – Access a comprehensive snapshot of Kafka performance, including metrics from brokers, producers, and consumers, for an overall health check of the system.
Consumer Lag View
One of the first bottlenecks you’ll want to watch is consumer lag—how far behind your consumers are in reading messages from a given topic and partition.

This view goes beyond native Kafka metrics by correlating trace data and partition-level metrics to show which producer and consumer instances are contributing to lag. You can also view P99 latency, error rate, throughput, average message size, and network latency per partition.
How This Helps You
- Diagnose Root Causes of Lag: Identify whether consumer lag is due to high producer throughput or slower consumer processing at the partition level.
- Analyze Performance: Gain detailed insights into producer and consumer instances through metrics like p99 latency, error rates, throughput, average message size, and network latency.
- Optimize Producer Configurations: Fine-tune settings such as batching, compression, and acknowledgment modes to reduce latency and improve throughput.
- Scale Consumers Strategically: Use real-time lag patterns to inform resource allocation, balancing load more effectively across consumer groups.
- Enhanced Troubleshooting: Correlate trace data with metrics to pinpoint network latency or processing delays for quicker resolution.
Detailed Lag Insights Tabs
The Consumer Lag View is segmented into three insight-rich tabs:
- Producer Details: Highlights which producer services are writing to the selected topic and partition, with P99 latency, error percentage, and throughput.
- Consumer Groups Details: Surfaces the consumer service metrics—such as P99, error rate, throughput, and average message size—for each partition.
- Network Latency: Displays latency and throughput experienced by specific consumer instances (with Client ID and Instance ID) while processing data. Unlike basic latency metrics, SigNoz correlates spans and metrics at the topic and partition level. This correlation helps you pinpoint whether increased lag is due to higher throughput from certain producers or slower processing by particular consumers.
Features
- Lag Over Time: See any spikes in lag for each consumer group and partition.
- Filtering: Use filters for consumer group, topic, or partition to narrow down where lag is occurring.
- Correlate Services: Click a point on the lag chart to reveal exactly which producer and consumer services contribute to that spike.
This correlation helps you pinpoint whether increased lag is due to higher throughput from certain producers or slower processing by particular consumers.
Partition Latency View
In Kafka, partitions are fundamental units storing messages within queues, organized under topics—logical groupings categorizing these messages. The Partition Latency View helps you drill down into all topic-partition combinations, clearly visualizing message flow and identifying services interacting with each partition.

How This Helps You
- Visualize Message Flow: Clearly understand message distribution through topics and partitions, enabling quick identification of bottlenecks and message routing issues.
- Identify Service Interactions: Effortlessly determine which producer services are writing to partitions and which consumer services are consuming, aiding large-scale deployment troubleshooting.
- Resolve Partition-Specific Issues: Rapidly diagnose delays, errors, or lags by accessing detailed partition-level metrics.
- Balance Load Distribution: Spot and correct uneven load distribution, preventing certain partitions from becoming overloaded or underutilized.
- Optimize Producer & Consumer Configurations: Fine-tune producer and consumer applications with accurate insights into service-partition interactions, enhancing reliability and performance.
Detailed Partition Insights Tabs
The Partition Latency View includes two detailed tabs:
- Producer Details: Clearly identifies producer services responsible for each partition, showing key metrics like P99 latency, error percentage, and throughput.
- Consumer Groups Details: Highlights consumer groups interacting with each partition along with essential metrics such as P99 latency, error rate, and throughput, providing clear insights into consumer performance.
Features
- Topic & Partition-Level Metrics: Easily monitor latency and throughput metrics across Kafka topics and partitions.
- Producer & Consumer Service Mapping: Quickly visualize and map producer and consumer interactions at the partition level.
- Throughput & Latency Monitoring: Track message ingestion rates and latencies to inform scaling and rebalancing decisions.
Producer Latency View
When deploying Kafka at scale, it can be challenging to clearly map producer services to the specific partitions they write to. The Producer Latency View provides clarity by visualizing producer services associated with each topic, along with ingestion rate (throughput) and byte rate. You can further drill down into detailed partition-level metrics for each producer service, enabling targeted optimization of your producers at scale.

How This Helps You
- Map Producer Services Clearly: Quickly identify producer services writing to specific partitions, simplifying the troubleshooting process for large Kafka deployments.
- Monitor Ingestion and Byte Rates: Gain visibility into producer-specific ingestion (message throughput) and byte rates, facilitating effective monitoring and management of data flows.
- Detailed Partition-Level Insights: Access granular information on partitions per producer, enabling rapid troubleshooting and fine-tuning of producer configurations.
- Understand System Behavior at Scale: Visualize interactions between producer services and partitions, helping you comprehend overall system behavior and dynamics in complex environments.
- Optimize Producer and Consumer Applications: Leverage detailed insights to accurately adjust producer settings (such as batching, compression, acknowledgment modes), improving performance and resource utilization.
Detailed Producer Insights Tabs
The Producer Latency View contains two informative tabs:
- Producers: Displays a list of producer services by topic, along with key metrics such as P99 latency, error rates, throughput (message ingestion rate), and byte rate, helping you quickly identify producers impacting performance.
- Consumers: Offers visibility into consumer-side metrics, showing consumer interactions and performance metrics such as P99 latency, error rate, ingestion rate, and byte rate for effective end-to-end monitoring.
Additionally, selecting a service reveals:
- Producer Details: Partition-level metrics, including P99 latency, error rate, and throughput, helping identify precisely which partitions may be causing performance bottlenecks.
- Consumer Groups Details: Partition-level metrics for consumer groups, enabling in-depth analysis of consumer performance at the partition level.
Features
- Service-Level Breakdown: Clearly shows performance metrics (P99 latency, error rate, throughput) for each producer and consumer service.
- Partition-Level Analysis: Enables deep-dive analysis into individual partitions, providing clarity on exactly where performance tuning is required.
- Comprehensive Metrics: Combines ingestion rate and byte rate data, crucial for understanding producer and consumer performance at scale.
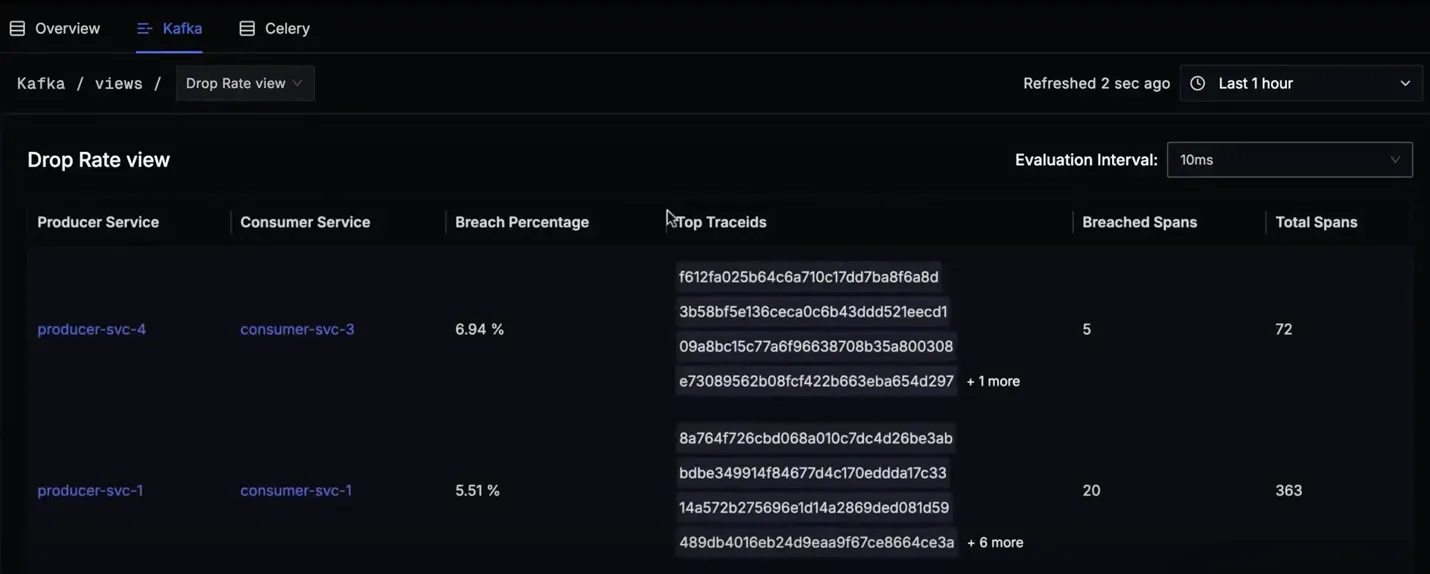
Drop Rate View
The Drop Rate View lets you set evaluation intervals to quickly identify messages that exceed specified latency thresholds. For example, if you set a threshold of 150ms, SigNoz highlights producer-consumer pairs experiencing delays beyond this limit, along with relevant trace IDs for in-depth debugging.
In asynchronous systems, messages might be consumed by multiple services at varying speeds. A single message from a producer could be consumed by several consumer services, each processing it at different latencies (e.g., 10ms, 50ms, 180ms). This view provides clear visibility into such interactions and delays, helping maintain smooth end-to-end data flow.
How This Helps You
- Detect Delayed Message Consumption: Quickly spot consumer services exceeding your configured latency thresholds to resolve potential latency issues before they escalate.
- Identify Missing or Unprocessed Messages: Reveal consumer services not processing messages at all, indicating configuration or system-level issues.
- Analyze Performance Bottlenecks: Compare consumption latencies across consumer services to pinpoint and optimize performance bottlenecks effectively.
- Enhanced Debugging with Trace IDs: Utilize corresponding trace IDs for each producer-consumer interaction to accurately trace delays or errors within asynchronous systems.
- Maintain Data Flow Integrity: Ensure consistent and reliable data flow between producers and consumers, enhancing overall system stability and performance.
Detailed Insights
- Evaluation Interval: Define specific latency thresholds (e.g., 10ms, 50ms, 150ms) to monitor message processing times.
- Breach Percentage: View the percentage of messages that exceed your specified threshold, enabling quick identification of problematic producer-consumer pairs.
- Trace IDs: Directly access individual trace IDs, facilitating pinpoint diagnosis of message delays or processing failures.
Features
- Configurable Thresholds: Set custom latency thresholds (e.g., 50ms, 150ms) to easily monitor delayed message consumption.
Metric View
The Metric View aggregates all critical metrics from Kafka brokers, producers, and consumers into an integrated dashboard. This unified view helps you comprehensively monitor your Kafka ecosystem, covering metrics such as throughput, latency, consumer lag, broker health, and JVM performance, all in real-time.

How This Helps You
- Unified Monitoring: Get an all-in-one view of Kafka broker, producer, and consumer metrics to quickly evaluate overall Kafka health and performance.
- Identify Performance Bottlenecks: Track throughput and latency metrics to quickly pinpoint bottlenecks within your Kafka deployment.
- Real-Time Broker Health Checks: Monitor broker-specific indicators such as request times, timeouts, broker count, and leader election metrics to maintain cluster stability and performance.
- Optimize Resource Usage: Leverage insights from JVM metrics such as garbage collection (GC) counts, elapsed times, CPU utilization, and memory usage to optimize resource allocation and performance.
- Partition-Level Visibility: Keep track of partition metrics including current and oldest offsets, partition counts, and in-sync replicas to ensure smooth message processing and data integrity.
Detailed Insights Sections
The Metric View dashboard is segmented into several detailed sections:
- Broker Metrics: Provides visibility into broker count, request times, network throughput, timeouts, and leader elections, ensuring broker availability and stability.
- Producer Metrics: Offers insights into producer throughput, request and response rates, and I/O wait times, helping detect delays and inefficiencies in message delivery.
- Consumer Metrics: Displays key metrics such as consumer offsets, success rates, throughput, and active consumer group members, enabling efficient tracking of consumer performance and message consumption rates.
- Broker JVM Metrics: Tracks JVM-specific health indicators like GC counts, GC durations, CPU utilization, and heap memory usage to identify performance issues related to Kafka brokers' underlying JVM environment.
- Partition Metrics: Provides detailed information about partition counts per topic, current and oldest offsets, and in-sync replicas (ISR), enabling efficient monitoring of partition health and load distribution.
Features
- Comprehensive Real-Time Dashboard: Access real-time monitoring of all Kafka-related metrics in a single view.
- Detailed JVM Performance Tracking: Gain deep visibility into broker JVM metrics, crucial for performance tuning and troubleshooting.
- Granular Partition Monitoring: Keep close track of partition-level metrics for precise optimization and efficient resource allocation.
- Performance Indicators: Easily track critical performance indicators such as throughput, latency, consumer lag, and broker health.
Next Steps
Follow the setup section of our docs for your Kafka Cluster to start seeing your own Kafka data in SigNoz.
