The Messaging Queues feature in SigNoz provides visibility into distributed systems built on Kafka or Celery. While other tools focus solely on native broker or queue metrics, SigNoz goes further by correlating those metrics with traces in real time, a capability enabled by OpenTelemetry semantic conventions.
Why It Matters
In modern architectures, services rely on asynchronous communication:
- Producers publish messages or events (e.g., user actions, data streams).
- Consumers (or Celery workers, in the case of Celery) process these messages in the background.
However, purely metric-based monitoring doesn’t reveal which service wrote which message, or why a particular consumer is lagging. Traditional approaches lack the link between what’s happening in the queue and the application’s actual business logic.
With SigNoz, you get both:
- Native messaging metrics (e.g., lag, throughput, task states).
- Correlated application traces (e.g., which producer service emitted messages, which consumer processed them).
This fused telemetry eliminates blind spots:
- Tracing context is preserved from producer to consumer.
- Metrics are enriched with actual usage data and error context.
- Scaling decisions become easier because you see real throughput spikes tied to specific services.
As a result, you gain a single, coherent view of message flow from publishing to processing so you can quickly detect and troubleshoot bottlenecks, errors, or delays in your distributed system.
Messaging Queues Overview Page
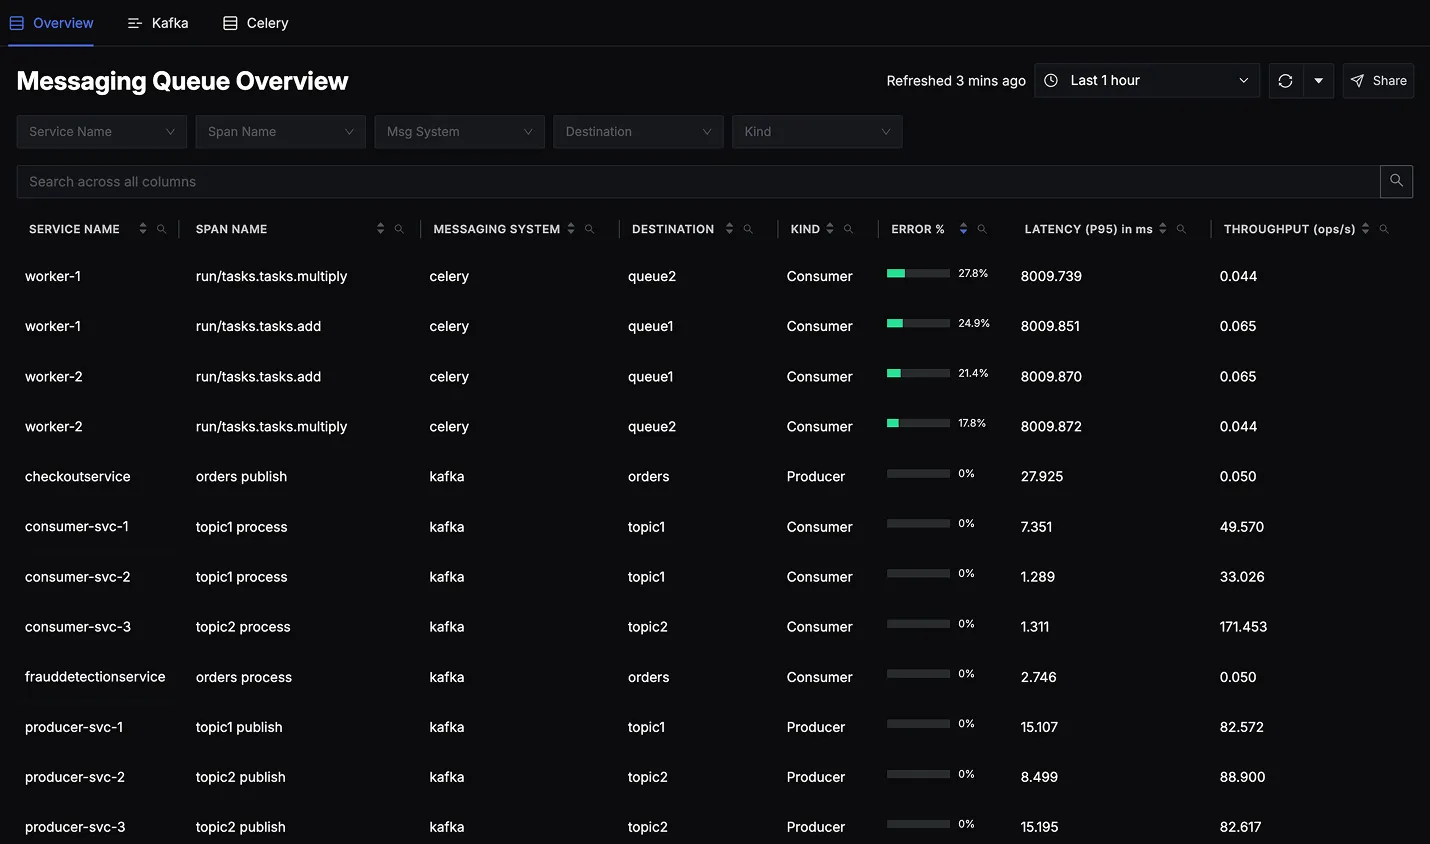
The Messaging Queues Overview page in SigNoz provides a single dashboard where you can see all of your instrumented queues such as Kafka topics/partitions and Celery task queues alongside key metrics and traces. By simply instrumenting your producer and consumer applications with OpenTelemetry, SigNoz will automatically surface these queues in the UI with out-of-the-box insights.
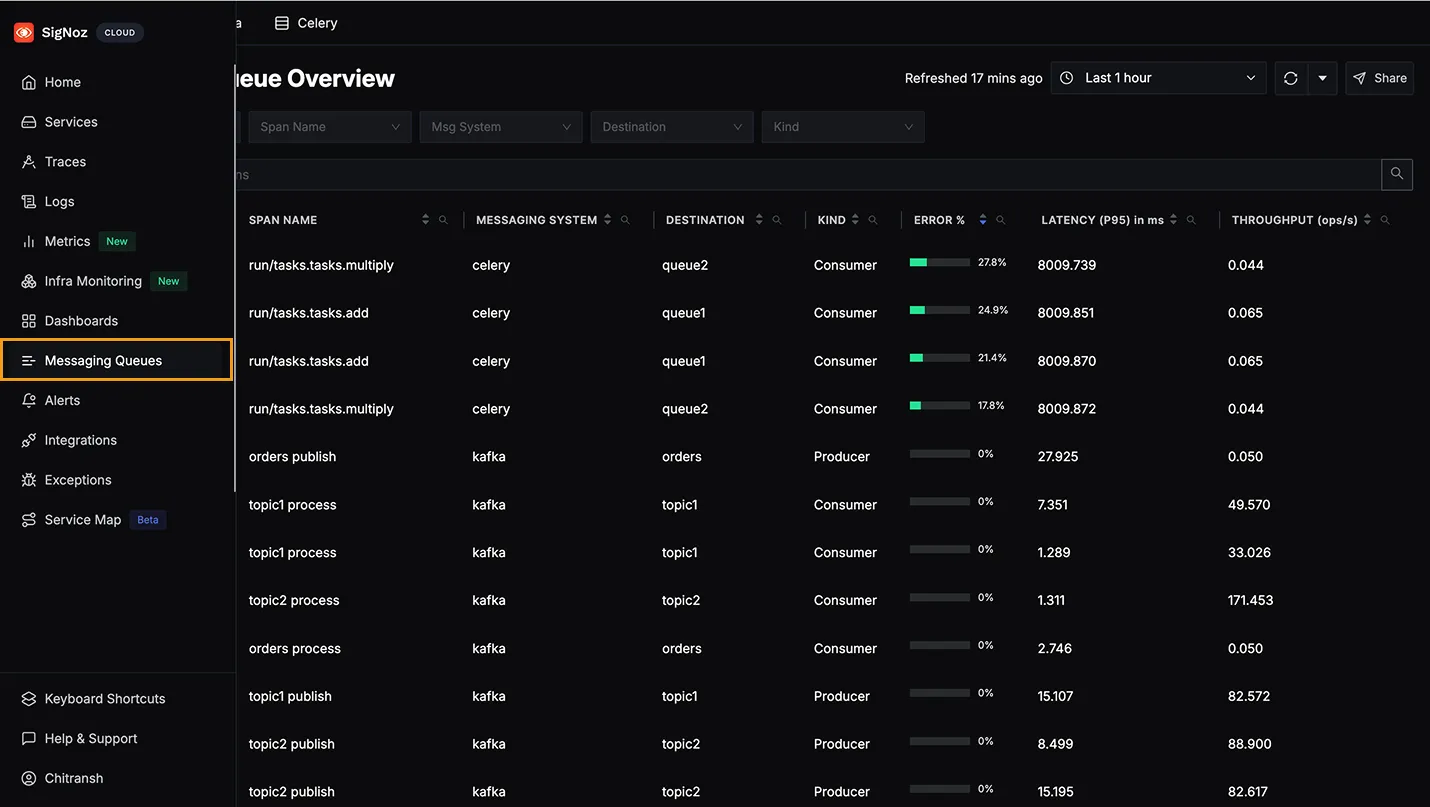
Accessing the Overview
- Navigate to your SigNoz interface
- Click on Messaging Queues in the left sidebar
You’ll see an Overview Tab listing all detected messaging queues (e.g., Kafka, Celery). Each column displays important metrics at a glance:
- Service Name: Identifies the specific application service (e.g.,
consumer-svc-1,producer-svc-1etc.) that is producing or consuming messages. - Span Name: Displays the name of the trace span associated with this message-related activity.
- Messaging System: Shows whether the service is using Kafka, Celery, or another supported queue system.
- Destination: The topic/queue name (e.g., topic1, queue1).
- Kind Tells weather the service is acting as producer or consumer.
- Error Percentage: The percentage of message-processing operations (spans) that resulted in an error during the selected time window.
- Latency (P95) in ms: The 95th percentile latency (in milliseconds) for message operations in this row.
- Throughput (ops/s): The rate at which this operation (producer or consumer) is being executed.
Exploring a Queue Component in Detail
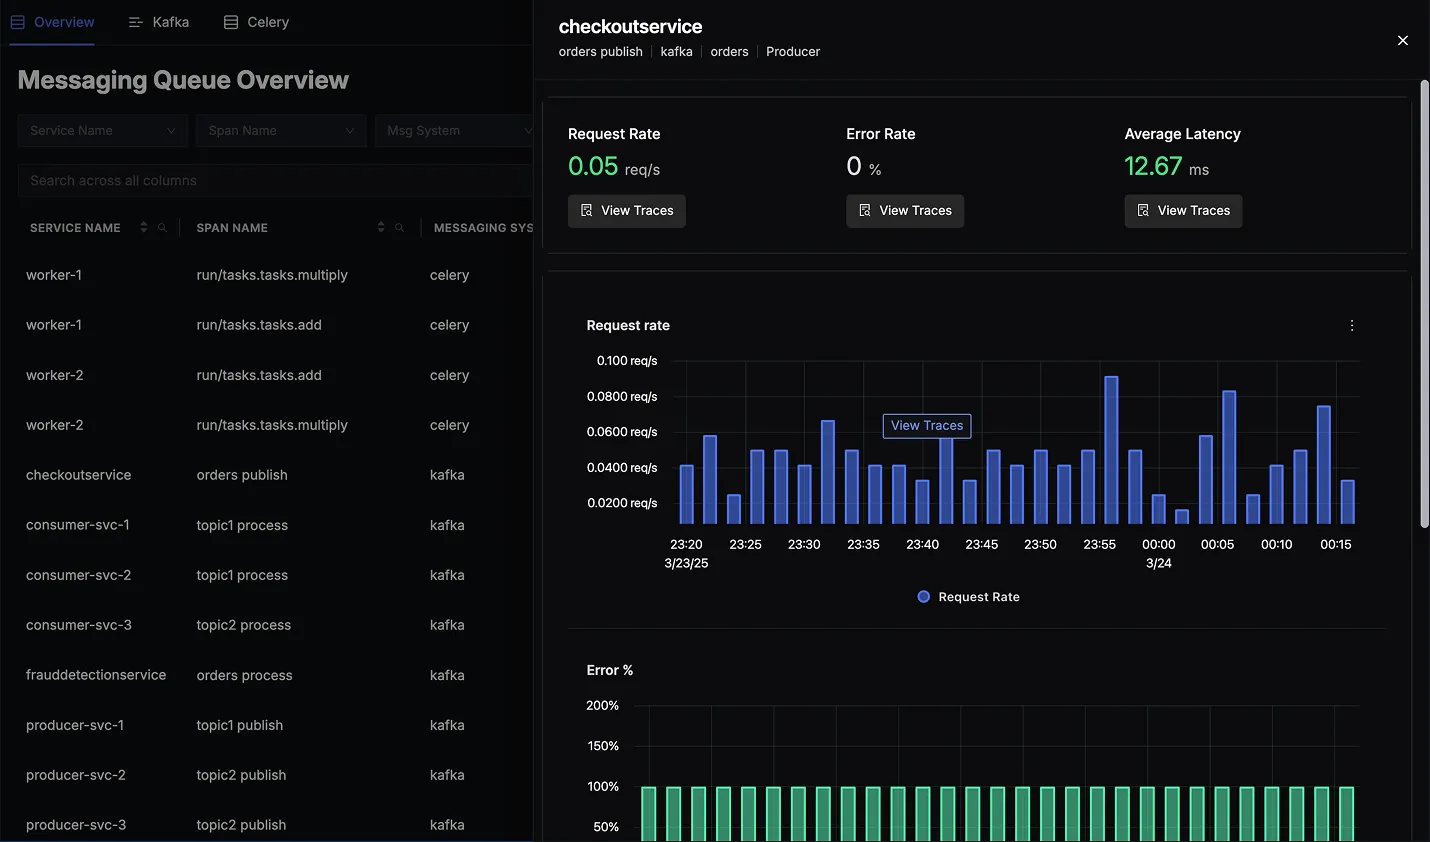
When you click on any row in the Messaging Queues Overview table, a detailed panel appears to the right, providing real-time metrics and historical charts for the selected queue or consumer. This panel allows you to:
View Request Rate
- See how many messages are being published or processed over time.
- Visualized as a bar chart so you can spot changes or spikes in traffic.
Check Error Rate
- Monitor the percentage of failed operations.
- Helpful for identifying patterns of errors (e.g., sudden spikes or consistent failures).
Monitor Latency
- Track multiple latency percentiles(p90, p95, p99) for deeper insight into performance distribution.
- Quickly spot outliers or escalating response times.
Drill Down into Traces
- Click on any data point within the charts to access the trace details for that specific time.
- Investigate errors or latency spikes in context, using the full power of distributed tracing.
Using Filters and Search
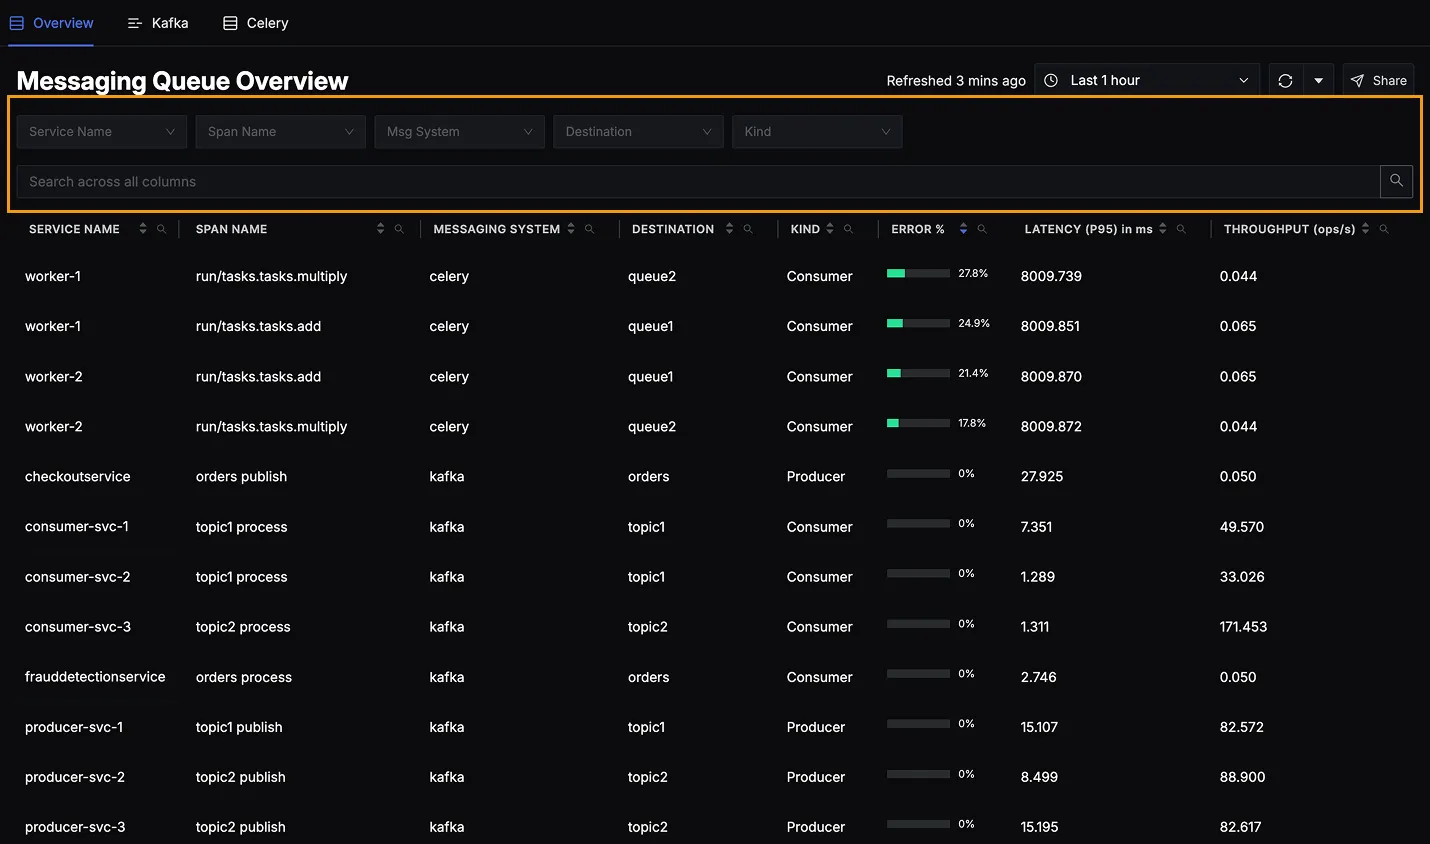
At the top of the Messaging Queue Overview page, you’ll find filters and a search bar.
Each filter supports multi-select, allowing you to combine multiple values for a more refined view:
- Service Name – Select one or more producers/consumers like
consumer-svc-1,worker-1, etc. - Span Name – Filter by operations such as
topic1 process,apply.async.tasks.add, and more. - Messaging System – Choose one or more systems like
Kafka,Celery, etc. - Destination – Select multiple queues or topics like
orders,queue1,topic2, etc. - Kind – Toggle between
Producer,Consumer, or both.
You can also use the search bar on the top to quickly locate matching entries across any column.
Key Takeaways
- SigNoz automatically detects any OpenTelemetry-instrumented message queue interactions—no extra configuration needed beyond standard instrumentation.
- The overview gives you immediate visibility into which queues exist, which services are producing or consuming messages, and any red flags (e.g., high latency or error spikes).
- Drilling down on a specific queue reveals more granular metrics, plus direct links to spans and traces for deeper troubleshooting.
This overview page is your primary entry point for monitoring and investigating the health of your Kafka topics and Celery tasks, enabling you to quickly detect, diagnose, and resolve any performance issues in your messaging workflows.
Roadmap
- Additional Message Systems: SQS and more.
- Expanded Language Support: .NET, Node.js, etc.
- Advanced Analytics: Automated anomaly detection and scaling triggers based on queue behavior.
Explore the dedicated docs for each queue type:
