This guide explains how to configure the OpenTelemetry Collectors deployed by the SigNoz K8s-Infra Helm chart. You'll learn how to set up telemetry data collection and enable the collection of metrics, logs, and traces from your Kubernetes cluster.
To install K8s-Infra in your Kubernetes cluster, please check out the k8s-infra Installation guide
Send Data from Instrumented Applications
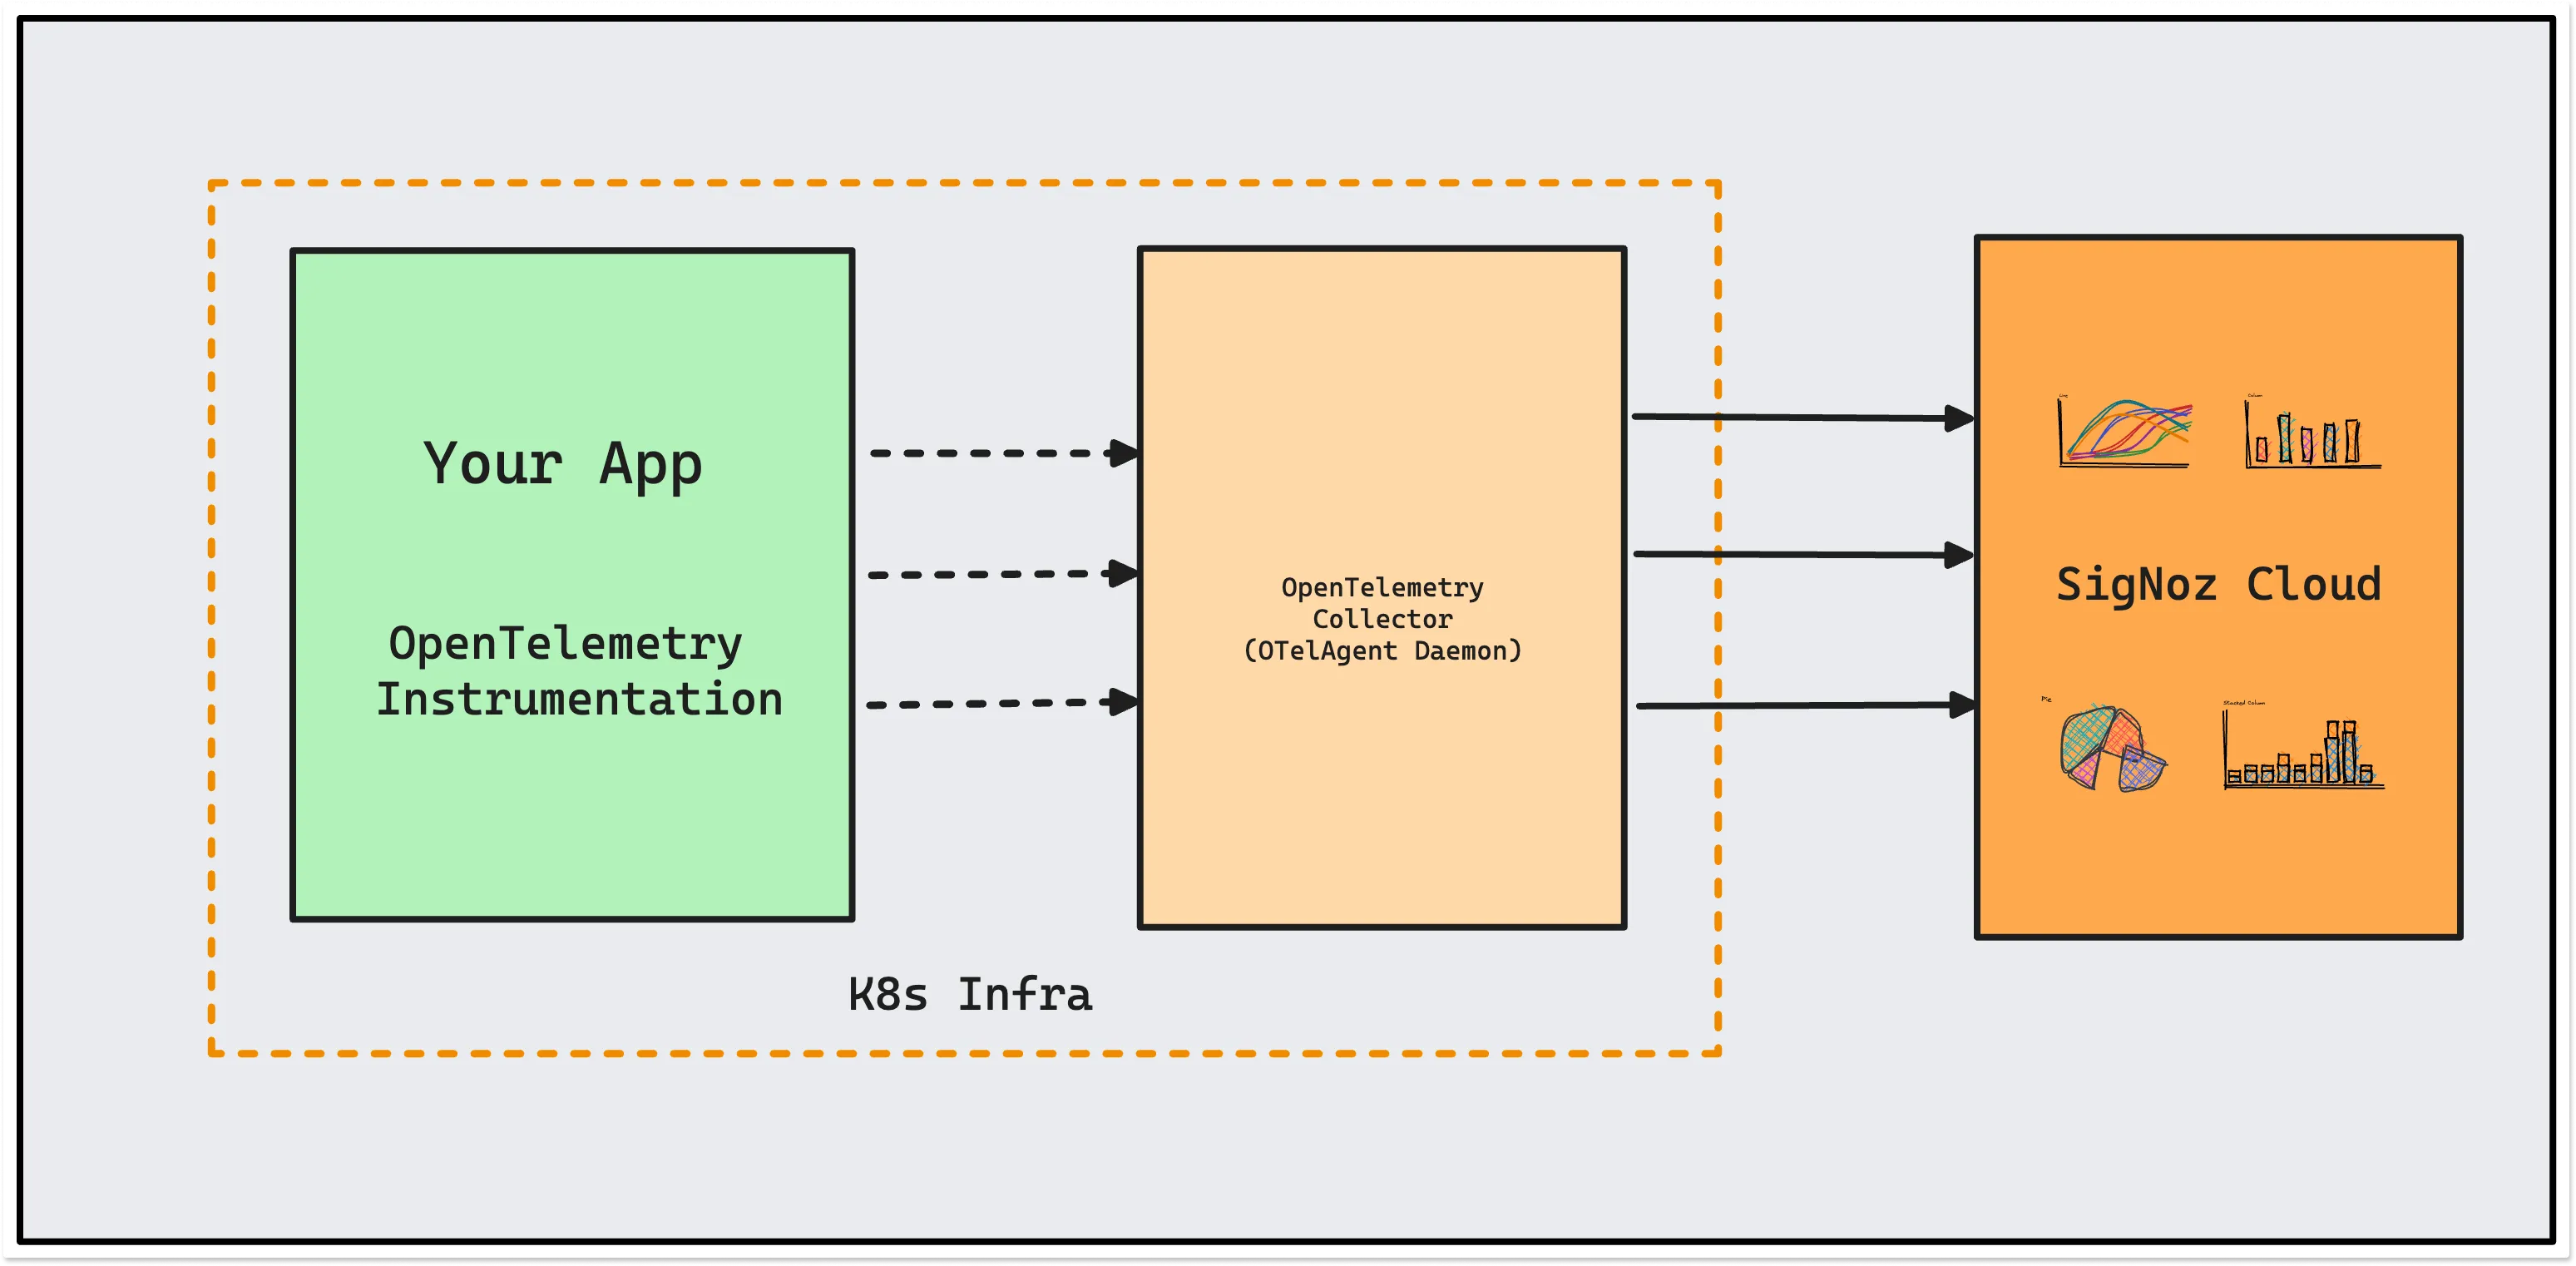
OpenTelemetry instrumented application sends data to OTelAgent Daemon deployed in your k8s infra. The OTelAgent daemon sends the collected data to SigNoz.
In case of GKE Autopilot, you will not be able to send data to OTelAgent Daemon via host port. You will need to use either the SigNoz ingestion endpoint directly or OtelAgent service name.
For OtelAgent service name, the endpoint would be something like my-release-k8s-infra-otel-agent.default.svc:4317. Replace my-release with your helm release name and default with your namespace.
To send data from your applications, you must first instrument it with OpenTelemetry. You can find instrumentation instructions for your specific language [here][10].
Once you're done instrumenting your application, add below to your application manifest files for applications to start sending data to the otel-collectors running as DaemonSet.
For example, you can add the below config to your application manifest file.
env:
  - name: HOST_IP
    valueFrom:
      fieldRef:
        fieldPath: status.hostIP
  - name: K8S_POD_IP
    valueFrom:
      fieldRef:
        apiVersion: v1
        fieldPath: status.podIP
  - name: K8S_POD_UID
    valueFrom:
      fieldRef:
        fieldPath: metadata.uid
  - name: OTEL_EXPORTER_OTLP_INSECURE
    value: "true"
  - name: OTEL_EXPORTER_OTLP_ENDPOINT
    value: $(HOST_IP):4317
  - name: OTEL_RESOURCE_ATTRIBUTES
    value: service.name=APPLICATION_NAME,k8s.pod.ip=$(K8S_POD_IP),k8s.pod.uid=$(K8S_POD_UID)
- Replace
APPLICATION_NAMEwith your application name that you wish to see in SigNoz. - In cases of some SDKs, you would need to include
http://orhttps://prefix forOTEL_EXPORTER_OTLP_ENDPOINT
Disable Logs Collection
In case you do not want to collect logs from your Kubernetes cluster, you can disable using presets in k8s-infra chart.
presets:
  logsCollection:
    enabled: false
Disable Metrics Collection
In case you do not want to collect metrics from your Kubernetes cluster, you can disable using presets in k8s-infra chart.
presets:
  hostMetrics:
    enabled: false
  kubeletMetrics:
    enabled: false
  clusterMetrics:
    enabled: false

otelDeployment:
  enabled: false
Essential Presets
SigNoz allows you to use the presets in the k8s-infra Helm chart to easily configure OtelCollector. The following configurations can be set by modifying the values.yml in the k8s-infra Helm chart.
The presets section in the values.yaml file allows you to enable or disable specific configurations. To check the available presets, refer to the k8s-infra Helm chart documentation.
1. OTLP Exporter
presets:
  otlpExporter:
    enabled: true  # Must be enabled for data to reach SigNoz
What it does: Enables sending telemetry data to SigNoz backend. This is required for SigNoz to receive any data.
2. Host Metrics Collection
presets:
  hostMetrics:
    enabled: true
    collectionInterval: 30s  # Adjust based on your monitoring needs
    scrapers:
      cpu: {}        # Collects CPU usage, time, and utilization metrics
      load: {}       # Collects system load averages
      memory: {}     # Collects memory usage metrics
      disk:          # Collects disk I/O metrics
        exclude:
          devices:   # Regex patterns to exclude specific devices
            - ^ram\d+$
            - ^loop\d+$
            # Add custom device exclusions here
      filesystem:    # Collects filesystem metrics
        exclude_fs_types:
          fs_types:
            - tmpfs
            - squashfs
            # Add filesystem types to exclude
      network:       # Collects network metrics
        exclude:
          interfaces:
            - ^veth.*$    # Excludes virtual ethernet devices
            - ^docker.*$  # Excludes docker interfaces
            # Add network interfaces to exclude
Key points:
- Adjust
collectionIntervalbased on your monitoring granularity needs - Customize device exclusions to reduce noise from irrelevant storage devices
- Configure network interface exclusions to focus on relevant network metrics
3. Container Log Collection
presets:
  logsCollection:
    enabled: true
    startAt: beginning      # Options: beginning or end
    includeFilePath: true   # Adds file path as metadata
    includeFileName: false  # Adds file name as metadata

    # Exclusion configuration
    blacklist:
      enabled: true
      signozLogs: true     # Excludes SigNoz's own logs
      namespaces:
        - kube-system      # Add namespaces to exclude
      pods:
        - hotrod          # Add pod names to exclude
        - locust
      containers: []       # Add container names to exclude

    # Inclusion configuration (overrides blacklist if enabled)
    whitelist:
      enabled: false
      signozLogs: true
      namespaces: []      # Only collect logs from these namespaces
      pods: []            # Only collect logs from these pods
      containers: []      # Only collect logs from these containers
Best practices:
- Use blacklist for excluding noisy system pods
- Enable whitelist when you need to monitor specific applications only
- Consider disk usage implications when enabling file path/name inclusion
4. Kubernetes Metrics Collection
presets:
  kubeletMetrics:
    enabled: true
    collectionInterval: 30s
    authType: serviceAccount    # Authentication method
    endpoint: ${env:K8S_HOST_IP}:10250
    insecureSkipVerify: true   # Set to false in production

    # Metrics configuration
    metrics:
      k8s.pod.cpu_limit_utilization:
        enabled: true
      k8s.pod.memory_limit_utilization:
        enabled: true
      # Enable other metrics as needed
Important settings:
- Set appropriate
collectionIntervalbased on cluster size - Configure
insecureSkipVerify: falsein production environments - Enable specific metrics based on monitoring requirements
5. Kubernetes Metadata Enrichment
presets:
  kubernetesAttributes:
    enabled: true
    passthrough: false    # Set true to disable k8s API calls

    # Control which metadata to collect
    extractMetadatas:
      - k8s.namespace.name
      - k8s.deployment.name
      - k8s.pod.name
      - k8s.node.name
      # Add or remove metadata fields

    # Pod association configuration
    podAssociation:
      - sources:
        - from: resource_attribute
          name: k8s.pod.ip
      - sources:
        - from: resource_attribute
          name: k8s.pod.uid
      - sources:
        - from: connection
    # This label/annotation extraction rule takes the value of the key from labels/annotations and maps it to the tag_name attribute which will be added to the associated resources
    extractLabels:
      # Example from pod
      - tag_name: service.name
        key: app.kubernetes.io/name
        from: pod
      # Example from node
      - tag_name: os.type
        key: beta.kubernetes.io/os
        from: node

    # Annotation extraction configuration
    extractAnnotations:
      # Example from node
      - tag_name: node.ttl
        key: node.alpha.kubernetes.io/ttl
        from: node
Configuration tips:
- Enable only required metadata fields to optimize performance
- Use
passthrough: truein very large clusters to reduce API load - Configure pod association based on your networking setup
The from: field selects which Kubernetes object the processor reads the label or annotation from. The examples above use pod and node, but other workload kinds are supported as well, and each reads from its own metadata.
Refer to the opentelemetry k8sattributes processor documentation for the full list of supported sources and the exact behavior of each.
If telemetry suddenly stops getting Kubernetes attributes (k8s.pod.name, k8s.namespace.name, etc.) after a values.yaml change, an override on podAssociation is the most likely cause.
Helm replaces arrays entirely rather than merging them. When you override podAssociation, the chart's defaults are dropped — including the connection rule that matches telemetry by the source IP of the OTLP connection, and the k8s.pod.uid rule used by file-based log collection. Without those fallbacks the processor cannot associate telemetry with a pod, and extractLabels / extractAnnotations stop producing attributes.
If you customize podAssociation, include the rules you need from the chart defaults alongside your additions.
6. Cluster-level Metrics
presets:
  clusterMetrics:
    enabled: true
    collectionInterval: 30s

    # Node conditions to monitor
    nodeConditionsToReport:
      - Ready
      - MemoryPressure
      - DiskPressure
      # Add conditions based on monitoring needs

    # Resource types to monitor
    allocatableTypesToReport:
      - cpu
      - memory
      # - storage    # Uncomment if needed
When to use:
- Enable for cluster health monitoring
- Useful for capacity planning and resource optimization
- Essential for multi-node cluster monitoring
7. Kubernetes Events
presets:
  k8sEvents:
    enabled: true
    authType: serviceAccount
    namespaces: []    # Empty for all namespaces, or specify list
Usage scenarios:
- Enable for debugging and audit trails
- Monitor specific namespaces by listing them
- Useful for compliance and security monitoring
8. Prometheus Metrics Scraping
Prometheus preset allows to scrapes metrics from pods that have the appropriate annotations. This enables collecting metrics from applications that expose Prometheus endpoints without manual configuration.
presets:
  prometheus:
    enabled: true
    annotationsPrefix: signoz.io    # Prefix for pod annotations
    scrapeInterval: 60s              # How often to scrape metrics
    namespaceScoped: false           # Limit to same namespace only
    namespaces: []                   # Specific namespaces to scrape
    includePodLabel: false           # Include pod labels (may increase cardinality)
    includeContainerName: false      # Include container name in metrics
    scrapeConfigs: []                # Custom scrape configurations
Custom Scrape Configurations
For more advanced use cases, you can define custom scrape configurations using the scrapeConfigs field. This allows you to specify Prometheus-compatible scrape configs directly:
presets:
  prometheus:
    enabled: true
    scrapeConfigs:
      # Scrape metrics from a specific service
      - job_name: 'my-custom-service'
        static_configs:
          - targets: ['my-service.default.svc.cluster.local:9090']
            labels:
              environment: 'production'
Configurations
The k8s-infra chart exposes the full OpenTelemetry Collector configuration via Helm values, so you can adapt the running agents to your needs. The following are common options you may want to adjust.
Batch Processor
The batch processor batches spans, metrics, and logs before export. That reduces connections and improves compression. It supports both size-based and time-based batching.
Configure the batch processor by overriding otelAgent.config.processors.batch and otelDeployment.config.processors.batch in your Helm values. Example override:
otelAgent:
  config:
    processors:
      # otelAgent.config.processors.batch -- Batch processor config.
      batch:
-        send_batch_size: 10000
+        send_batch_size: 15000
+        send_batch_max_size: 20000 # settings can be provided as key value pairs
Any setting supported by the OpenTelemetry batch processor can be set under processors.batch in the chart values.
Adding Custom Processors to Pipelines
Defining a processor under otelAgent.config.processors (or otelDeployment.config.processors) adds it to the collector configuration but does not automatically include it in any pipeline. To activate a custom processor, reference it in the relevant pipeline's processors list under otelAgent.config.service.pipelines (or otelDeployment.config.service.pipelines for the deployment collector).
When you override a pipeline's processors list, Helm replaces the entire list — the chart's defaults for that pipeline are dropped. Always include both your custom processor and every default processor you still want to run in that pipeline.
Common Deployment Scenarios
Production Cluster with Full Monitoring
presets:
  otlpExporter:
    enabled: true
  hostMetrics:
    enabled: true
    collectionInterval: 30s
  logsCollection:
    enabled: true
    blacklist:
      enabled: true
      namespaces:
        - kube-system
  kubeletMetrics:
    enabled: true
    insecureSkipVerify: false
  kubernetesAttributes:
    enabled: true
  clusterMetrics:
    enabled: true
  k8sEvents:
    enabled: true
Resource-Constrained Environment
presets:
  otlpExporter:
    enabled: true
  hostMetrics:
    enabled: true
    collectionInterval: 60s
  logsCollection:
    enabled: true
    whitelist:
      enabled: true
      namespaces:
        - production
  kubeletMetrics:
    enabled: true
    collectionInterval: 60s
  kubernetesAttributes:
    enabled: true
    passthrough: true
Development Environment
Telemetry data can be tagged with a "deployment environment" attribute (such as development, staging, or production) by setting it globally or explicitly in your application's OTEL_RESOURCE_ATTRIBUTES.
global:
  deploymentEnvironment: <DEPLOYMENT_ENVIRONMENT>
You can specify the environment by including deployment.environment in the OTEL_RESOURCE_ATTRIBUTES environment variable of your application manifest. This will take precedence over the global.deploymentEnvironment setting in the k8s-infra chart—or, if not set, the global value will be used.
env:
  - name: OTEL_RESOURCE_ATTRIBUTES
    value: deployment.environment=<DEPLOYMENT_ENVIRONMENT>
Exposing Ports for Custom Receivers
You may want to use a custom receiver to receive metrics. If the receiver listens on a port, you need to expose that port to the host. The following example shows how to expose port 8125 of statsd receiver:
ports:
  statsdReceiverPort:
    enabled: true
    containerPort: 8125
    servicePort: 8125
    hostPort: 8125
    protocol: UDP
Configuring otelDeployment to collect from additional components
The otelDeployment collector is configured to collect cluster metrics and events by default. There are some use cases where you might want to collect metrics from components other than the ones that are being collected by default.
This section describes how to override the default configuration of the otelDeployment collector to collect metrics from additional components. The override-values.yaml file contains the configurations that you can override.
Example 1: Redis Receiver Configuration
The following configuration shows how to configure the otelDeployment collector to collect metrics from a Redis server running inside a namespace "redis-ns" with the name "redis-server" and port 6379:
otelDeployment:
  config:
    receivers:
      redis:
        endpoint: redis-server.redis-ns.svc.cluster.local:6379
    service:
      pipelines:
        metrics/internal:
          receivers: [redis]
          processors: [batch]
          exporters: []
Example 2: Configuring a PostgreSQL receiver
The following configuration shows how to configure the otelDeployment collector to collect metrics from a PostgreSQL server running inside a namespace "postgres-ns" with the name "postgres-server" and port 5432:
otelDeployment:
  config:
    receivers:
      postgres:
        endpoint: postgres-server.postgres-ns.svc.cluster.local:5432
    service:
      pipelines:
        metrics/internal:
          receivers: [postgres]
          processors: [batch]
          exporters: []
Example 3: Configuring multiple receivers
The following configuration shows how to configure both Redis and PostgreSQL receivers:
otelDeployment:
  config:
    receivers:
      redis:
        endpoint: redis-server.redis-ns.svc.cluster.local:6379
      postgres:
        endpoint: postgres-server.postgres-ns.svc.cluster.local:5432
    service:
      pipelines:
        metrics/internal:
          receivers: [redis, postgres]
          processors: [batch]
          exporters: []
The above examples are simple and show how to configure the otelDeployment collector to collect metrics from a single component. However, in a real-world scenario, you might need to configure the receiver with a username and password and other configurations.
Troubleshooting
A custom processor under otelAgent.config.processors does not appear to run
Defining a processor in values renders it into the collector configuration, but does not attach it to any pipeline. Confirm the processor is referenced in the relevant pipeline's processors list — see Adding Custom Processors to Pipelines. After applying the change and restarting the collector pods, verify in SigNoz Explorer that the attribute or transformation introduced by the processor is present on the relevant signal.
Telemetry stopped getting Kubernetes attributes after customizing podAssociation
Helm replaces array values rather than merging them, so an override on podAssociation drops the chart defaults — including the fallbacks the processor needs to associate telemetry with a pod. See the warning under Kubernetes Metadata Enrichment for the rules to keep. After restoring the rules and restarting the collector pods, confirm in SigNoz Explorer that resource attributes such as k8s.pod.name and k8s.namespace.name are populated on traces, metrics, or logs from your workloads.
Resource Requirements
Recommended resource allocations based on preset combinations:
| Configuration | CPU Request | Memory Request | CPU Limit | Memory Limit |
|---|---|---|---|---|
| Minimal | 100m | 256Mi | 200m | 512Mi |
| Standard | 200m | 512Mi | 500m | 1Gi |
| Full | 500m | 1Gi | 1000m | 2Gi |
Adjust these values based on your cluster size and monitoring requirements.
