Overview
Metrics Explorer provides instant visibility into all metrics flowing into your SigNoz deployment. This feature automatically discovers, categorises, and visualises every metric being ingested, giving you a complete view of your metrics ecosystem without needing to build dashboards first.
Unlike traditional monitoring workflows that require you to guess metric names from dropdowns, Metrics Explorer shows you exactly what's being ingested with real-time metadata, including types, sample counts, time series cardinality, and data sources.
Metrics Explorer overview interface showing comprehensive metrics visibility
When to Use & Key Benefits
Metrics Explorer delivers specific benefits in these common scenarios:
During service onboarding: Instantly verify that new integrations (AWS, Kubernetes, custom exporters) are working correctly by seeing which metrics are being ingested and from which sources.
When troubleshooting alerts: Quickly investigate alert-related metrics by jumping directly from alerts to see recent activity, metadata, and correlate with related metrics—all without building temporary dashboards.
For cost optimization: Identify high-volume metrics, detect unused or misconfigured metrics, and spot instrumentation redundancies to optimize your observability pipeline.
During incident response: Use the query playground to run ad hoc analyses, compare multiple metrics side-by-side, and correlate performance issues across different services and hosts.
How It Works
Metrics Explorer leverages your existing OpenTelemetry instrumentation to automatically collect and organize metrics metadata. The feature works by analyzing:
| Attribute | Description | Example |
|---|---|---|
| Metric Name | The identifier for the metric | http_requests_total |
| Metric Type | Counter, Gauge, Histogram, or Summary | counter |
| Labels/Tags | Dimensional metadata attached to metrics | service="api", method="GET" |
| Sample Count | Number of data points received | 1,234,567 |
| Time Series | Unique metric name + label combinations | 5,432 |
| Units | Measurement units for the metric | seconds, bytes, requests |
These attributes automatically categorise metrics, calculate cardinality and volume, identify data sources, and provide searchable metadata for quick discovery.
Feature Walkthrough
Summary View
The Metrics Explorer main interface provides two primary visualisation modes:
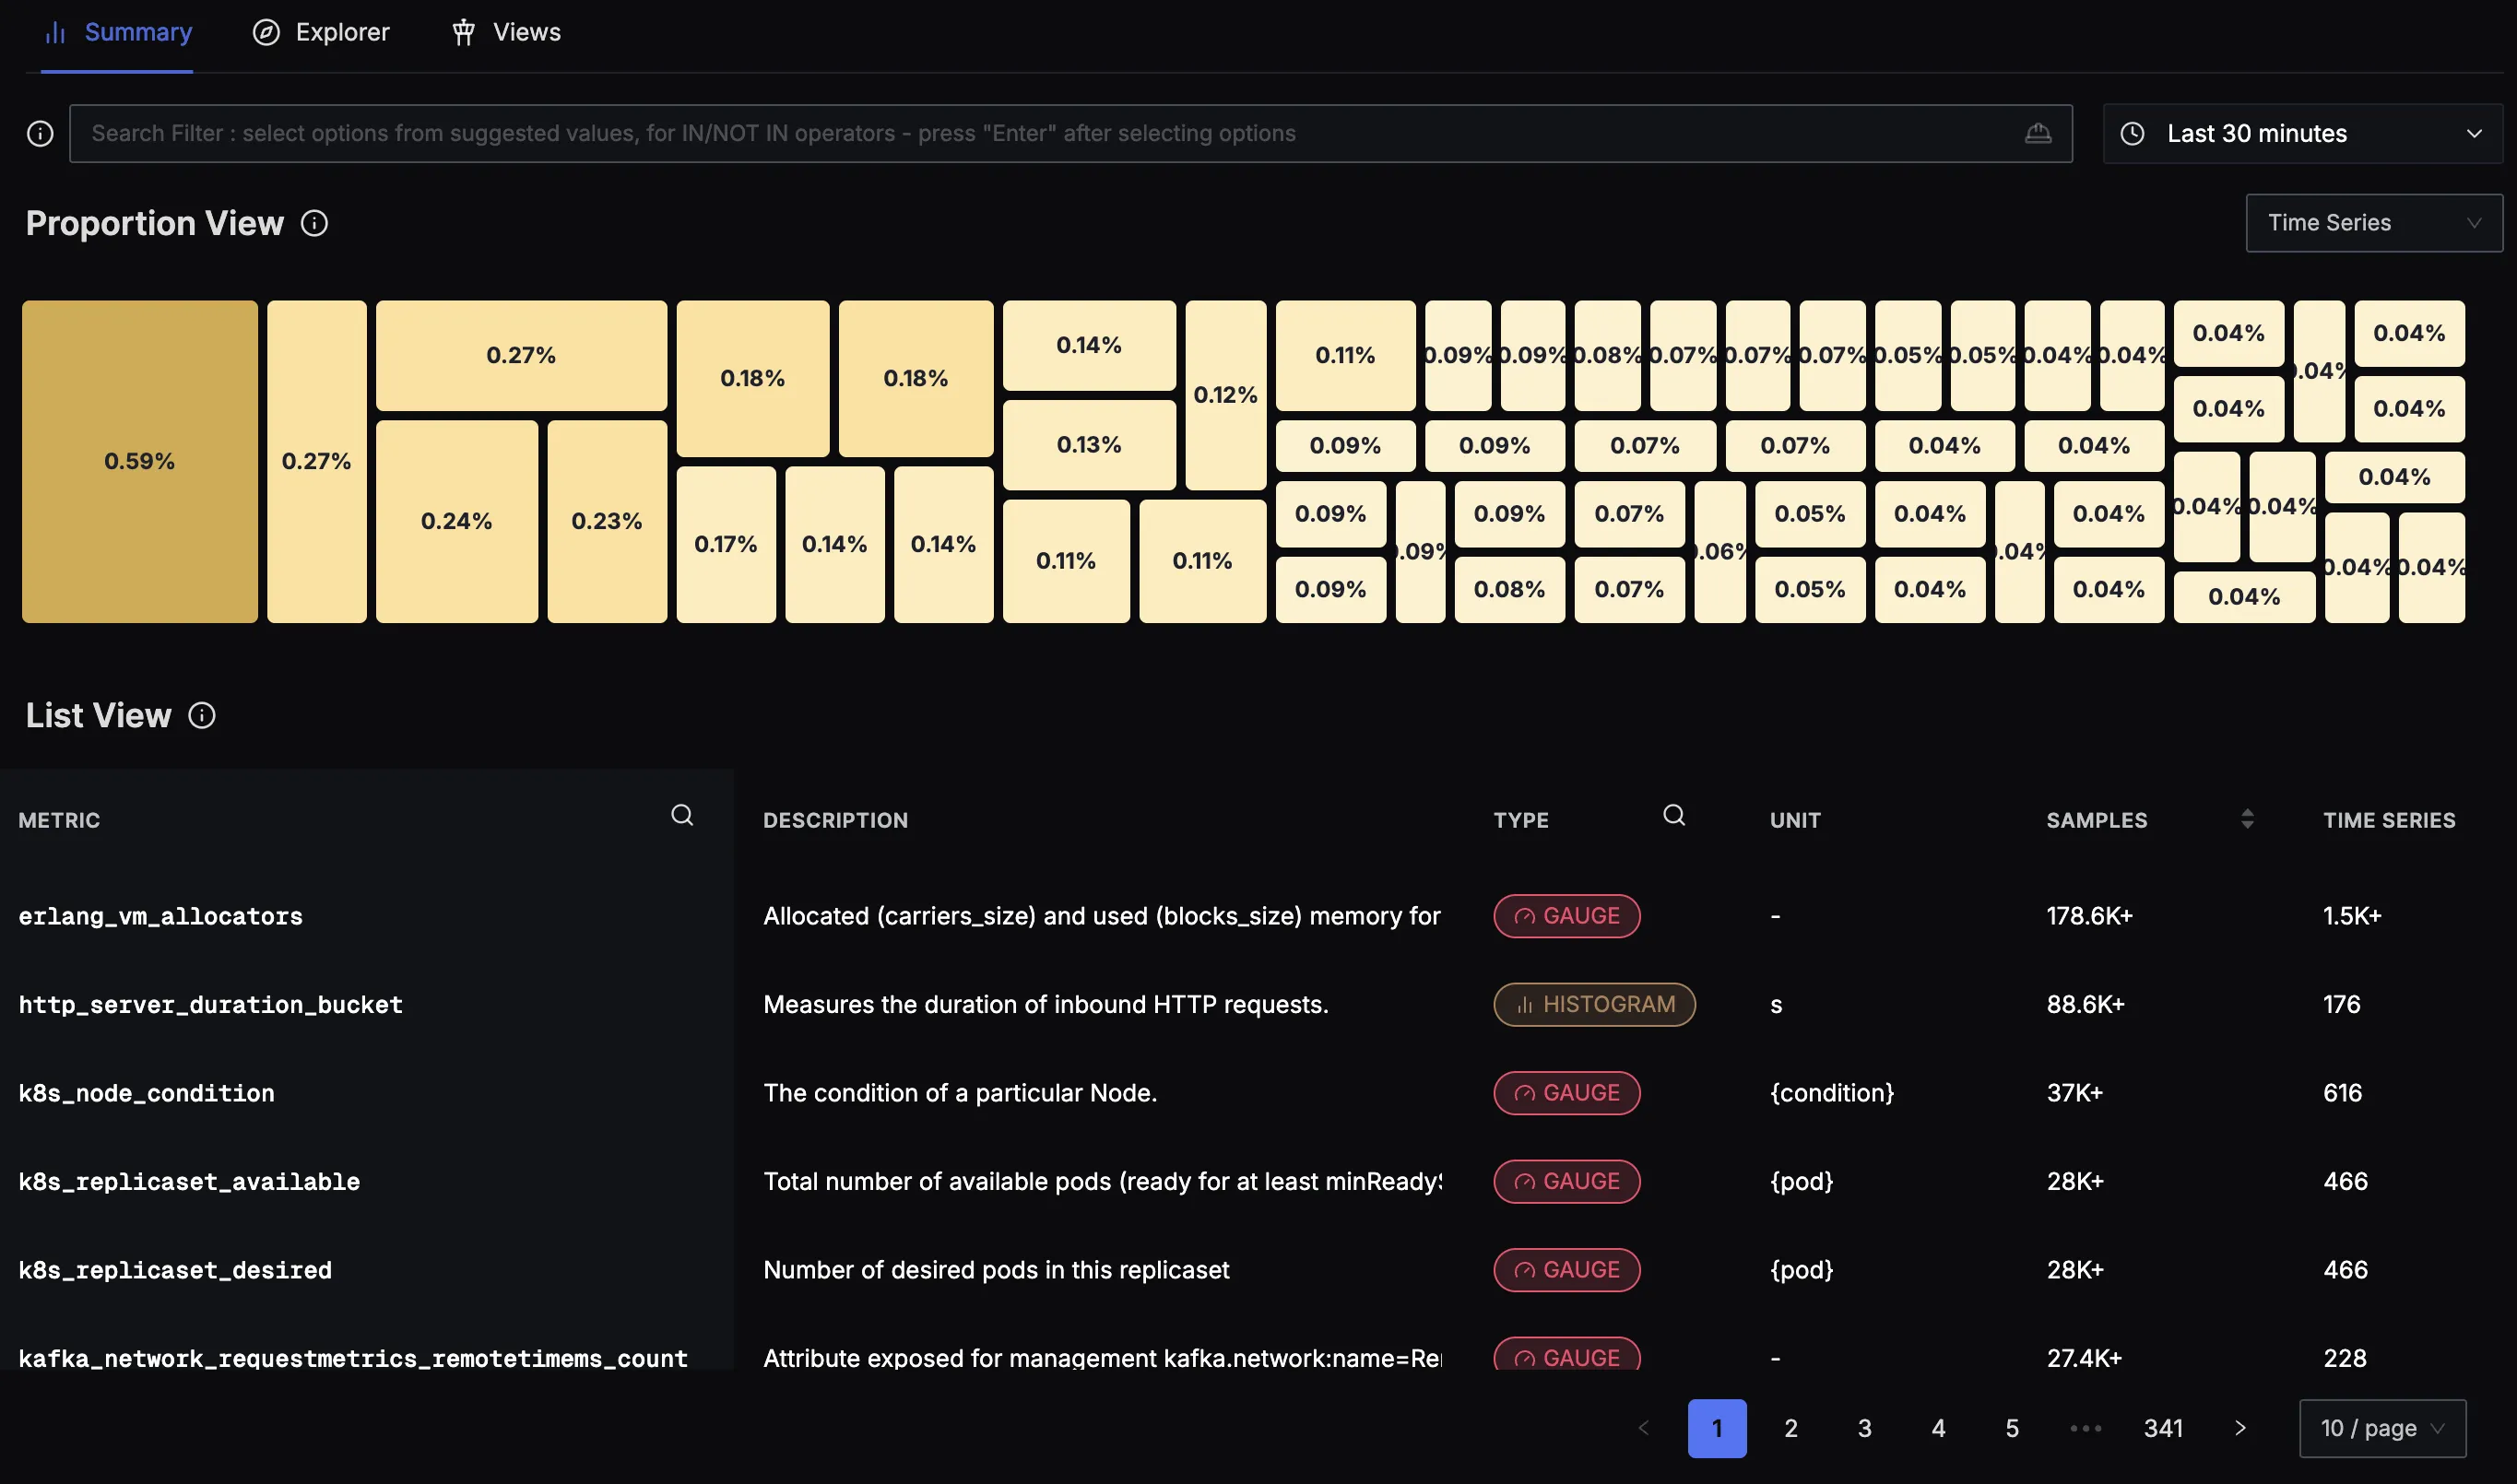
Proportion View
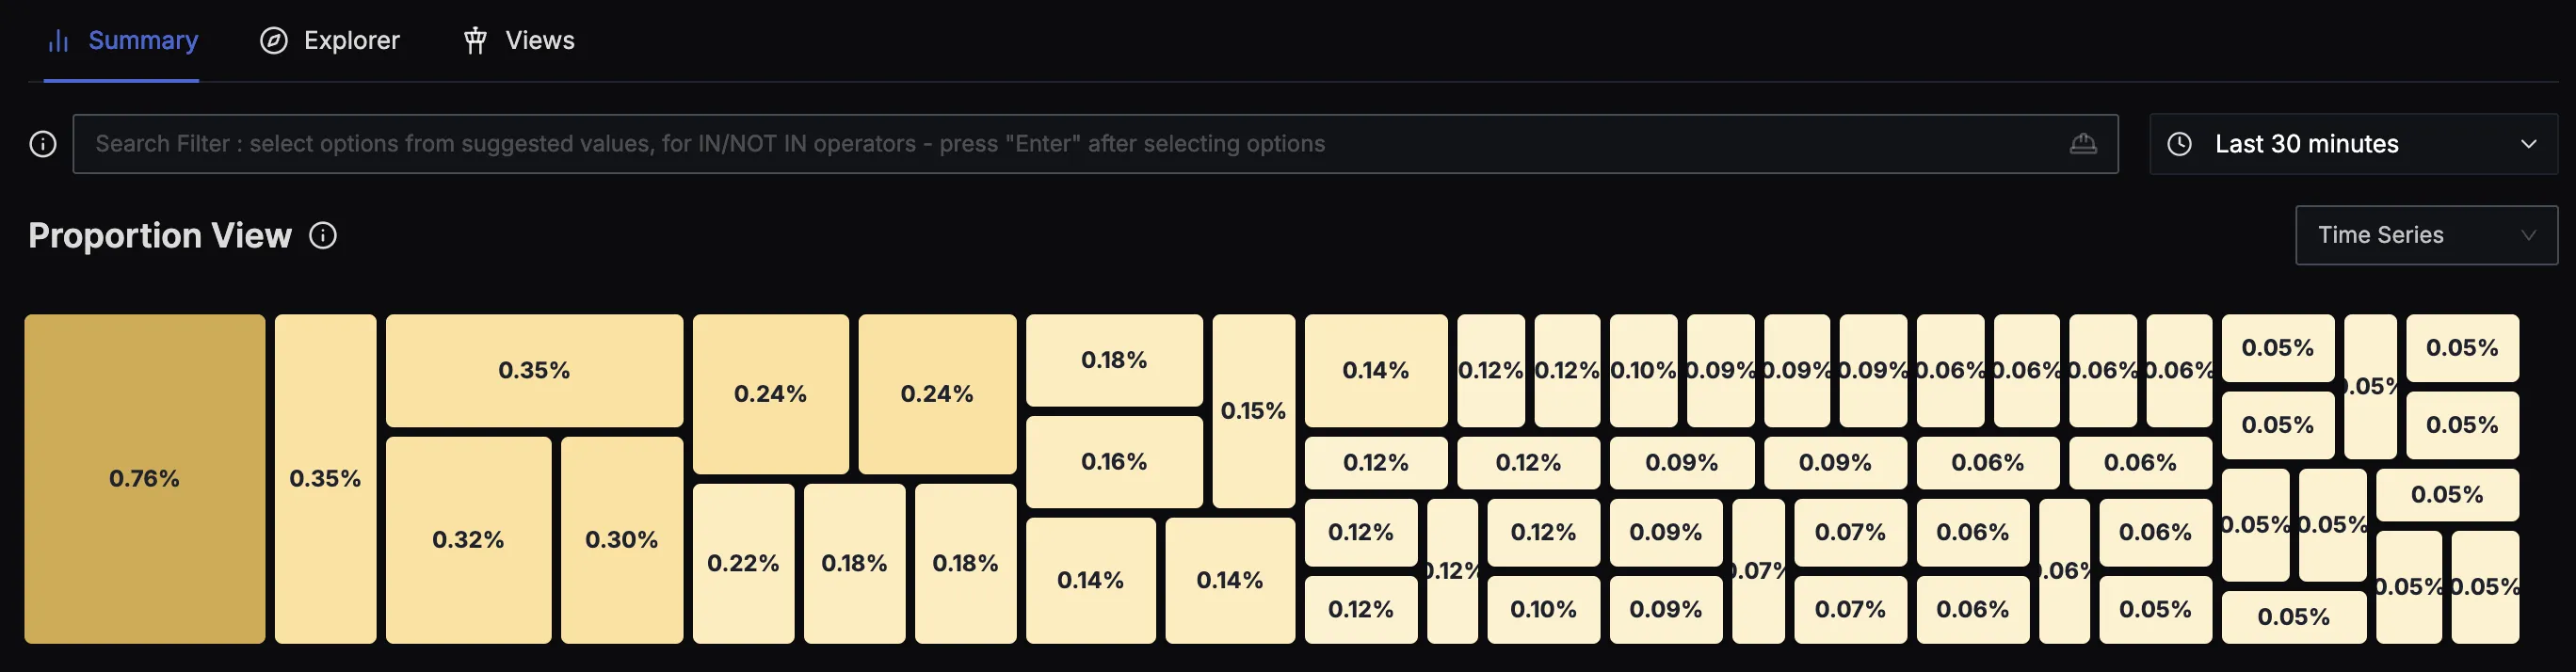
Proportion view showing metrics consumption and ingestion resource usage
The Proportion View presents a treemap visualisation that shows the relative volume of metrics being ingested. Each rectangle represents a metric, with the size proportional to its ingestion volume. This view helps you:
- Identify high-volume metrics that consume the most ingestion resources
- Spot anomalies in metric volume distribution
- Understand proportional impact of different metrics on your system
- Quickly locate metrics that might need optimisation
List View
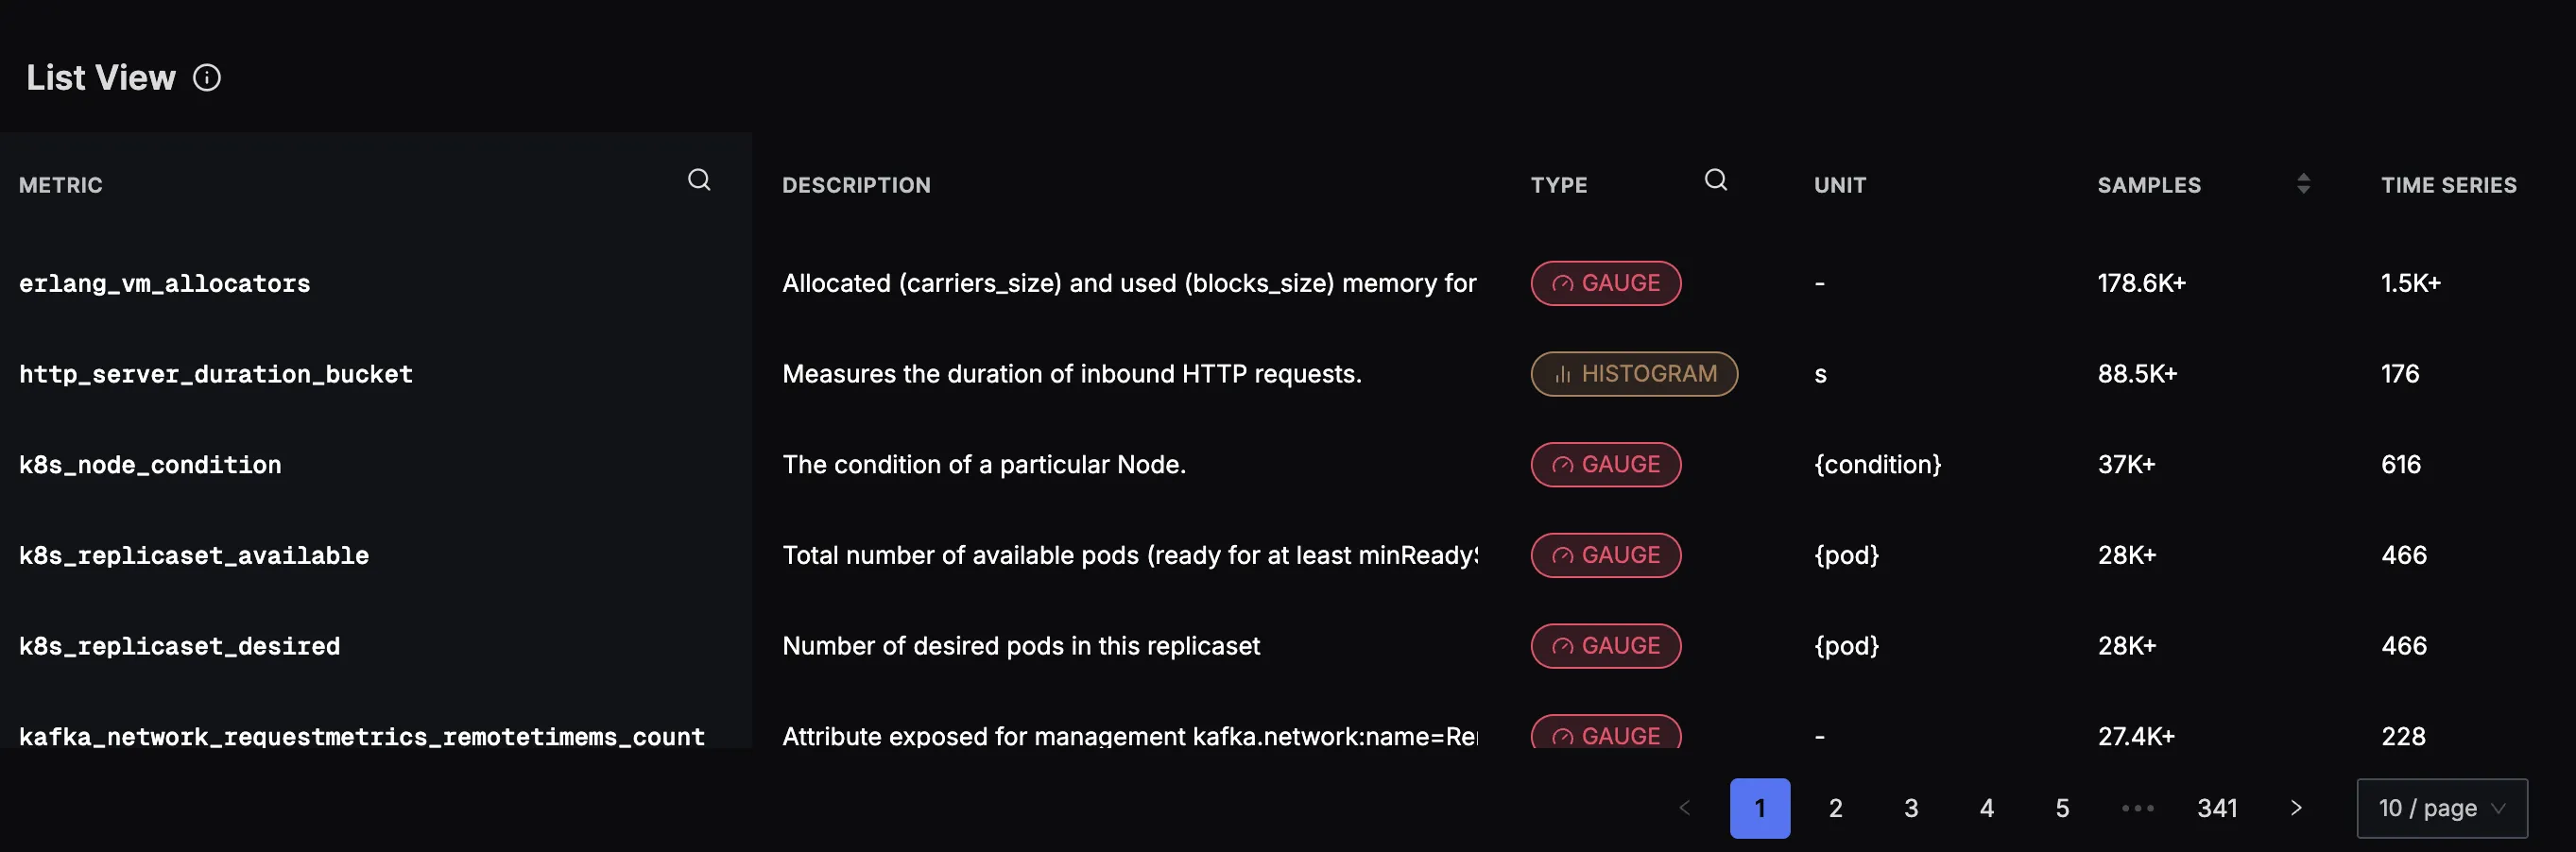
Metrics Explorer list view showing detailed metrics information in tabular format
The List View displays all metrics in a comprehensive table format with the following columns:
- METRIC: The full metric identifier with search capability
- DESCRIPTION: Description of what the metric measures
- TYPE: Metric type indicator (GAUGE, HISTOGRAM, etc.)
- UNIT: Measurement units for the metric
- SAMPLES: Total number of data points received (e.g., "178.6K+")
- TIME SERIES: Number of unique metric + label combinations (e.g., "1.5K+")
Navigation and Filtering
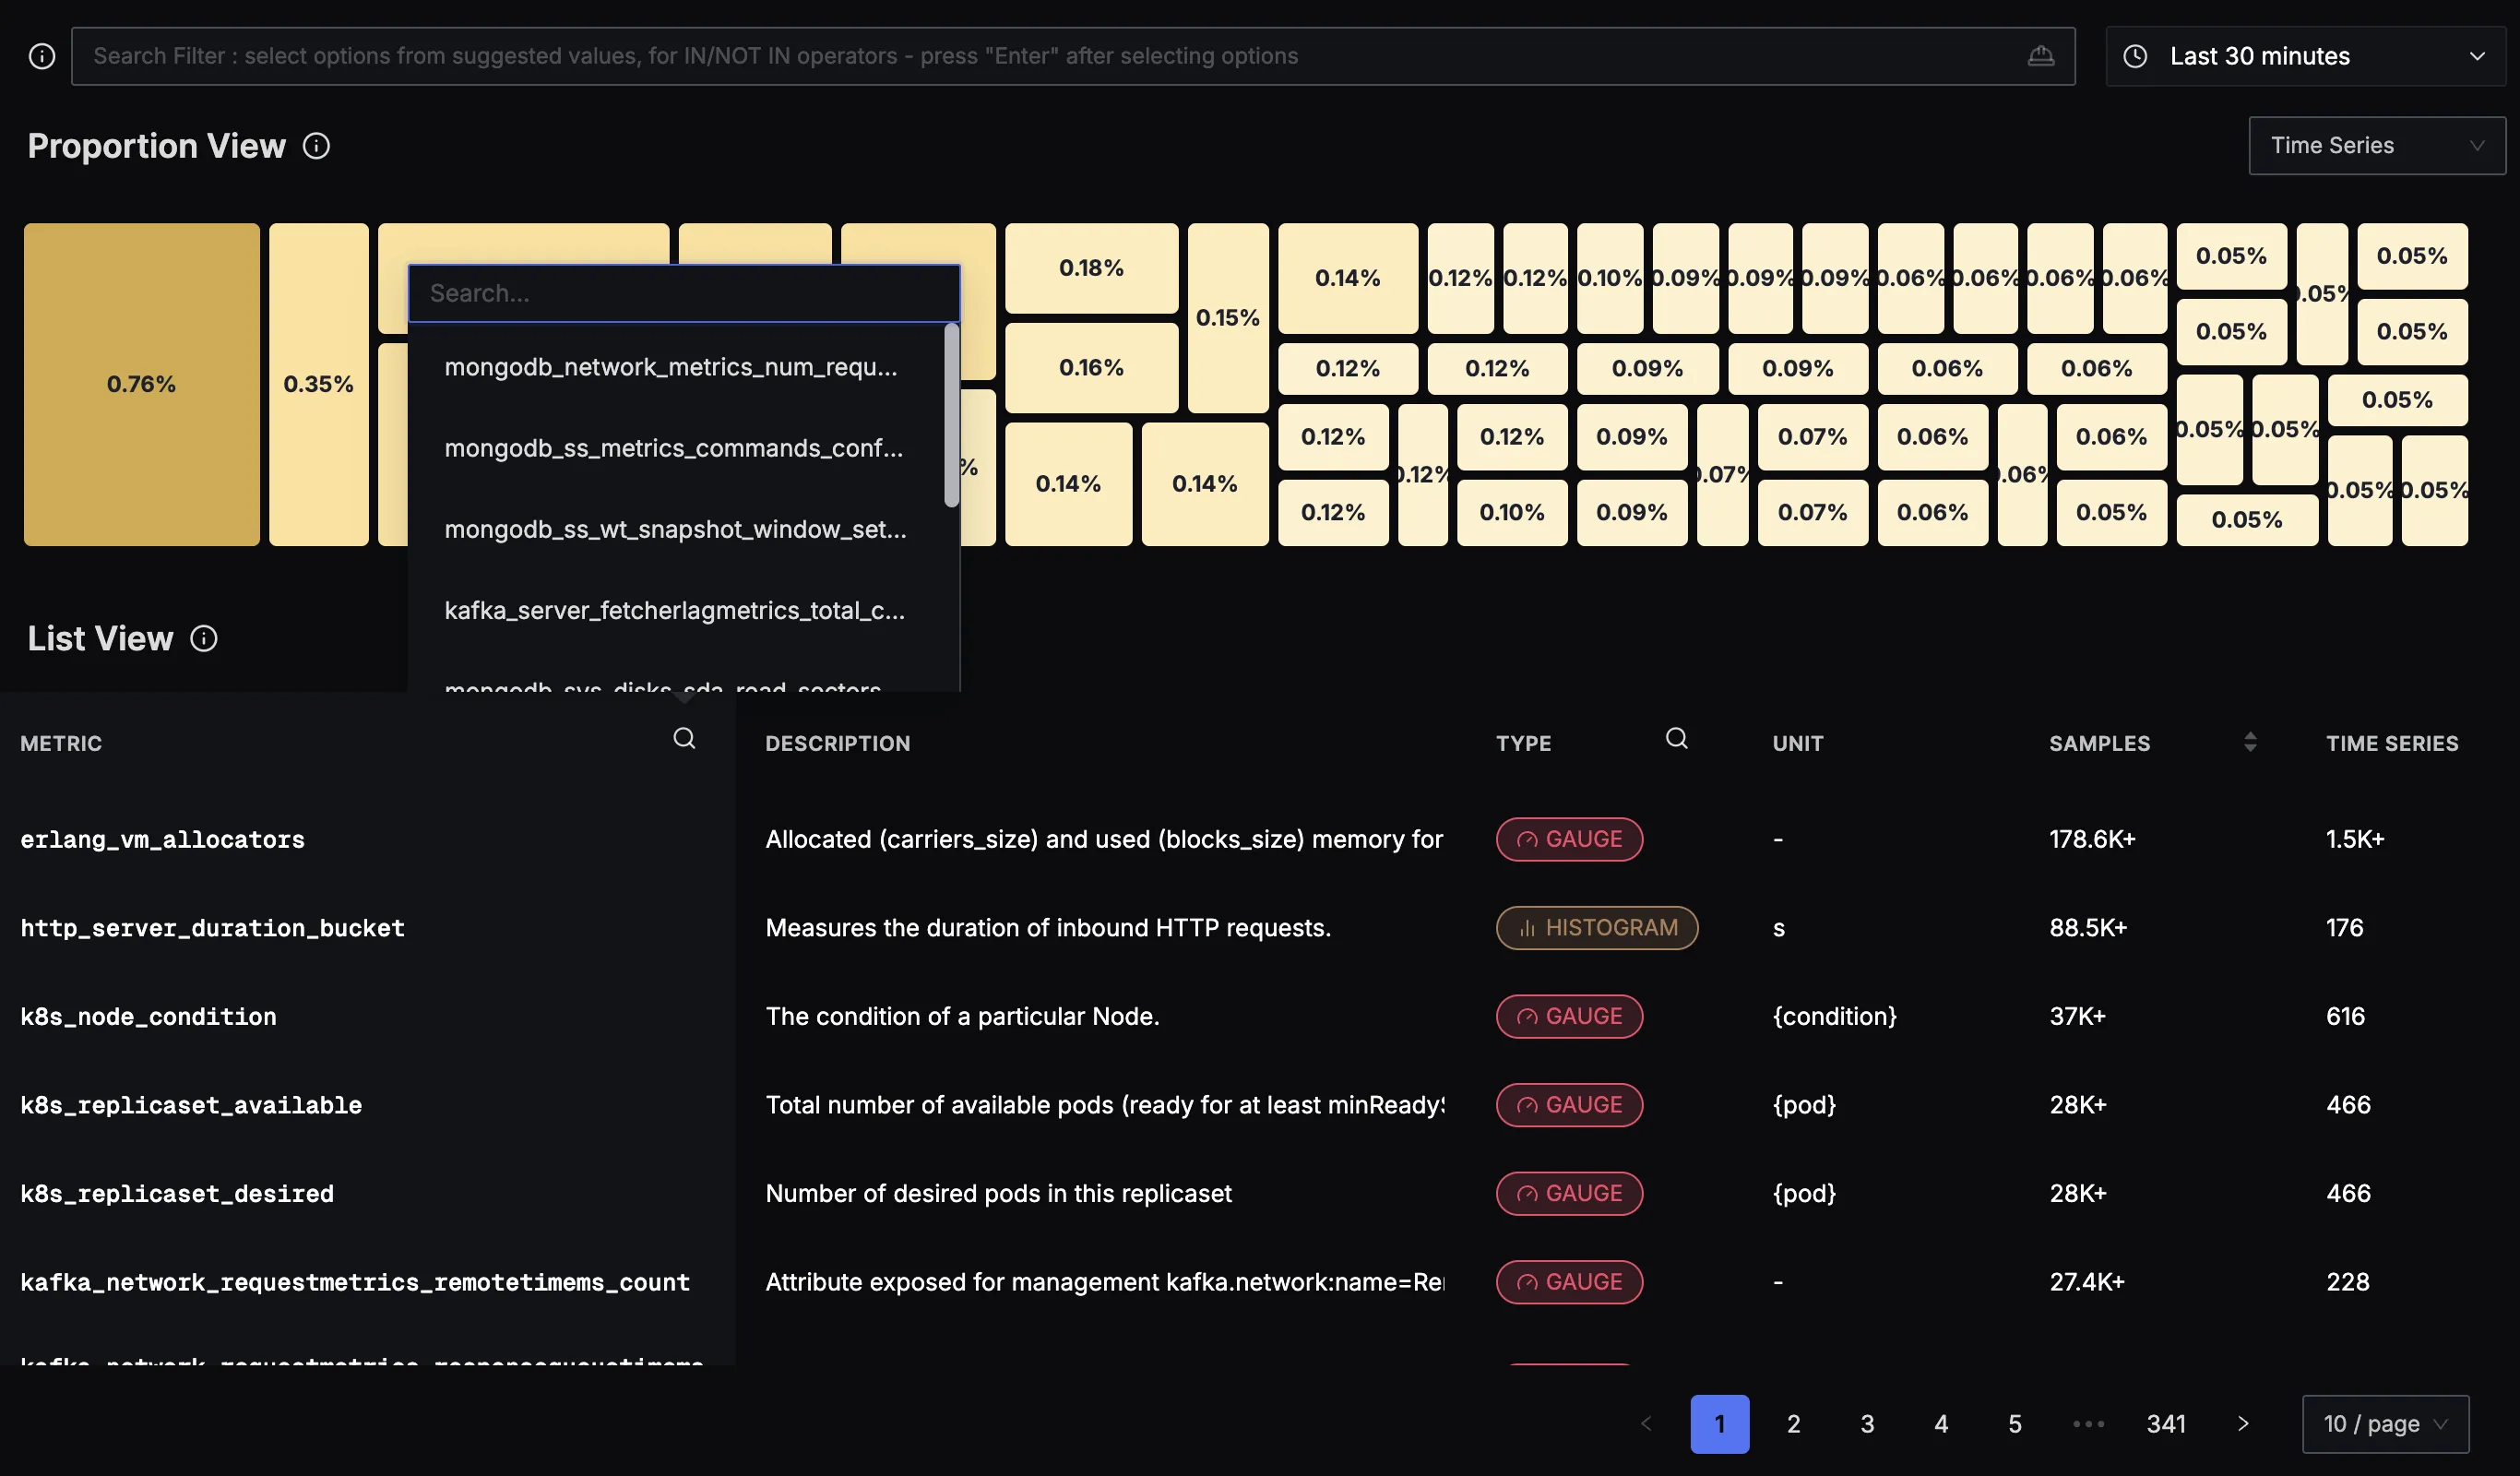
Metrics Explorer search and filter interface for finding specific metrics
You can navigate and filter metrics using:
- Search Filter: Use the search bar at the top to filter metrics by name or keywords
- Column Sorting: Click on any column header to sort metrics by that attribute
- Time Range Selection: Adjust the time window (shown as "Last 30 minutes" in the top right)
- Pagination: Navigate through large metric lists using the pagination controls at the bottom
Exploring Individual Metrics
When you click on a specific metric, the interface displays information in three distinct sections:
1. Basic Information Section
The top section displays essential metric details:
- SAMPLES: Shows the volume of data points (e.g., "40.8M+")
- TIME SERIES: Displays total and active time series count (e.g., "531 total — 466 active")
- LAST RECEIVED: Timestamp of the most recent data ingestion
2. Metadata Section
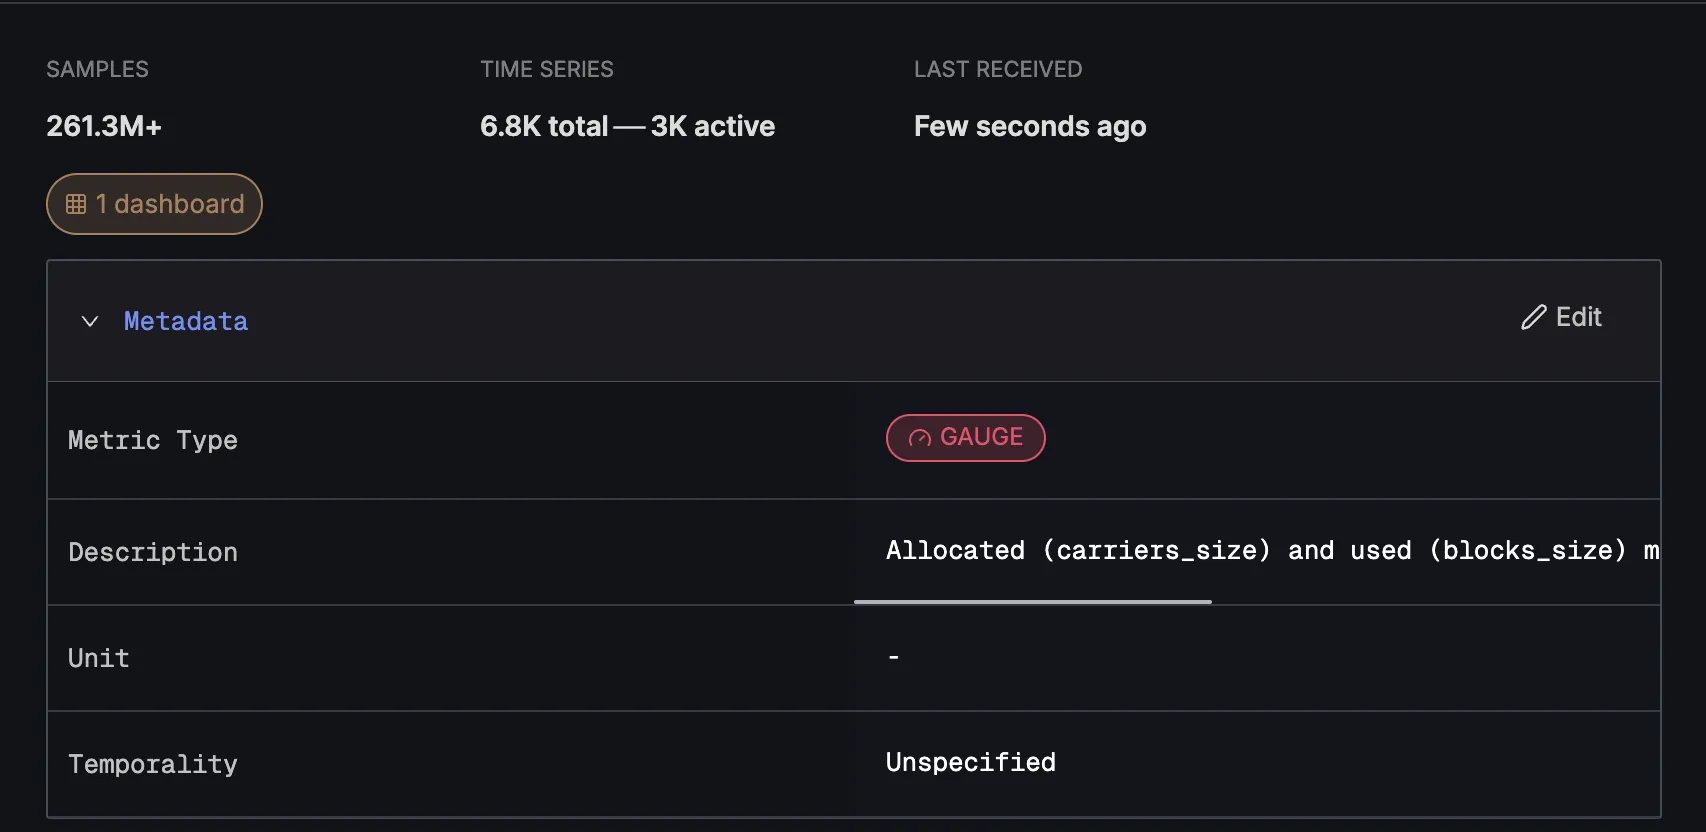
Detailed metadata section showing comprehensive metric information
The Metadata section provides configurable information about the metric:
- Metric Type: Displayed as a colored badge (e.g., "GAUGE")
- Description: Human-readable description of the metric's purpose (editable)
- Unit: Measurement unit specification (e.g.,
{pod}) - Temporality: Specification of how the metric data is aggregated
If you feel the Metric Type, description, or temporality is incorrect, you can edit them using the edit button.
3. All Attributes Section
The "All Attributes" section displays the dimensional structure of the metric:
- Unique Identifiers: Shows the specific attribute values associated with the metric
- Search Functionality: Allows filtering through attribute values
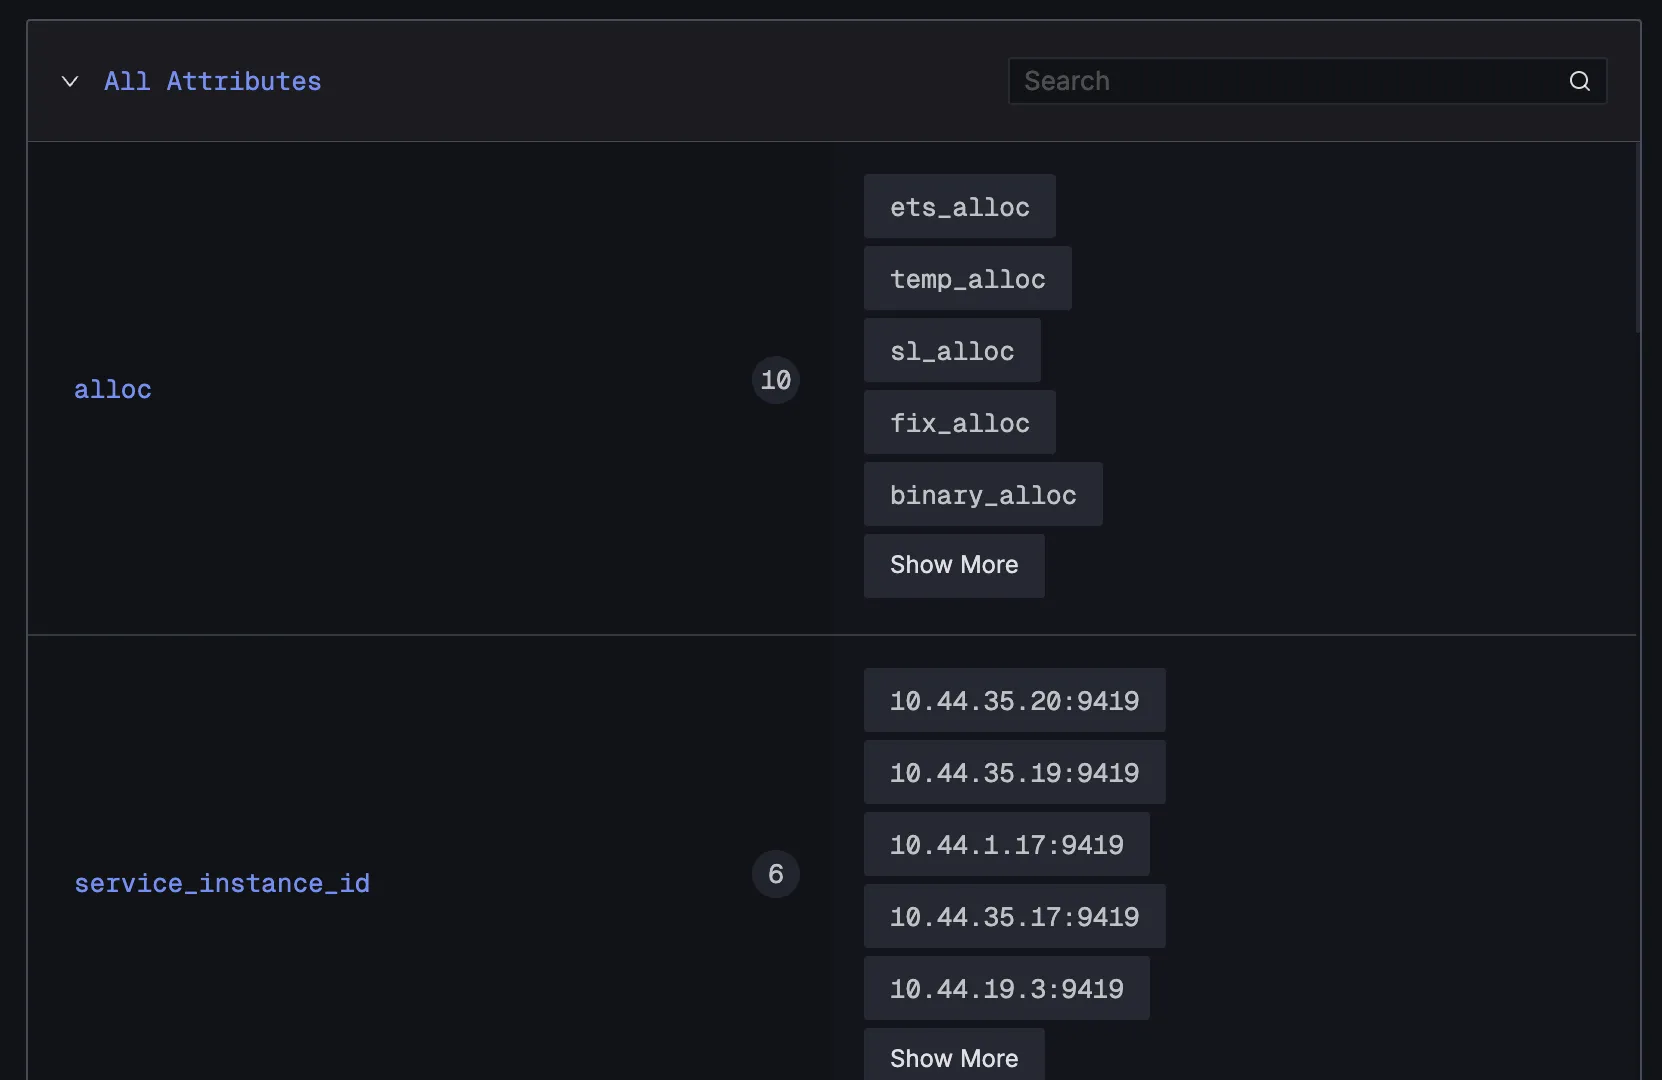
Detailed metadata view showing comprehensive metric information
Explorer Interface
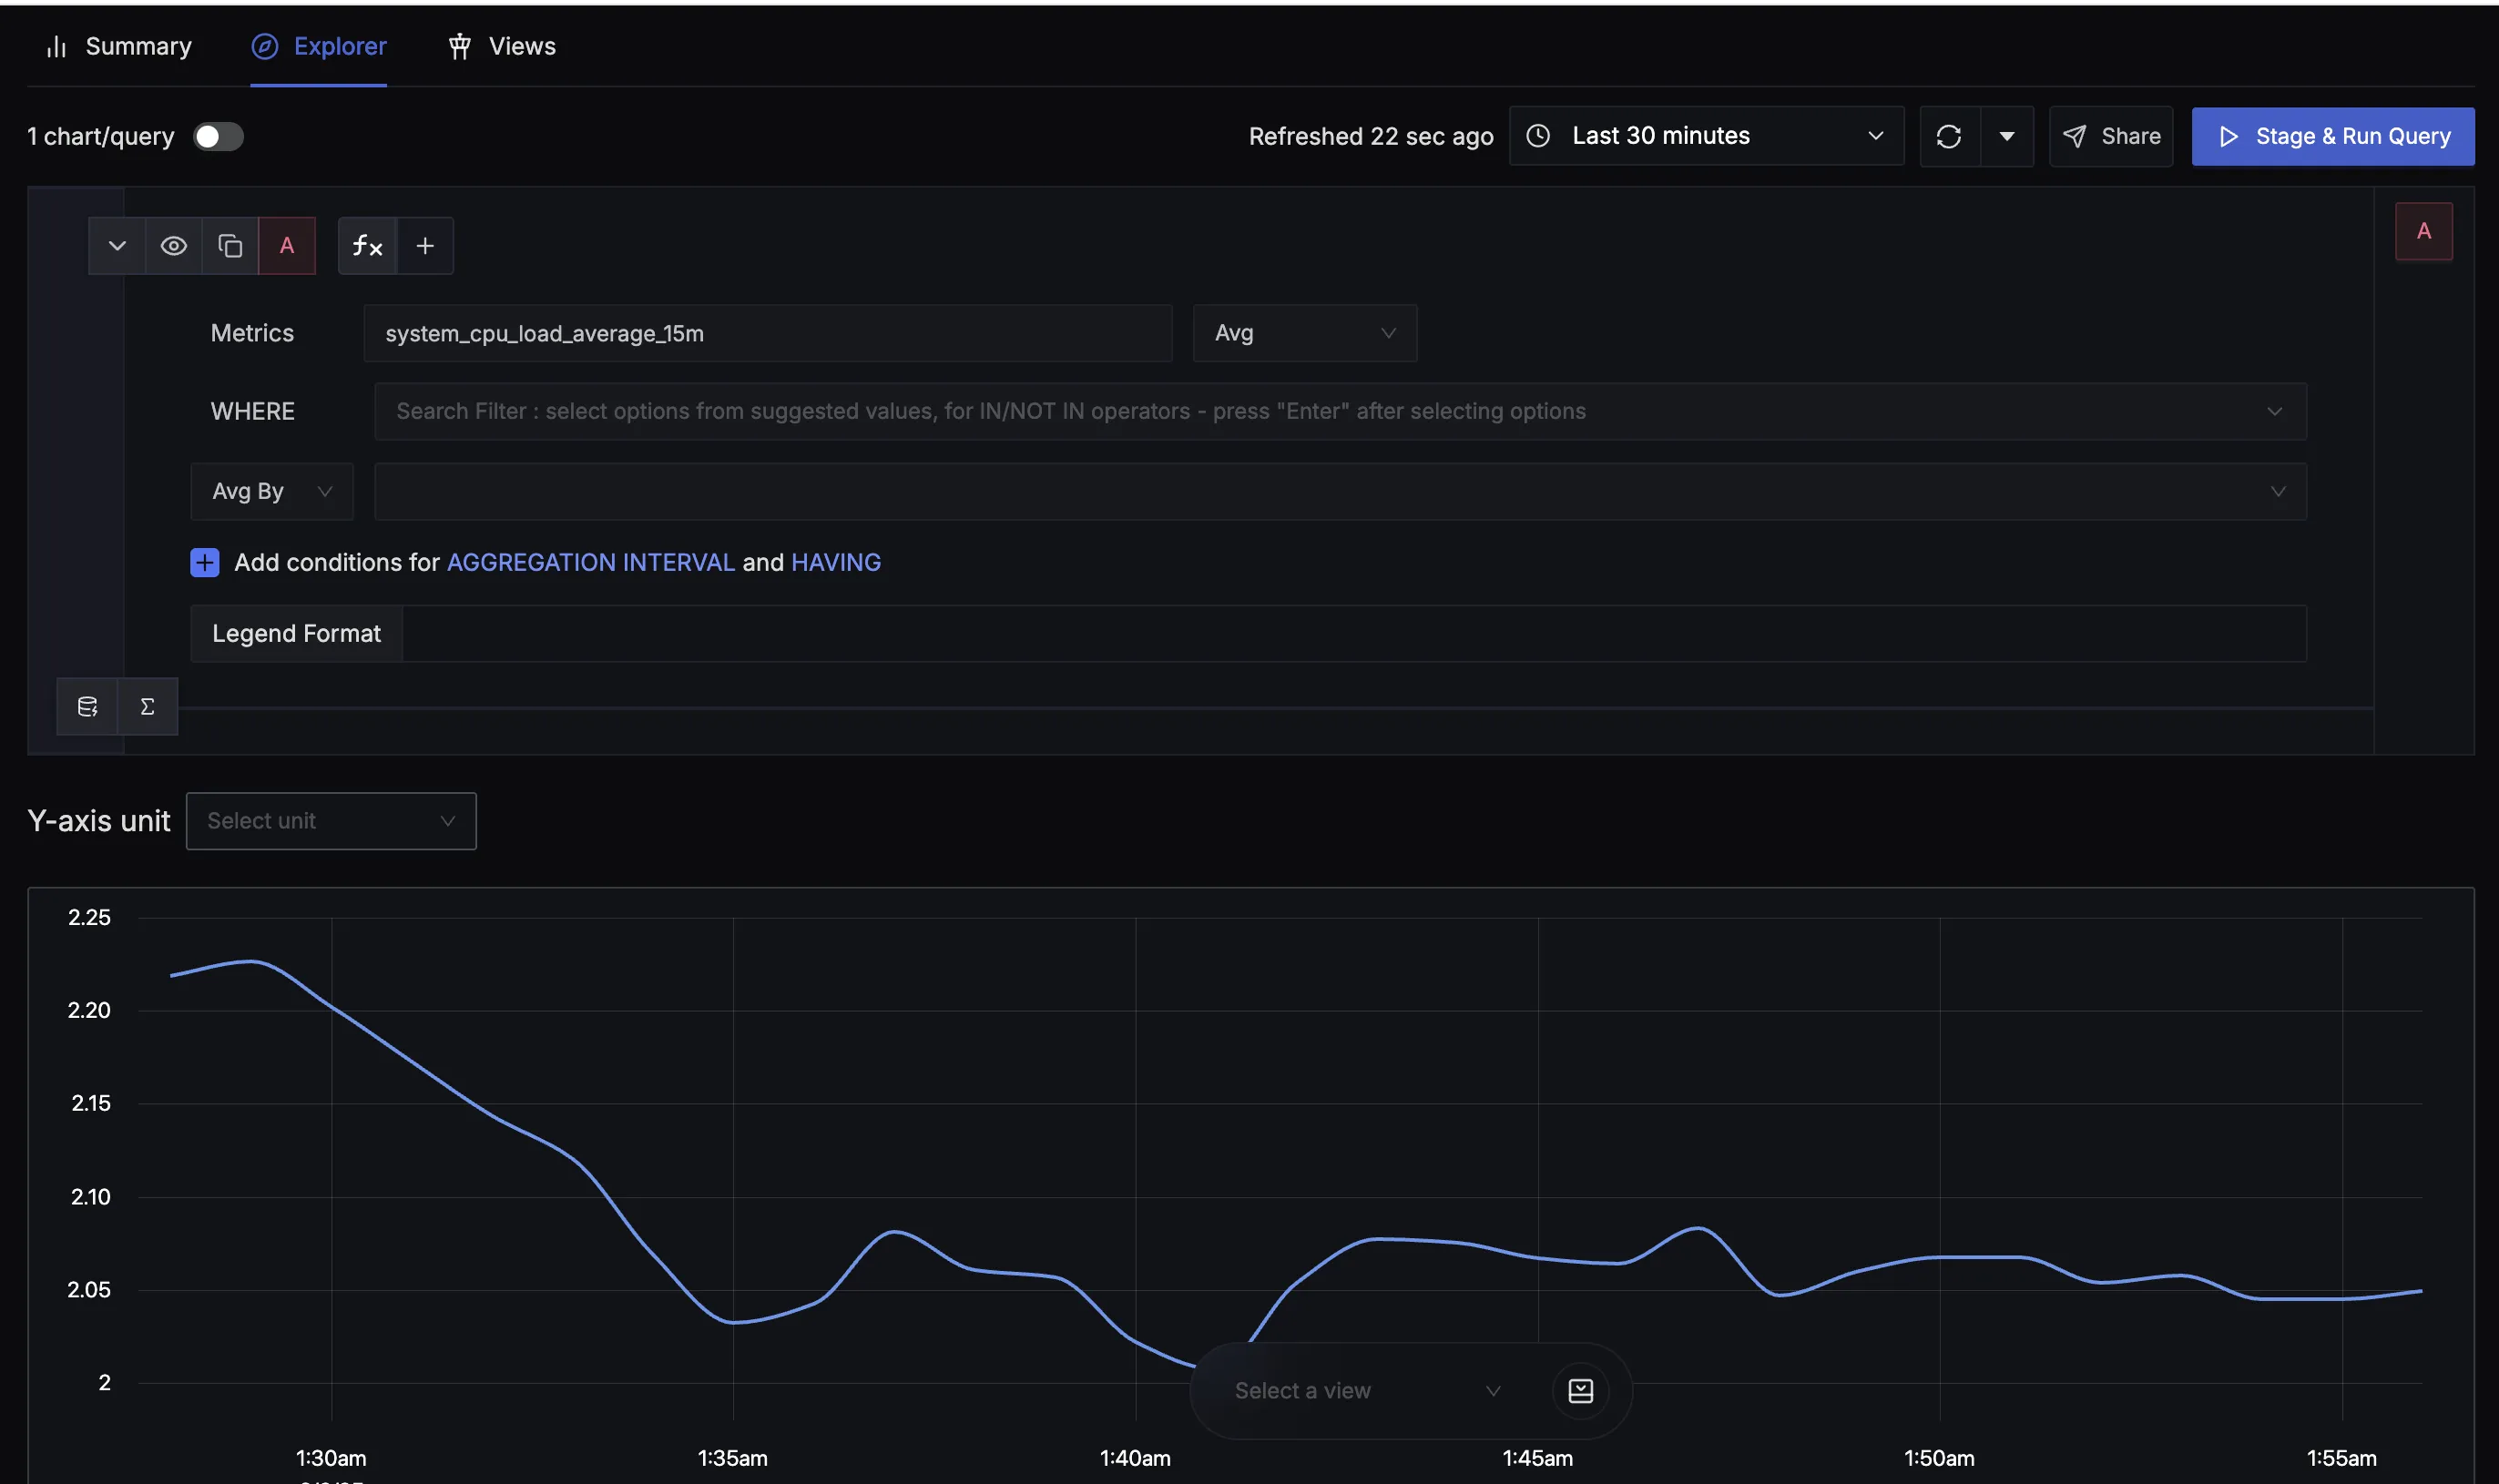
Explorer interface showing query building and visualisation capabilities
The Explorer tab provides an interactive query building environment:
Query Configuration:
- Metrics Selection: Choose metrics from a dropdown with autocompletion
- WHERE Clause: Add filters using the search interface for attribute-based filtering
- Sum By: Group results by specific attributes or dimensions
- Aggregation Controls: Set conditions for time-based aggregation and filters
- Legend Format: Customise how the query results are displayed
Visualization Options:
- Y-axis Unit Selection: Choose appropriate units for the visualization
- Time Range Control: Adjust the query time window
- Chart Rendering: View results in various chart formats
- Real-time Updates: Get live updates as new data arrives
Action Buttons:
- Stage & Run Query: Execute the configured query
- Save this view: Preserve query configurations for reuse
- Create an Alert: Set up monitoring alerts based on the query
- Add to Dashboard: Include the visualization in existing dashboards
Saved Views in Metrics Explorer
Similar to the Saved Views feature available in Logs and Traces Explorer, Metrics Explorer also supports saving your query configurations for quick access later.
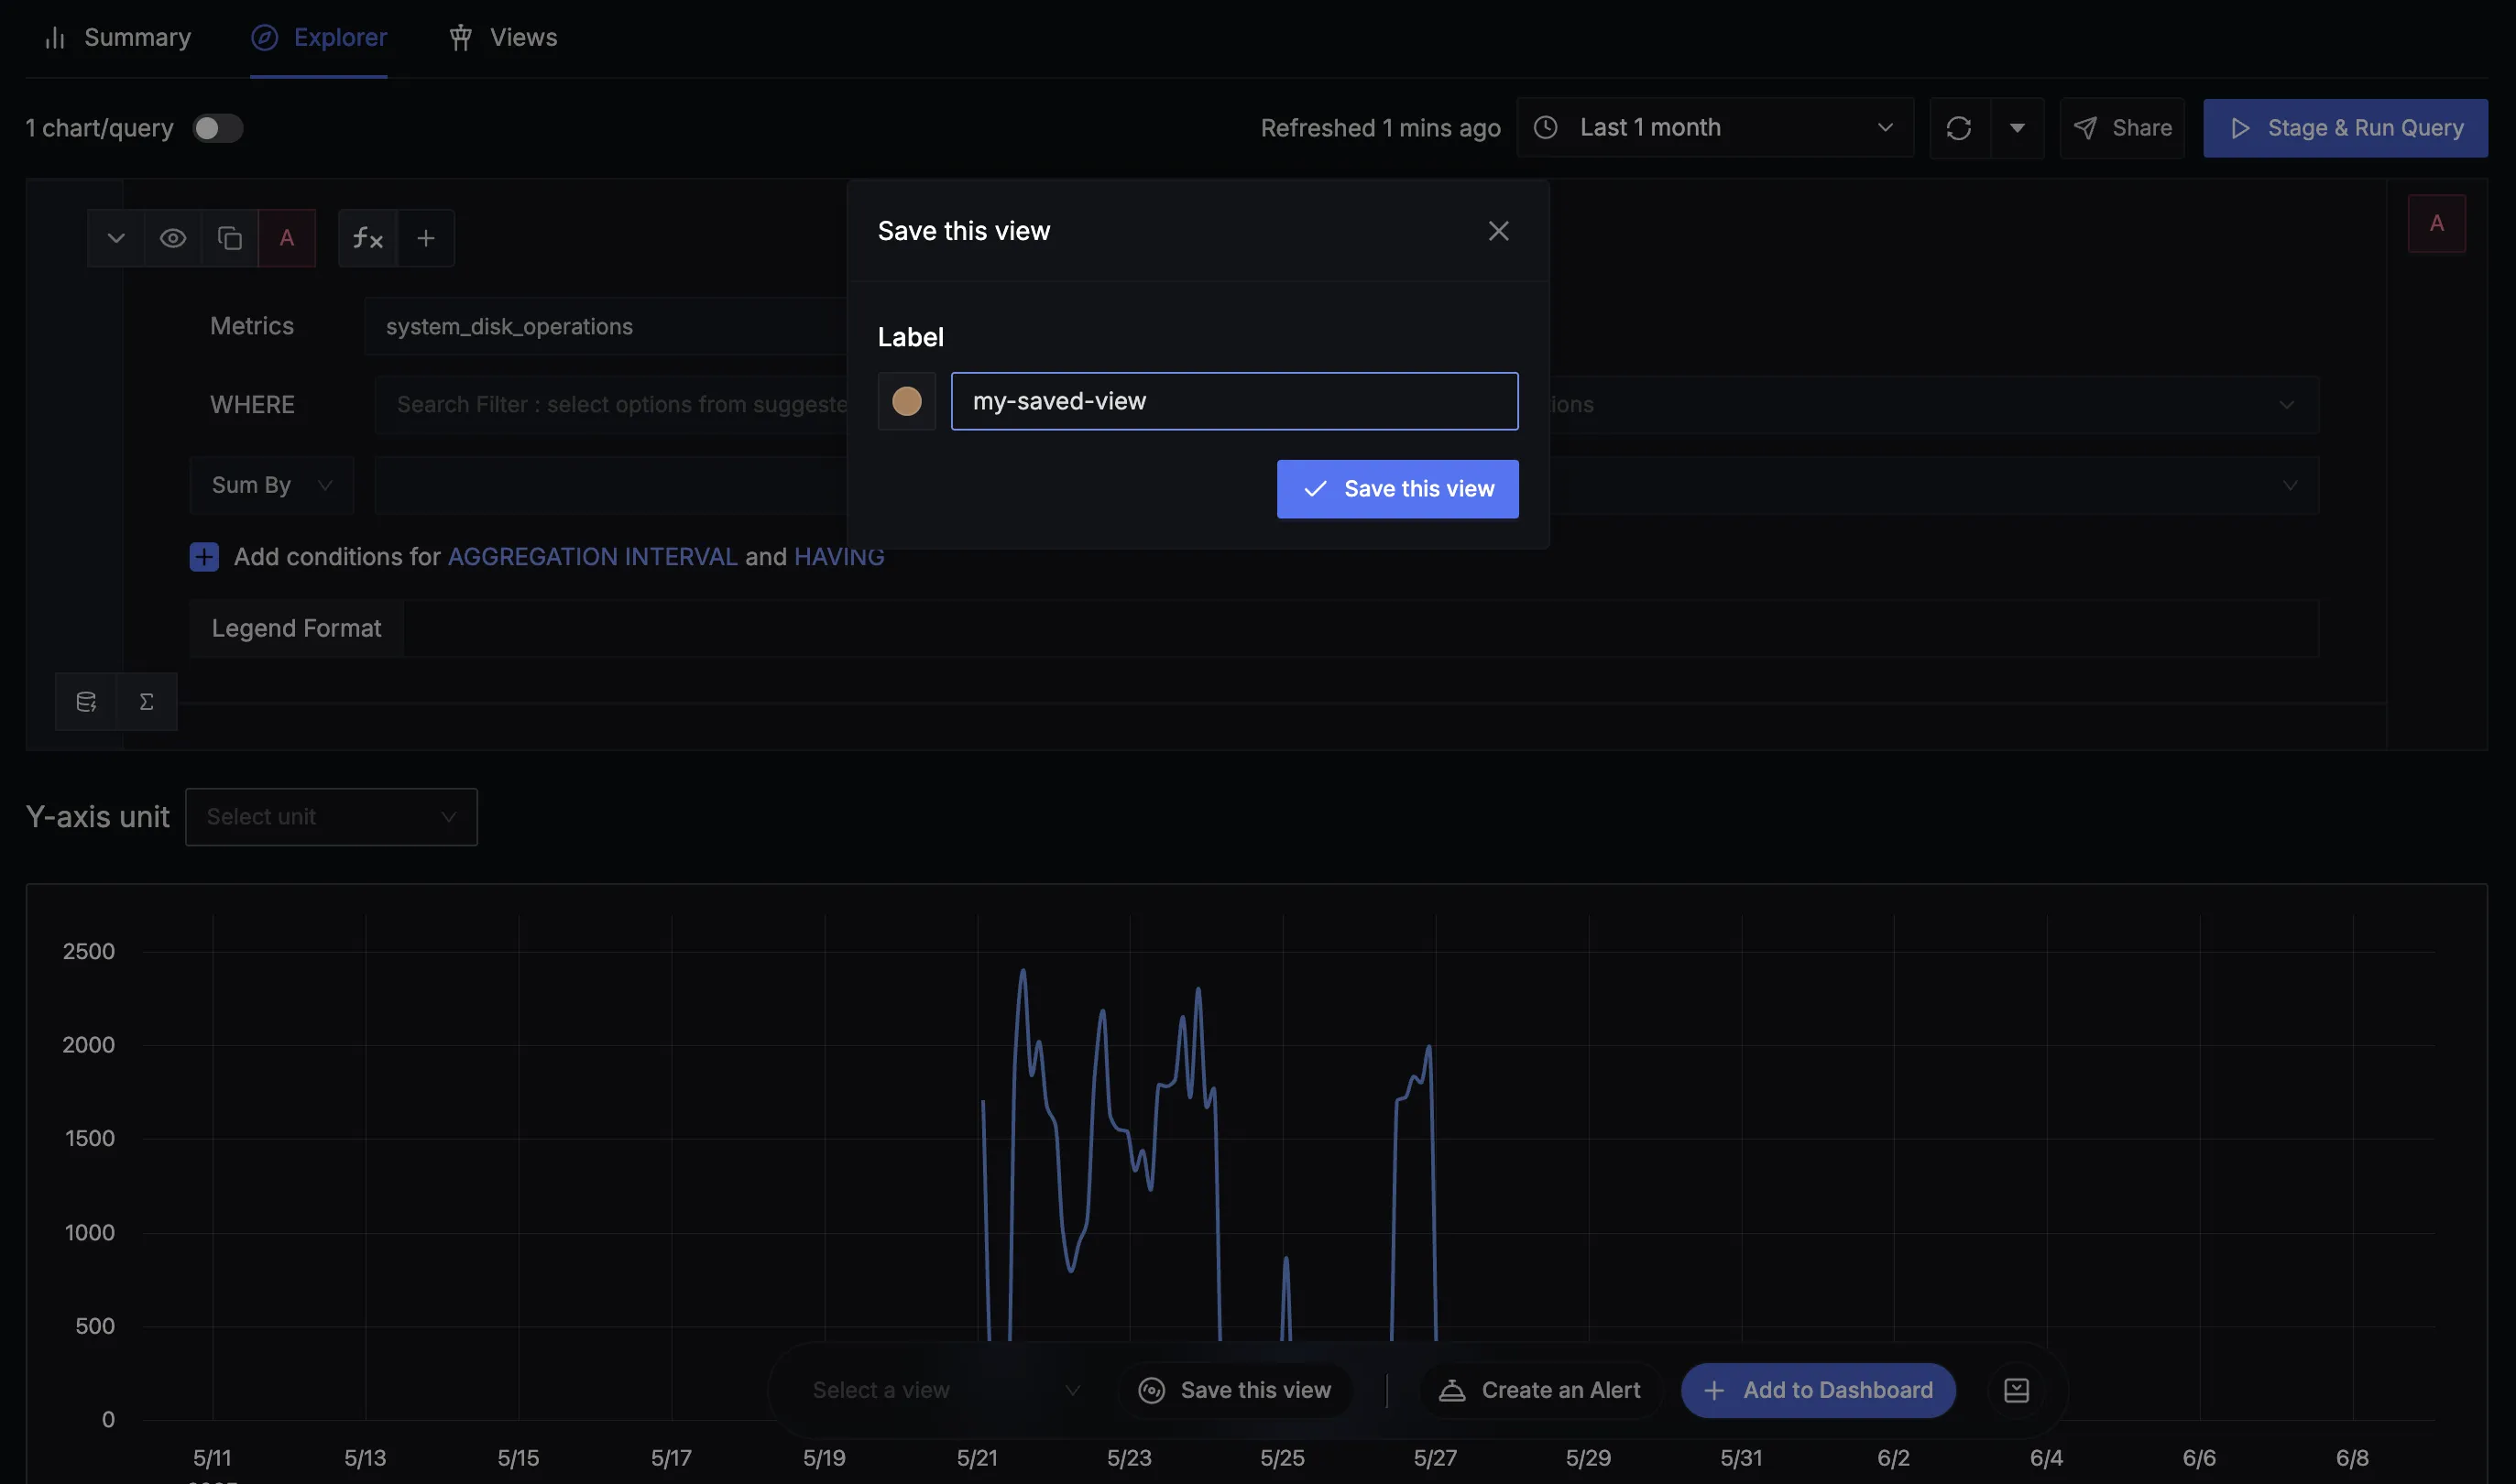
Saved View in Metrics Explorer
How to Use Saved Views
Saving a View:
- Configure your metric query with desired filters and parameters in the Explorer interface
- Click the "Save this view" button
- Enter a descriptive label for easy identification
- Confirm to save your view - a pop-up will confirm successful saving
Accessing Saved Views:
- Use the dropdown at the bottom of the Explorer interface
- Select any saved view to instantly apply the preset configuration
- Views are preserved across sessions for quick access
Managing Views:
- Update: Modify an existing view and click "Update this View" when changes are made
- Rename: Edit view labels in the Views tab
- Delete: Remove unused views from the Views tab
Use Cases for Saved Views
- Performance Monitoring: Save views for key metrics you check regularly during daily operations
- Incident Response: Quick access to critical metrics during outages and troubleshooting sessions
- Team Collaboration: Share common metric views across team members for consistent monitoring
- Cost Analysis: Monitor high-cardinality or high-volume metrics to optimise observability costs
- Routine Health Checks: Create daily dashboard-style views without rebuilding filters each time
