Overview
Grafana, KEDA, Headlamp, Ray, OpenCost, Argo Rollouts, and the Kubernetes autoscalers (HPA, VPA) all want a Prometheus server URL. Once your metrics are in SigNoz, that URL is often the only reason a Prometheus server is still running.
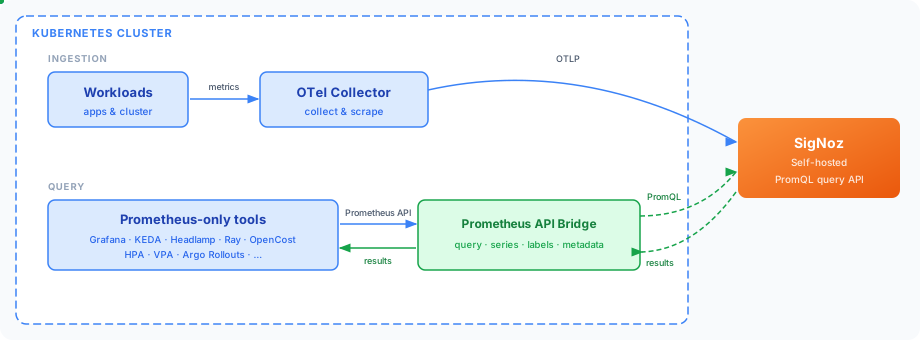
Prometheus API Bridge is an open source, stateless service that answers those tools from SigNoz instead.
Architecture
KEDA, the Kubernetes autoscalers, and the other tools this guide covers all speak the same Prometheus HTTP API. They run PromQL queries, list metric and label names for autocomplete, and look up series to map metrics onto Kubernetes resources. Of that API, SigNoz serves only two query endpoints, /api/v1/query and /api/v1/query_range, which is not enough for these tools to work. The bridge implements the rest on top of them, forwards PromQL unchanged, and authenticates to SigNoz with your API key so clients only need a standard bearer token.
Prerequisites
- An instance of SigNoz (either Cloud or Self-Hosted) reachable from the Kubernetes cluster where the bridge will run.
- A service account API key for SigNoz with the
SigNoz-Viewerrole, which grants read-only access. - Helm 3.8 or newer, required for OCI chart support.
Tested with Prometheus API Bridge v0.2.0 against SigNoz Cloud and self-hosted SigNoz v0.141.1.
Install the Bridge
Step 1: Create the Namespace and Secrets
The bridge reads two credentials from Kubernetes Secrets. The chart never creates them, and the pods stay in CreateContainerConfigError until both exist. This guide uses the observability namespace throughout.
Set both values in your shell first. The bridge rejects an empty Secret at startup, so a variable that is not set here produces a crash loop later instead of an authentication error.
export SIGNOZ_API_KEY="<your-signoz-api-key>"
export BRIDGE_BEARER_TOKEN="$(openssl rand -hex 32)"
Verify these values:
<your-signoz-api-key>: The service account API key from the prerequisites.BRIDGE_BEARER_TOKEN: A new random token that Prometheus clients send to the bridge. It is unrelated to your SigNoz key.
Now create the namespace and the two Secrets:
kubectl create namespace observability
kubectl -n observability create secret generic prometheus-api-bridge-signoz \
  --from-literal=api-key="$SIGNOZ_API_KEY"
kubectl -n observability create secret generic prometheus-api-bridge-auth \
  --from-literal=token="$BRIDGE_BEARER_TOKEN"
Step 2: Install the Chart
backend:
  type: signoz
  signoz:
    url: <signoz-url>
    apiKeySecret:
      name: prometheus-api-bridge-signoz
      key: api-key
server:
  auth:
    bearerTokenSecret:
      name: prometheus-api-bridge-auth
key: tokenhelm upgrade --install prometheus-api-bridge \
oci://ghcr.io/simonepri/charts/prometheus-api-bridge \
--version <bridge-version> \
--namespace observability \
--values values.yamlVerify these values:
<signoz-url>: The base URL of your SigNoz instance. On Cloud this ishttps://<tenant>.<region>.signoz.cloud. On self-hosted it is your own address, such ashttps://signoz.example.com, or the in-cluster query service URL.<bridge-version>: The latest version on the project releases page.
The chart requires a bearer token by default and only allows a ClusterIP Service. Ingress, TLS, unauthenticated mode, and NetworkPolicy options are covered in the chart values reference.
Validate
Forward the Service port to your machine. This command holds the terminal open, so leave it running:
kubectl -n observability port-forward service/prometheus-api-bridge 9090:9090The second terminal does not inherit the variables that you exported in the first one. Read the token back from the Secret, then ask the bridge which labels SigNoz reports for one metric that you already collect:
export BRIDGE_BEARER_TOKEN=$(kubectl -n observability get secret prometheus-api-bridge-auth \
  -o jsonpath='{.data.token}' | base64 -d)

curl -sSG --fail-with-body http://localhost:9090/api/v1/labels \
  --data-urlencode 'match[]={__name__="<metric-name>"}' \
  --header "Authorization: Bearer $BRIDGE_BEARER_TOKEN"
Verify these values:
<metric-name>: A low-cardinality metric that is already in SigNoz, for examplek8s.pod.memory.usage. Find one under Metrics in the SigNoz UI.
SigNoz metric names contain dots, and PromQL does not accept a dot in a bare metric selector. Always wrap the name as {__name__="..."}. A bare k8s.pod.memory.usage fails with backend query failed.
One metric can still be too large on its own. Add label matchers to narrow it, and quote any label name that contains dots:
--data-urlencode 'match[]={__name__="k8s.pod.memory.usage","k8s.namespace.name"="<namespace>"}'A list of label names means the bridge accepted the token and SigNoz answered. An empty data array means the bridge is reachable but SigNoz holds no data for that metric, so make sure that metrics are arriving before you connect any tools.
Tools in the cluster can now use this URL wherever they expect a Prometheus server:
http://prometheus-api-bridge.observability.svc:9090Connect Your Tools
Give each tool that URL wherever it expects a Prometheus server, like KEDA's serverAddress or the Prometheus Adapter's prometheus.url. A few tools need more than a URL. The project's verified integrations table is the up-to-date list of tested tools, and each entry links the exact Helm values and manifests it is tested with.
The bridge returns metrics under the names that SigNoz stores, and those names depend on how you collect them. OpenTelemetry receivers store dotted names such as k8s.pod.memory.usage. A Prometheus scrape stores underscore names such as up.
Prometheus-only tools ask for the canonical Prometheus names, such as container_cpu_usage_seconds_total, kube_pod_status_phase, and node_cpu_seconds_total. An OpenTelemetry-native pipeline does not produce those names. The tool then gets an empty result while the bridge and your ingestion are both healthy.
To add the Prometheus-named copies, turn on the chart's collection settings. They scrape cAdvisor, the kubelet, and kube-state-metrics. Every source is off by default, so enable the ones you need with collection.sources.cadvisor.enabled, collection.sources.kubelet.enabled, and collection.sources.kubeStateMetrics.enabled.
The chart refuses to render when a required value is missing. Set these before you enable any source:
clusterName: Required whenever collection is on. The chart attaches it to every collected metric.collection.sources.kubeStateMetrics.target: Required when you enable kube-state-metrics and leave the bundled dependency off. Setkube-state-metrics.enabled=trueinstead to install it with the chart.
Set collection.mode to standalone to install a dedicated Collector. Set it to existing to extend a Collector that you already run.
In existing mode, also set collection.existing.serviceAccount.name and collection.existing.serviceAccount.namespace to the ServiceAccount of that Collector. The chart then renders a configuration fragment into the ConfigMap prometheus-api-bridge-collector, under the key collector.yaml. Three more steps are yours:
- Mount that key into your Collector and load it with
--config=file:/etc/prometheus-api-bridge/collector.yaml. - Make sure that your Collector distribution includes the Prometheus receiver.
- Make sure that the exporter named by
collection.existing.exporteralready exists in your Collector, and that its endpoint and authentication are configured.
The project's existing-Collector fixture shows a working example.
In standalone mode the chart owns the Collector, so it also owns the export. The default endpoint is a self-hosted in-cluster address with TLS disabled and no authentication. On SigNoz Cloud, point it at your ingestion endpoint and attach the ingestion key:
collection:
  mode: standalone
  otlp:
    endpoint: "https://ingest.<region>.signoz.cloud:443"
    insecure: false
    secretHeaders:
      - name: signoz-ingestion-key
        secretKeyRef:
          name: signoz-ingestion
          key: ingestion-key
Verify these values:
<region>: Your SigNoz Cloud region.signoz-ingestion: A Secret that you create, holding your ingestion key under the keyingestion-key.
Troubleshooting
Each heading below starts from what you see.
Pods stay in CreateContainerConfigError
One of the two Secrets does not exist. The chart never creates them.
Check which one is missing, then create it as shown in Step 1:
kubectl -n observability get secret prometheus-api-bridge-signoz prometheus-api-bridge-authThe pod restarts with "BRIDGE_BEARER_TOKEN must not be empty when configured"
The Secret exists but holds an empty string. This happens when you run the kubectl create secret commands before you export the variables.
The bridge rejects an empty credential at startup, so you get a crash loop and never reach a request. Delete both Secrets, export both values, then create them again.
Requests return 401 "missing or invalid bearer token"
The token you sent does not match the one in the Secret. A second terminal does not inherit a variable that you exported in the first one.
Read the token back from the Secret before you send the request:
export BRIDGE_BEARER_TOKEN=$(kubectl -n observability get secret prometheus-api-bridge-auth \
  -o jsonpath='{.data.token}' | base64 -d)
A tool that cannot send an Authorization header needs the unauthenticated setup described under Connect Your Tools.
Requests return 422 "query result exceeds configured limits"
The discovery request matched too many series. The bridge answers discovery with a range query over the last hour at a 15-second step, so it reads 241 samples for each matched series, against a default maxSamples limit of 100000. Any request above about 415 active series fails, even when your credentials and your ingestion are healthy.
Without match[] the request matches every metric, so it fails on all but the smallest installations. A single high-cardinality metric crosses the limit on its own. Add label matchers until the request stays under it. A shorter time range does not help, because the step scales with the range.
Requests return 502 "backend query failed"
The bridge reached SigNoz, and SigNoz refused the query. The bridge reports every backend failure with this one message, so check both causes.
- The selector is not valid PromQL. A bare dotted metric name fails. Write
{__name__="k8s.pod.memory.usage"}, and quote any label name that contains dots. - The SigNoz API key is rejected. A revoked or rotated key also produces this message rather than an authentication error. Confirm the key directly:
curl -sS -H "SIGNOZ-API-KEY: $SIGNOZ_API_KEY" "<signoz-url>/api/v1/service_accounts/me"SigNoz returns 403 "only viewers/editors/admins can access this resource"
The key is valid, but the service account has no role. A new service account starts with serviceAccountRoles set to null.
Open Settings > Service Accounts, select the account, and assign the SigNoz-Viewer role in the Overview tab. The existing key picks up the role, so you do not need a new one.
Helm refuses to render after you turn on collection
Collection adds required values. The chart rejects the release instead of installing a partial configuration.
clusterNameis required in both collection modes.collection.existing.serviceAccount.nameandcollection.existing.serviceAccount.namespaceare required inexistingmode.collection.sources.kubeStateMetrics.targetis required when you enable kube-state-metrics and leavekube-state-metrics.enabled=false.
Render the chart locally to see which value is missing, without touching the cluster:
helm template prometheus-api-bridge \
  oci://ghcr.io/simonepri/charts/prometheus-api-bridge \
  --version <bridge-version> --values values.yaml
A tool connects but every query comes back empty
The metric names do not match. Prometheus-only tools ask for names such as container_cpu_usage_seconds_total, and an OpenTelemetry pipeline stores k8s.pod.cpu.usage instead.
Confirm what SigNoz actually holds, then either point the tool at those names or turn on the chart's collection settings to add the Prometheus-named copies. See Connect Your Tools.
Next Steps
- Moving off Prometheus or Grafana? Migrate your metrics first, then point your tools at the bridge.
- Building your own integration? Query SigNoz directly with the Metrics API.
- Supported endpoints, every chart value, and the tested SigNoz version live in the project repository.
Get Help
If you need help with the steps in this topic, please reach out to us on SigNoz Community Slack. If you are a SigNoz Cloud user, please use in product chat support located at the bottom right corner of your SigNoz instance or contact us at cloud-support@signoz.io.


