When you navigate from traces to logs and see "No logs found for this trace," it means your logs and traces are not properly correlated. This guide will help you establish the connection.
Automatic Correlation with OpenTelemetry SDK
If you're using OpenTelemetry SDKs for instrumentation, they automatically inject trace context (trace_id and span_id) into your logs. Simply enable the logging instrumentation for your language and your existing logs will include trace correlation.
Auto-instrumentation is available for these languages - Java, .NET, Python, Go, Node.js, and PHP. Check out our instrumentation documentation for auto-instrumenting your application.
This is the recommended approach as it requires minimal configuration and provides consistent trace context across all your logs.
Manual Correlation for File-based and Kubernetes Logs
If your logs contain trace information but it's not in the standard OpenTelemetry format, you need to use SigNoz log pipelines to extract it.
This applies when:
- Your application logs to files that are read by log collectors
- You're using Kubernetes and logs are collected by agents like FluentBit or FluentD
- Your logs contain trace IDs and span IDs in the message body or custom attributes
Setting Up Log Pipelines
Follow our detailed guide on parsing trace information from logs:
Parse Trace Information for your Logs
This guide shows you how to:
- Create a log pipeline in SigNoz
- Use the Trace Parser processor to extract trace_id and span_id
- Configure regex or JSON parsers if needed
- Test and deploy your pipeline
Verification
After setting up log-trace correlation:
- Generate some traffic in your application
- Go to the Traces section in SigNoz
- Click on a trace to view its details
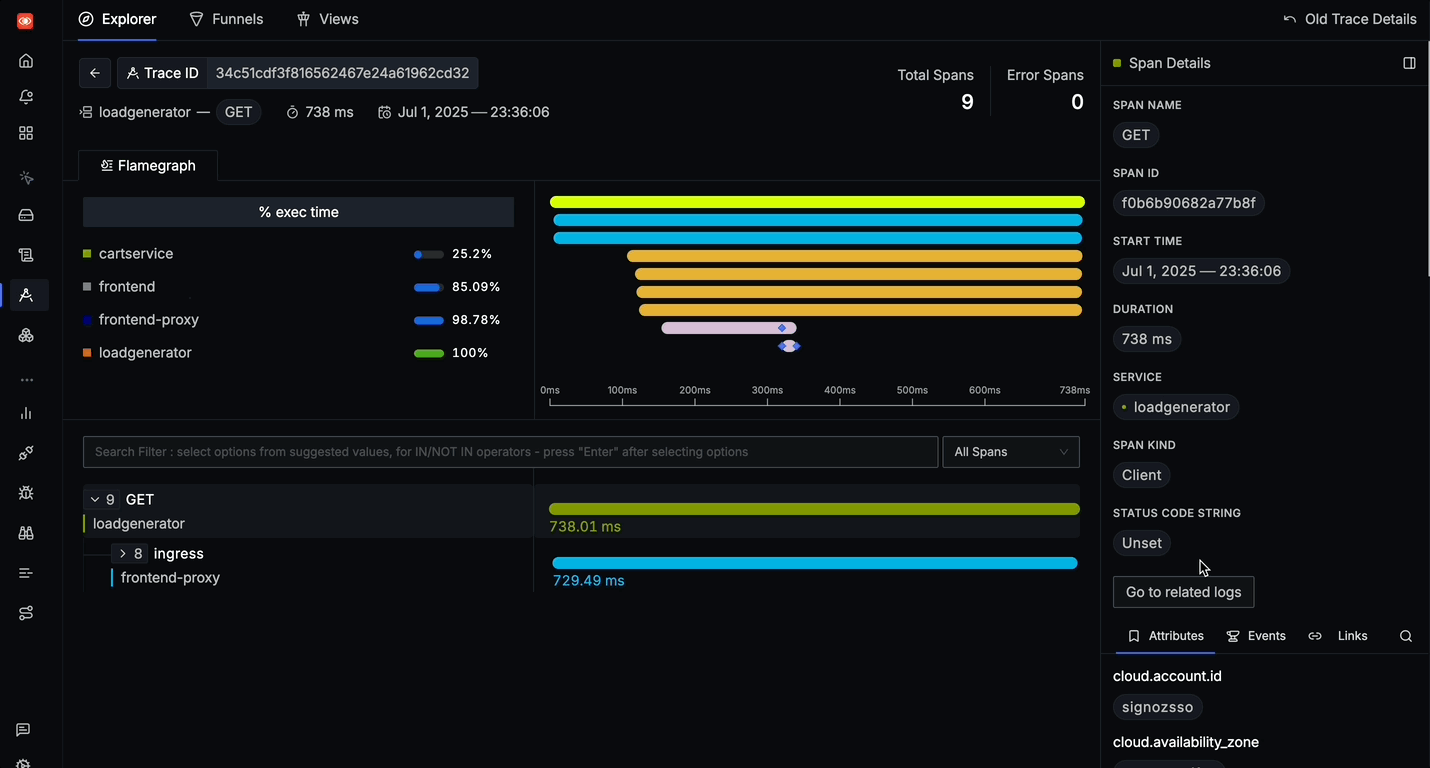
- Click "Go to related logs" button which will take you to the related logs
- In the Logs section, you should see
trace_idandspan_idfields populated
Best Practices
- Use OpenTelemetry SDKs when possible for automatic correlation
- Use structured logging (JSON format) for easier parsing
- Include relevant context like user IDs, request IDs, and other identifiers in your logs
- Ensure consistent trace propagation across all services in your application
