Q. Why are some spans missing from a trace?
A. A span is missing when its parent span was not collected — it exists in your system but never reached SigNoz.
Show detailed explanation
Common causes:
- Tail sampling — if you have configured tail sampling in your OpenTelemetry Collector pipeline, the sampler randomly selects a subset of spans to keep and drops the rest. Some spans may be retained while others are discarded, resulting in incomplete traces.
- Network issues — spans may be dropped in transit due to connectivity failures, timeouts, or packet loss between your app and the Collector, or between the Collector and SigNoz.
- Misconfigured services — if a service is not exporting its spans, its span ID will appear as an unresolved parent in downstream spans.

Every span has two key identifiers: a Span ID (its own unique ID) and a Parent Span ID (the ID of the span that called it). When a service makes a call to a downstream service, it propagates context via the traceparent header. This header carries the current span's Span ID, which the downstream service uses as the Parent Span ID of the new span it creates. A span is flagged as "missing" when no span in the collected trace matches its Parent Span ID — the parent span exists but was never collected.
The root span is the first span in a trace — it does not have a Parent Span ID because no upstream service initiated it.
Learn more about how traces work in OpenTelemetry.
Example: Consider three services — Frontend, Auth, and Database:
Frontendcreates the root span (Span ID:abc1, Parent ID: none).FrontendcallsAuth, passing its Span IDabc1in thetraceparentheader.Authcreates a new span (Span ID:def2, Parent ID:abc1).AuthcallsDatabase, passing its Span IDdef2.Databasecreates a new span (Span ID:ghi3, Parent ID:def2).
If Auth fails to export its span (Span ID: def2), the Database span will reference a Parent Span ID (def2) that does not exist in the collected trace — resulting in a missing span.
Q. What causes gaps between consecutive spans?
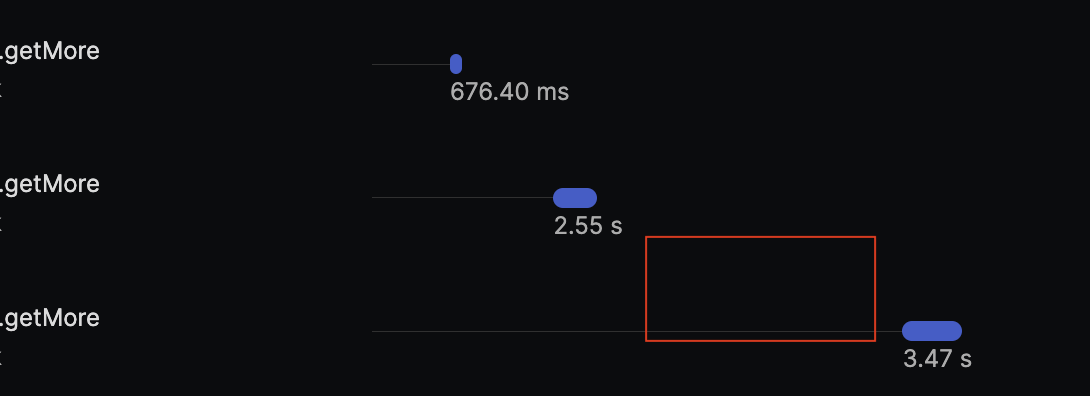
A. Span gaps occur when code runs between two instrumented operations but is not itself traced.
Show detailed explanation
OpenTelemetry auto-instrumentation does not trace custom functions or methods by default. If there is uninstrumented code between two spans, a gap will appear in the waterfall view.
To fix span gaps, add manual instrumentation to the code paths you want to trace.
Q. Why does the trace duration differ from what I see in the spans list?
A. The duration column in the traces list shows the root span duration, not the entire trace duration.
Show detailed explanation
Discrepancies occur because:
- The root span may complete before all child spans finish (e.g., the handler returns while background tasks continue).
- Asynchronous operations can outlast the root span.
- The trace details view shows the full duration from first span start to last span end.
Example scenario:
You might see a trace listed as 38.9 seconds in the traces page, but when you open the trace details, it shows a total duration of 1 minute. This happens when:
- The root span (the initial request handler) completed in 38.9 seconds.
- Other spans in the trace (such as background jobs, async tasks, or queued operations) continued running.
- The total time from the first span start to the last span end was 1 minute.
This behavior is expected and reflects how distributed systems actually work. If you need to measure specific service-to-service latencies rather than root span duration, see the ClickHouse traces query guide for guidance on using kind_string = 'Client' filters.
Q. I can't see related logs for traces.
A. Make sure your logs include trace_id and span_id.
Show detailed steps
- If you are collecting application logs from file, ensure you emit the
trace_idandspan_idto those logs. - Once you have
trace_idandspan_idin your logs, parse them using the pipelines trace parser. See documentation here.
Q. Why do my custom rate queries differ from the Services dashboard?
A. The Services dashboard only counts top-level (entry-point) operations, while direct queries on signoz_calls_total include all spans.
Show detailed explanation
Understanding the difference
The rate table under Services only considers top-level operations, which is why there's a discrepancy between what you see in the Services dashboard and what you get when querying signoz_calls_total directly with Rate and Sum functions.
When you query signoz_calls_total in the Metrics section, you're getting data from all operations, including nested or child operations. However, the Services dashboard filters this data to show only top-level operations, resulting in different (typically lower) values.
Getting accurate Service-level metrics
To recreate the same metrics you see in the Services dashboard, you'll need to use queries that filter for top-level operations only.
For reference queries and examples, you can import the official APM Metrics dashboard template from the SigNoz documentation. This will provide you with the proper query structure to match the Services dashboard calculations.
For more information about how APM metrics are generated from span data, see Guide to APM metrics.


