OpenTelemetry Operator is a Kubernetes Operator that helps manage OpenTelemetry components within a Kubernetes cluster. It streamlines deployment, configuration, and management of the OpenTelemetry Collector and Auto-Instrumentation, allowing you to efficiently collect and export telemetry data.
Benefits of using the OpenTelemetry Operator:
- Simplified Deployment: Automates the deployment and scaling of the OpenTelemetry Collector.
- Centralized Configuration: Manages Collector configurations through Custom Resources (CRs).
- Automated Lifecycle Management: Handles updates, rollbacks, and health checks of the Collector.
- Auto-Instrumentation: Supports Auto-Instrumentation of the workloads using OpenTelemetry instrumentation libraries
Architecture
The OpenTelemetry Operator follows a Kubernetes-native approach by leveraging Custom Resources and Controllers. Here's a breakdown of its architecture:
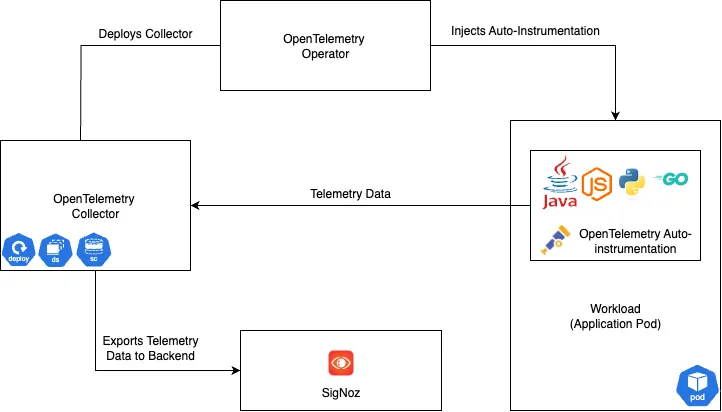
- Custom Resources (CRs): The operator defines Custom Resource Definitions (CRDs) for managing OpenTelemetry components, such as
OpenTelemetryCollector. These CRs allow you to declare the desired state of your telemetry collection infrastructure. - Controller: The operator's controller watches for changes in these Custom Resources. When a change is detected, it reconciles the current state of the cluster with the desired state defined in the CRs.
- OpenTelemetry Collector: The controller manages the deployment and configuration of the OpenTelemetry Collector instances based on the information provided in the
OpenTelemetryCollectorCRs. - Auto-instrumentation: The operator can also manage auto-instrumentation for your applications, ensuring that telemetry data is automatically collected without manual code changes.
For a deeper dive into the architecture, you can explore the OpenTelemetry Operator GitHub repository.
Deployment Modes
The OpenTelemetry Operator supports four deployment modes through the OpenTelemetryCollector Custom Resource, which specifies how the collector should be installed in your Kubernetes cluster.
Sidecar
In this mode, the OpenTelemetry Operator injects a collector container as a sidecar into application pods. This enables localized telemetry collection and processing directly within the application's pod, reducing network hops and making data flow simpler for individual workloads.
DaemonSet
When deployed as a DaemonSet, the OpenTelemetry Collector runs as a separate pod on each node in your cluster, which makes it ideal for collecting infrastructure performance metrics, such as system metrics, local log collection, or network monitoring.
Deployment (Default Mode)
For greater control over the OpenTelemetry Collector and to create a standalone application, you'd choose Deployment. With Deployment, scaling up the Collector to monitor more targets is relatively easy, and you can roll back to an earlier version if anything unexpected happens. You can also pause the Collector and manage it just like any other application.
StatefulSet
One of the key advantages of sidecar mode is that it allows users to offload their telemetry data quickly and reliably from their applications. This Collector instance runs at the container level, creating no new pod, making it ideal for keeping your Kubernetes cluster clean and easy to manage. You can also use sidecar mode if you need to implement a different collection or export strategy, which suits this application perfectly.
Auto-instrumentation
The OpenTelemetry Operator greatly simplifies the process of auto-instrumenting your applications. By defining an OpenTelemetryAutoInstrumentation custom resource, you can automatically inject the OpenTelemetry SDK into your application's runtime. This eliminates the need for manual code modifications to enable tracing, metrics, and logs collection.
The operator can inject and configure OpenTelemetry auto-instrumentation libraries. Currently, Apache HTTPD, .NET, Go, Java, Nginx, Node.js and Python are supported.
To manage automatic instrumentation, the Operator must be configured to identify which pods to instrument and select the appropriate automatic instrumentation for those pods. This configuration is done through the Instrumentation CRD and adding Annotations to the workloads
K8s-Infra vs OpenTelemetry Operator
When deciding between SigNoz’s k8s-infra Helm chart and the OpenTelemetry Operator, the choice often comes down to setup simplicity versus flexibility.
Why and When k8s-infra
- Fast Setup: Install a single Helm chart, and it auto-collects metrics, logs, traces, and events.
- SigNoz-Ready: Pre-configured for SigNoz (dashboards, alerts, integrations work out of the box).
- Minimal Overhead: No need to write collector configs or manage multiple CRDs, use presets for telemetry collection.
Use k8s-infra when you want a quick, production-ready way to start sending Kubernetes telemetry to SigNoz without learning OTel collector internals. For more information, refer to the K8s-infra Collection Agent.
Why and When OpenTelemetry Operator
- Auto-Instrumentation: Supports injecting SDKs/agents for application-level telemetry.
- K8s-Native Management: Uses CRDs for lifecycle and configuration management.
Use the Operator when you require features like auto-instrumentation.
Recommended Approach
Begin with k8s-infra for cluster and infrastructure monitoring: it’s optimized for SigNoz and minimizes operational overhead. Gradually introduce the Operator for workloads that require auto-instrumentation.
