Auto Generated APM Metrics
SigNoz automatically generates the following APM/RED (Rate, Error, Duration) metrics from traces:
signoz_calls_total- Information on all calls to your services
- Used to calculate Request Rate and Error Rate for each service, operation, environment, etc.
signoz_latency_sum- Tracks the total sum of all latency values recorded
- Example: If three requests took 1s, 2s, and 3s, the sum would be 6s
signoz_latency_count- Tracks the number of latency measurements recorded
- Example: If 100 requests have been processed, this count would be 100
- Used in conjunction with
signoz_latency_sumto calculate average latency (average request duration) by dividingsignoz_latency_sumbysignoz_latency_count
signoz_latency_bucket- Tracks how many requests fall into specific latency ranges (buckets)
- Default buckets: [2ms, 4ms, 6ms, 8ms, 10ms, ... 15s]
- Counts requests with latency less than or equal to each bucket's value
- Helps understand how request latencies are distributed across various ranges
signoz_db_latency_sum- Represents the total sum of all latencies for database-related operations
- Helps track the total time spent on database operations
signoz_db_latency_count- Counts the number of database operations measured
- When combined with
signoz_db_latency_sum, allows calculation of average latency per database operation
signoz_external_call_latency_sum- Tracks the total sum of latencies for all external calls
- Helps track the total time spent waiting for external services
signoz_external_call_latency_count- Counts the number of external calls made
- Combined with
signoz_external_call_latency_sum, helps calculate the average latency of external calls
Common attributes across these metrics:
operationservice_namespan_kindhttp_status_codestatus_codedeployment_environmentservice_namespace
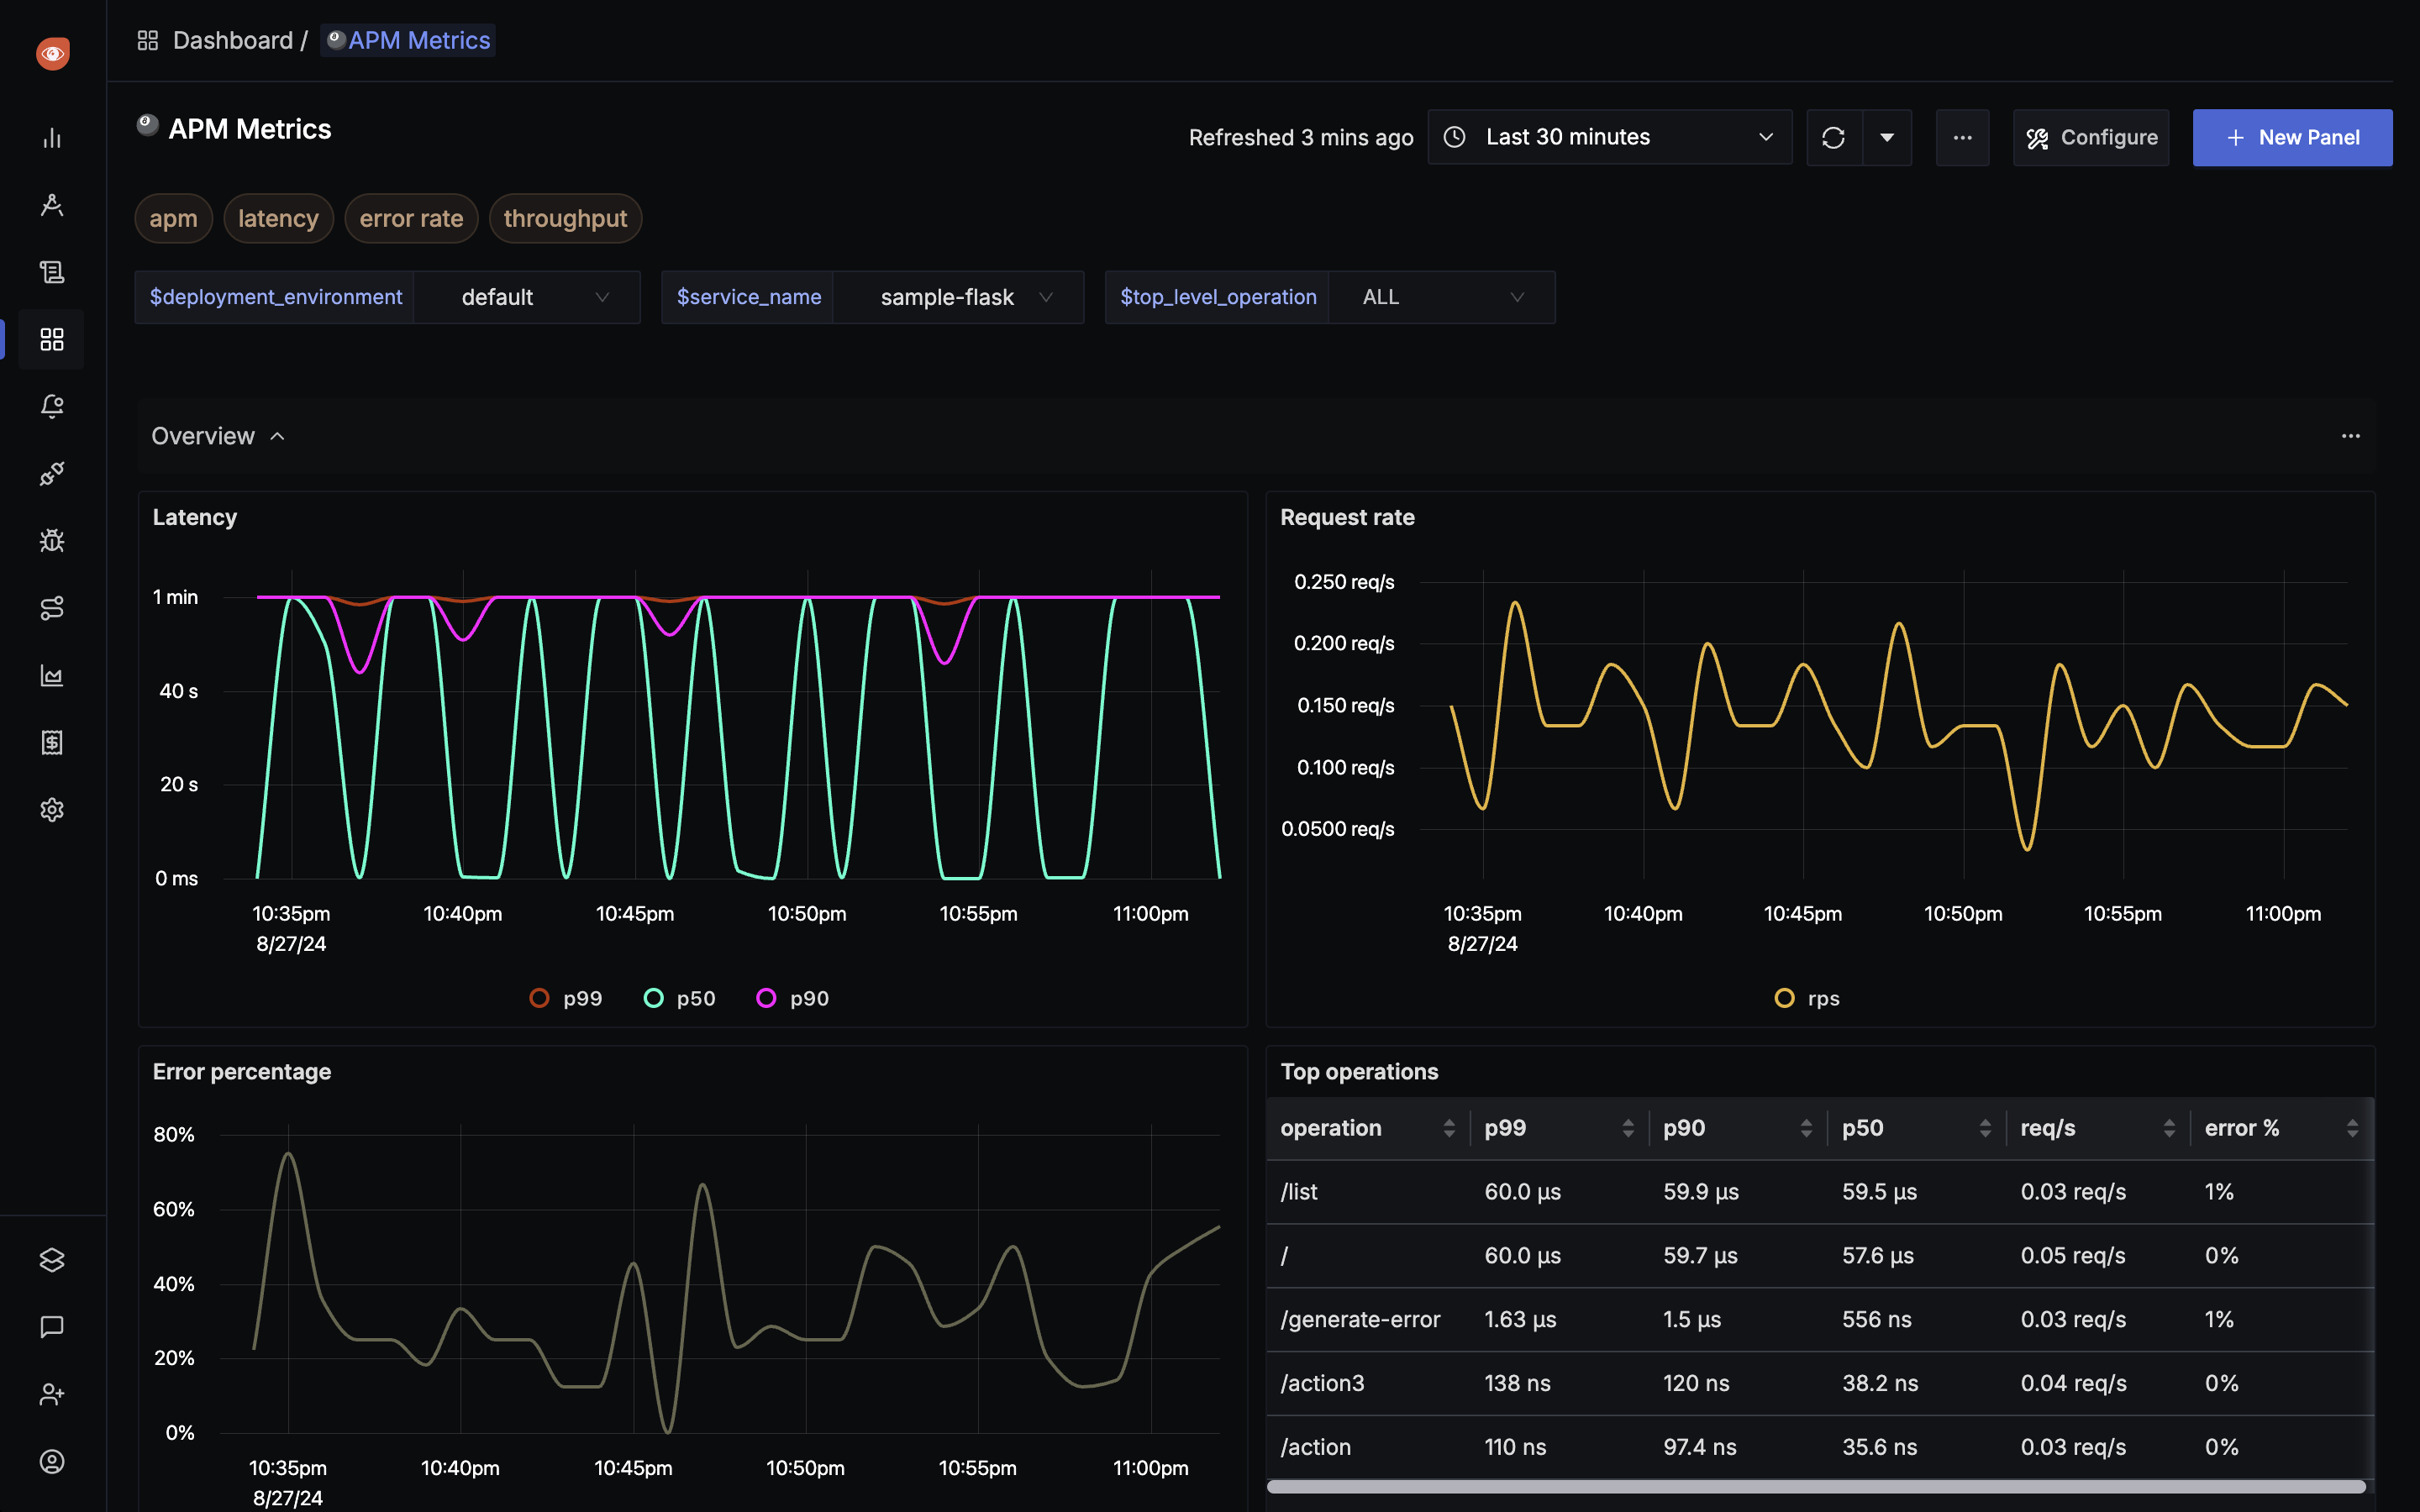
APM Metrics Dashboard
SigNoz provides a dashboard template based on the auto-generated metrics. You can import this JSON dashboard into your SigNoz instance.
The dashboard includes the following charts:
- Latency
- Request Rate
- Error Percentage
- Top operations
- DB Calls RPS
- DB Calls Avg Duration
- Top External Calls

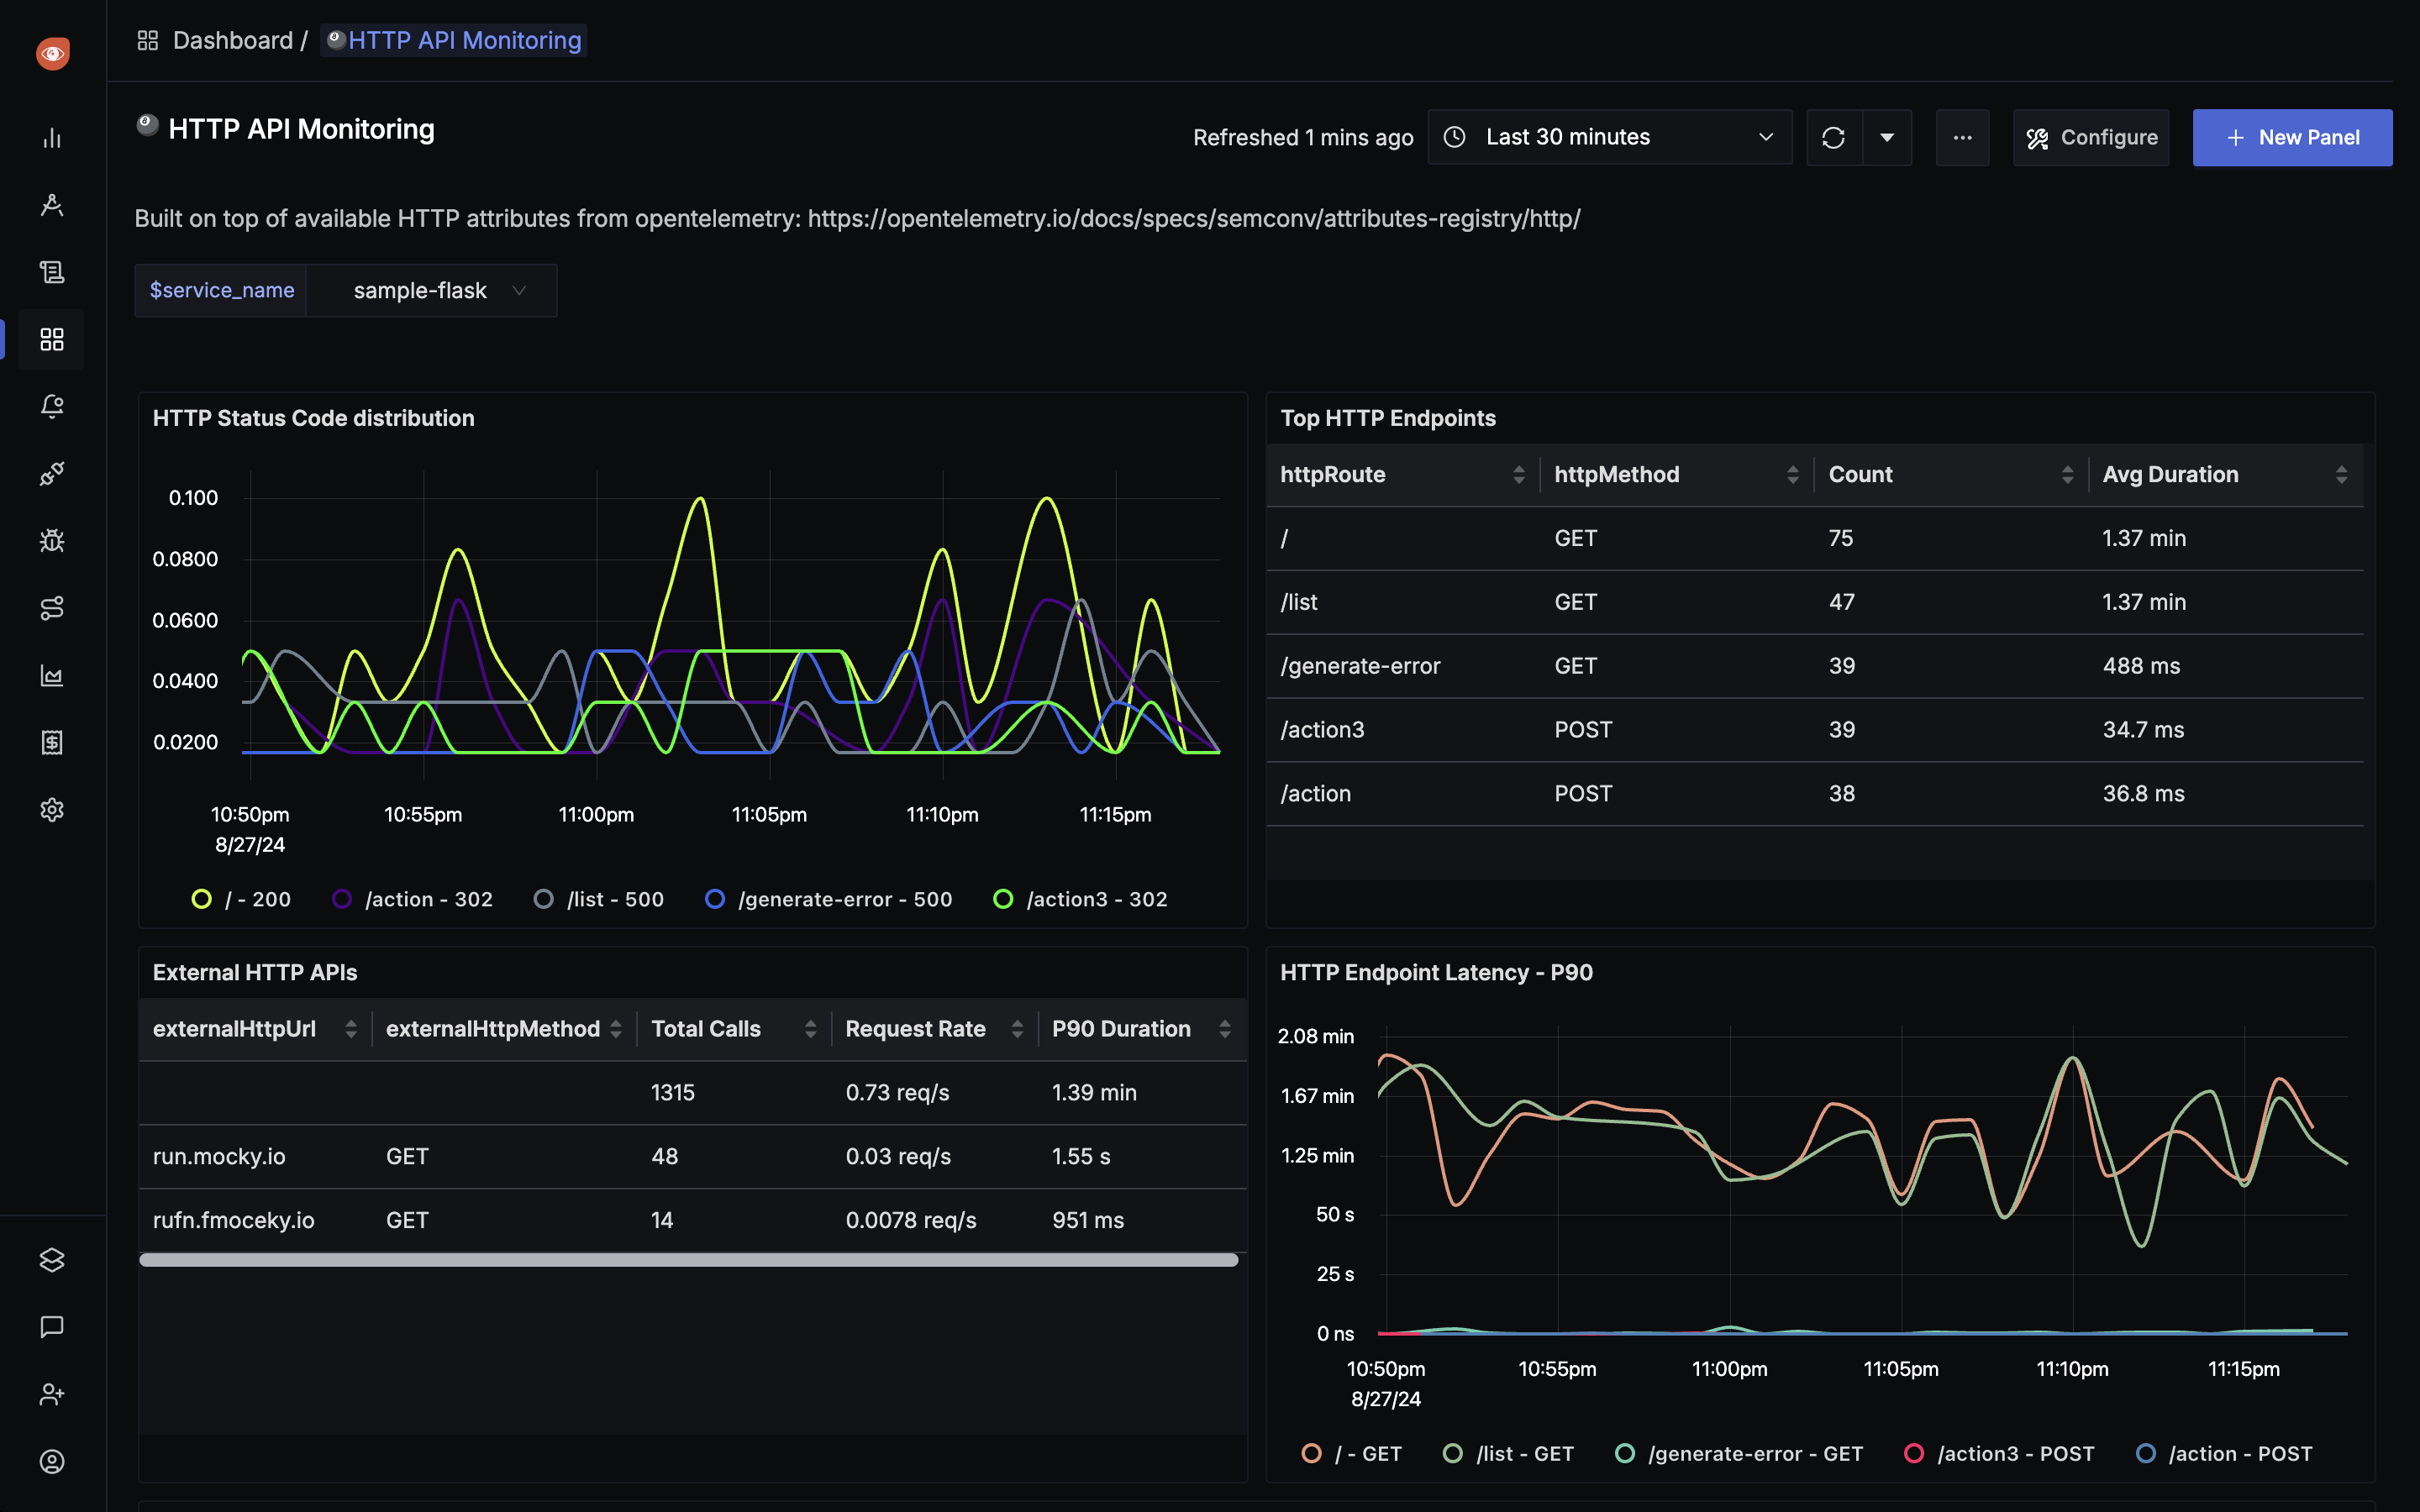
HTTP API Monitoring Dashboard
This dashboard template is built on top of available HTTP attributes from OpenTelemetry. You can import this JSON dashboard into your SigNoz instance.
The dashboard includes the following charts:
- Latency(P90) chart for each Endpoint
- HTTP Status code distribution
- Top HTTP Endpoints
- External HTTP APIs

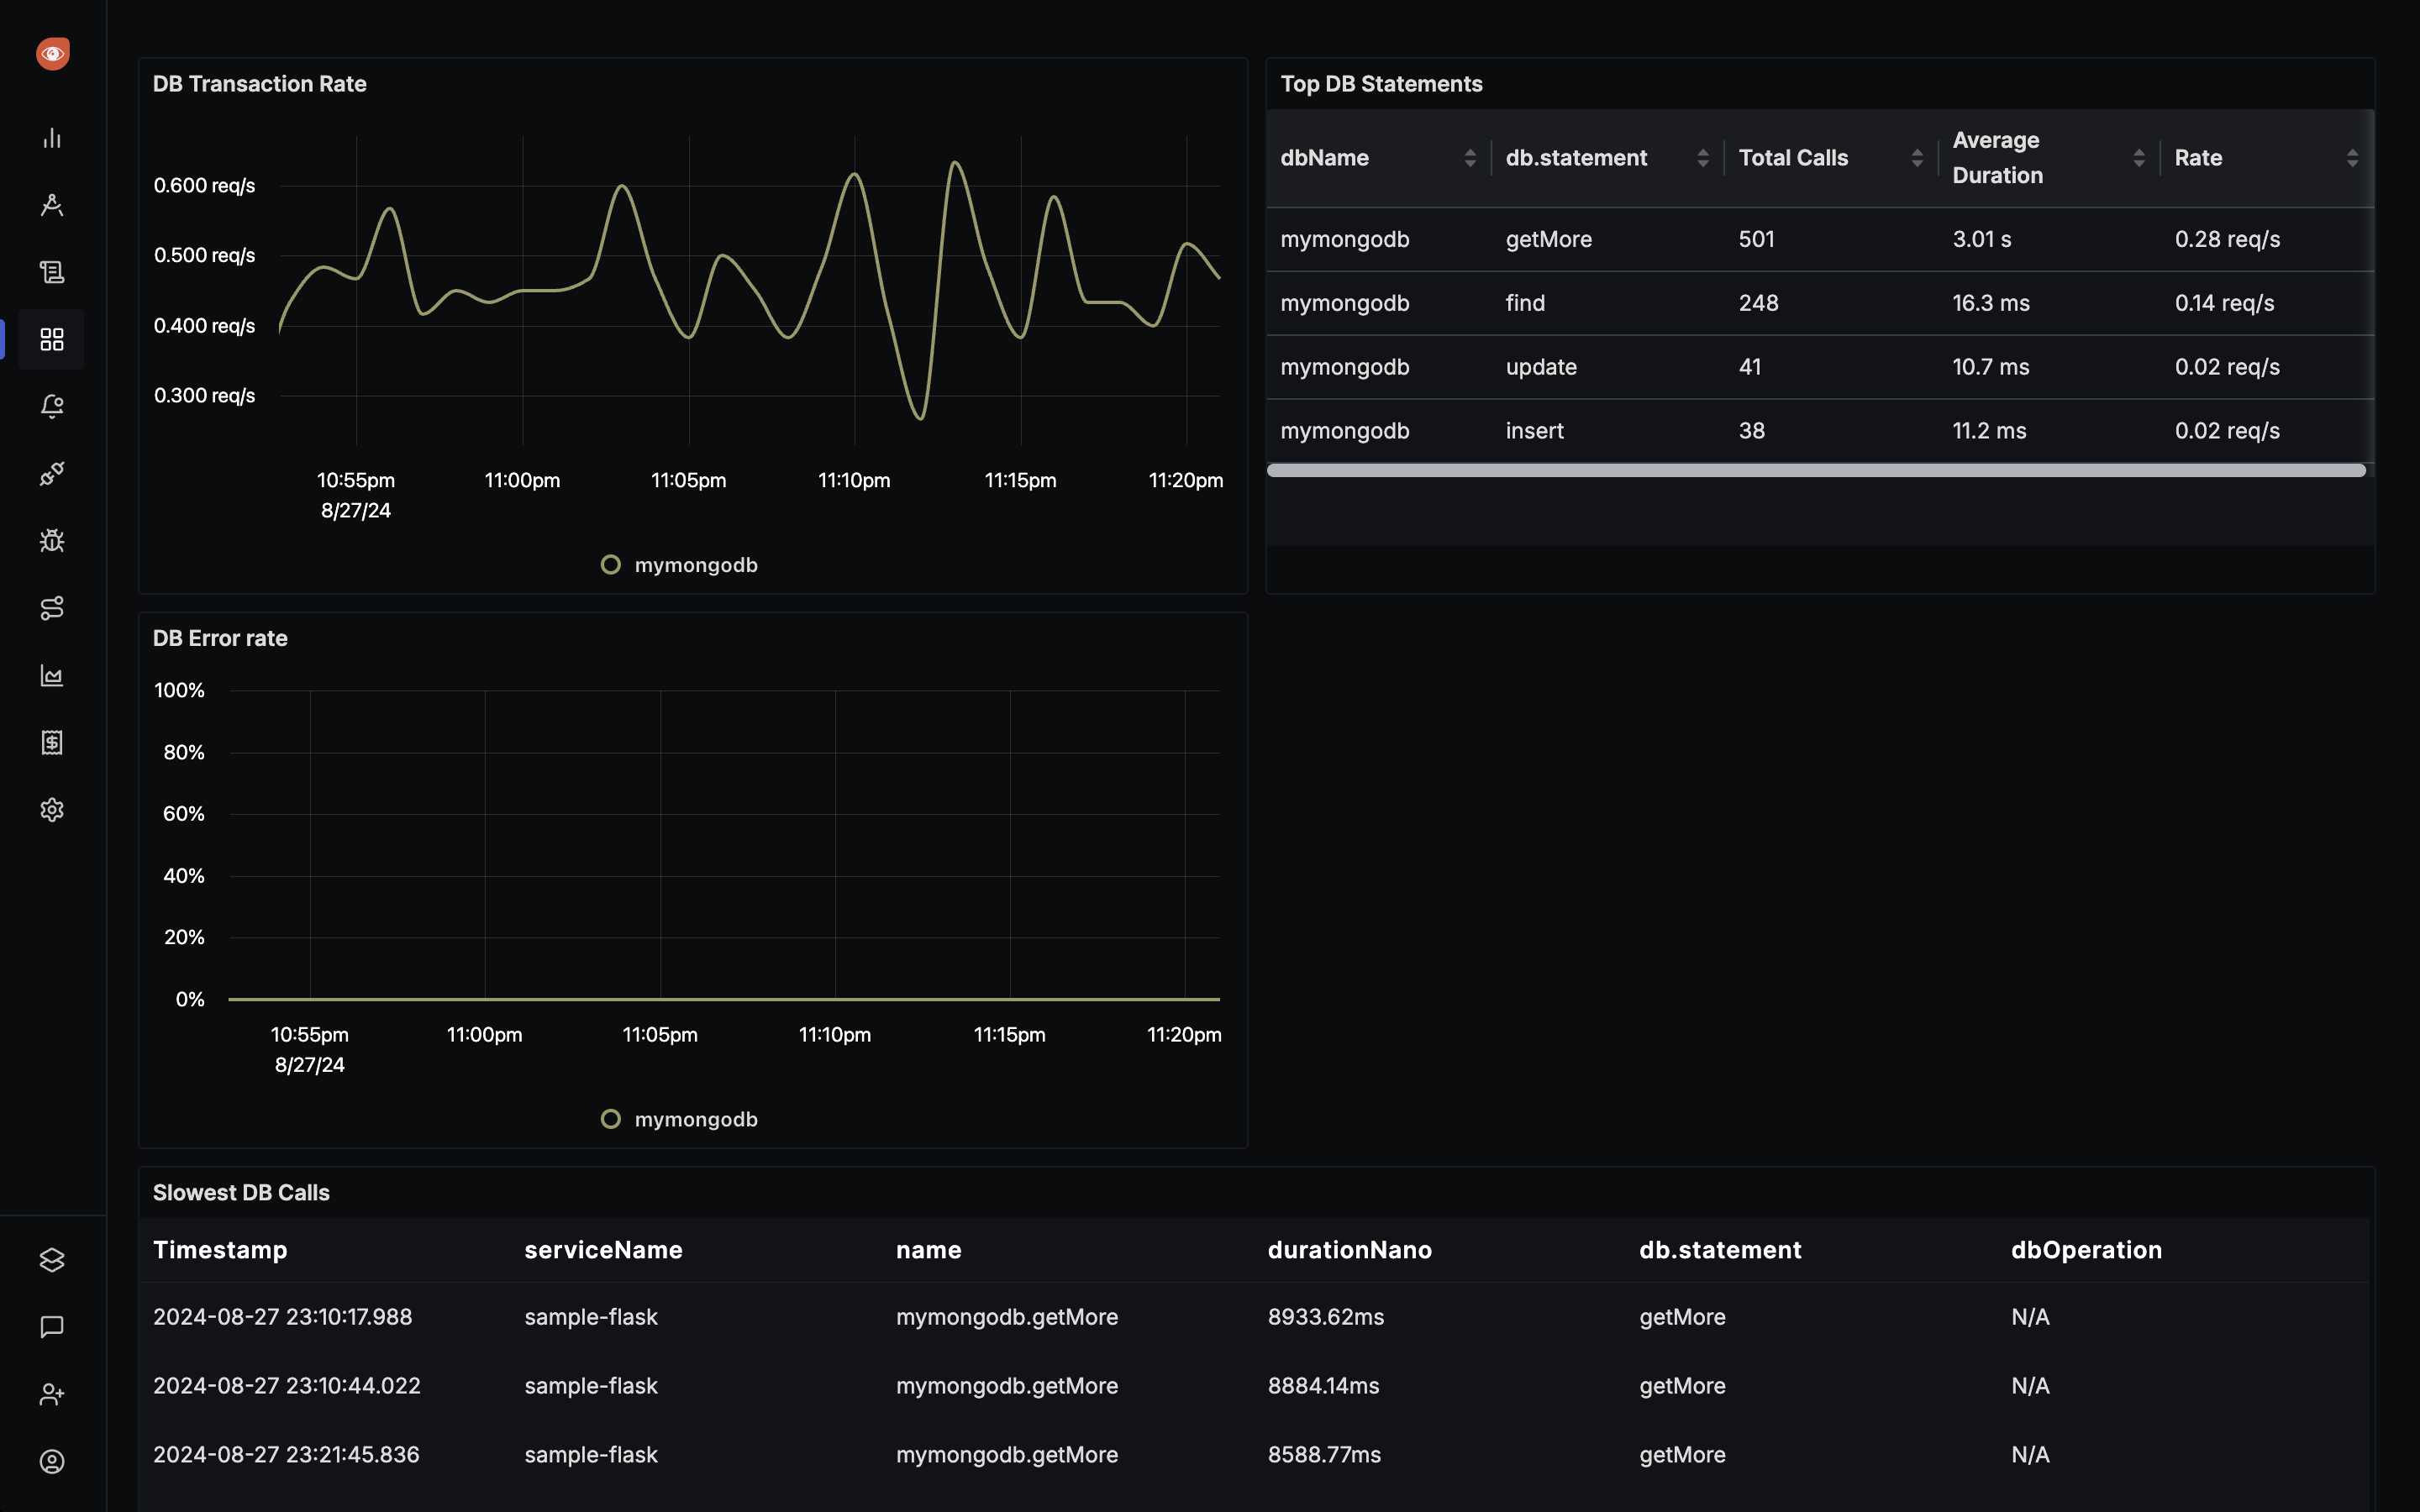
DB Calls Monitoring Dashboard
This dashboard template is built on top of available DB client call attributes from OpenTelemetry. You can import this JSON dashboard into your SigNoz instance.
The dashboard includes the following charts:
- DB Transaction Rate
- Top DB calls
- Slowest DB calls
- DB Call error rate

