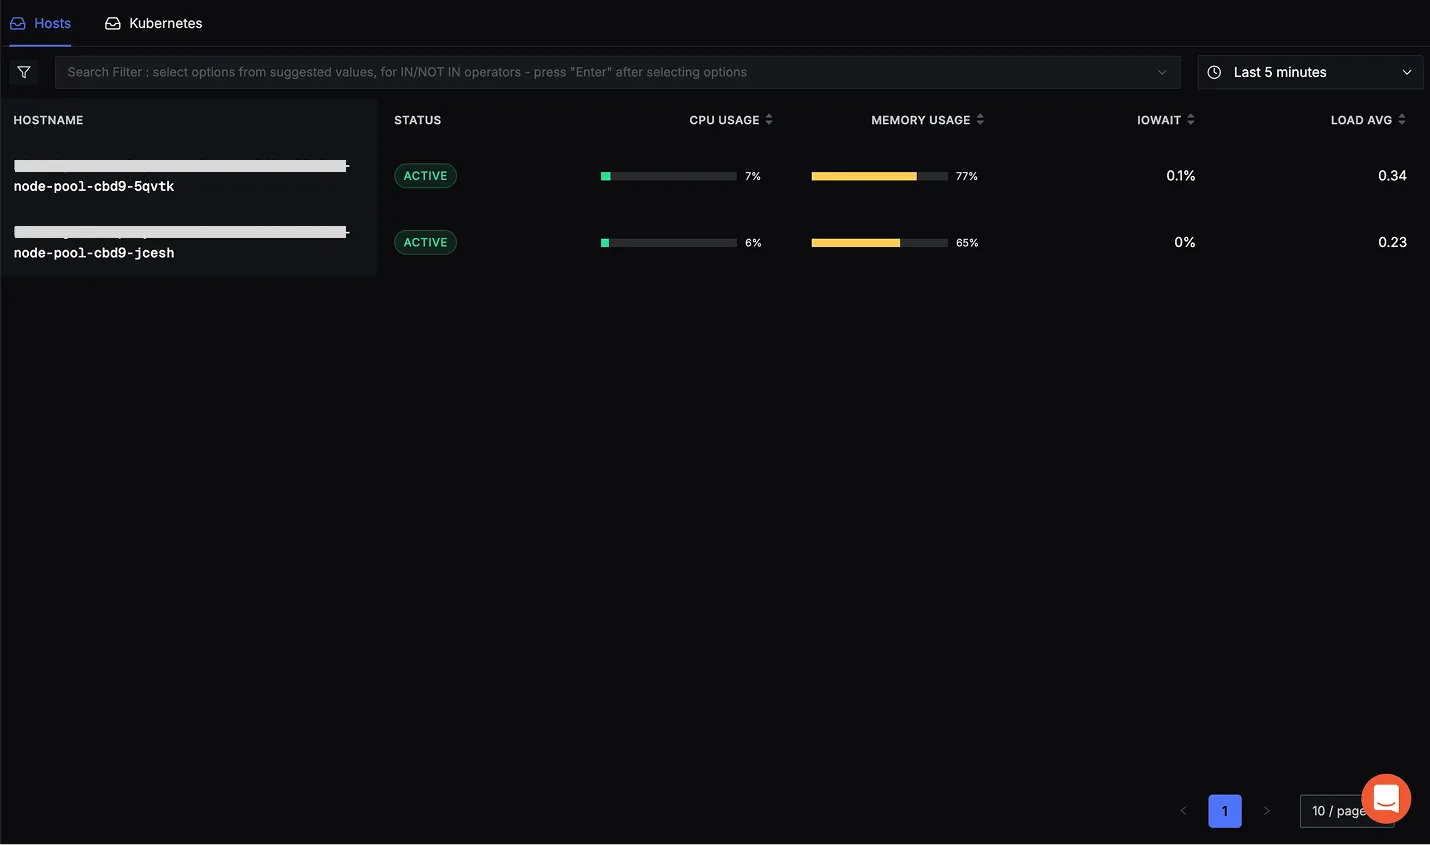
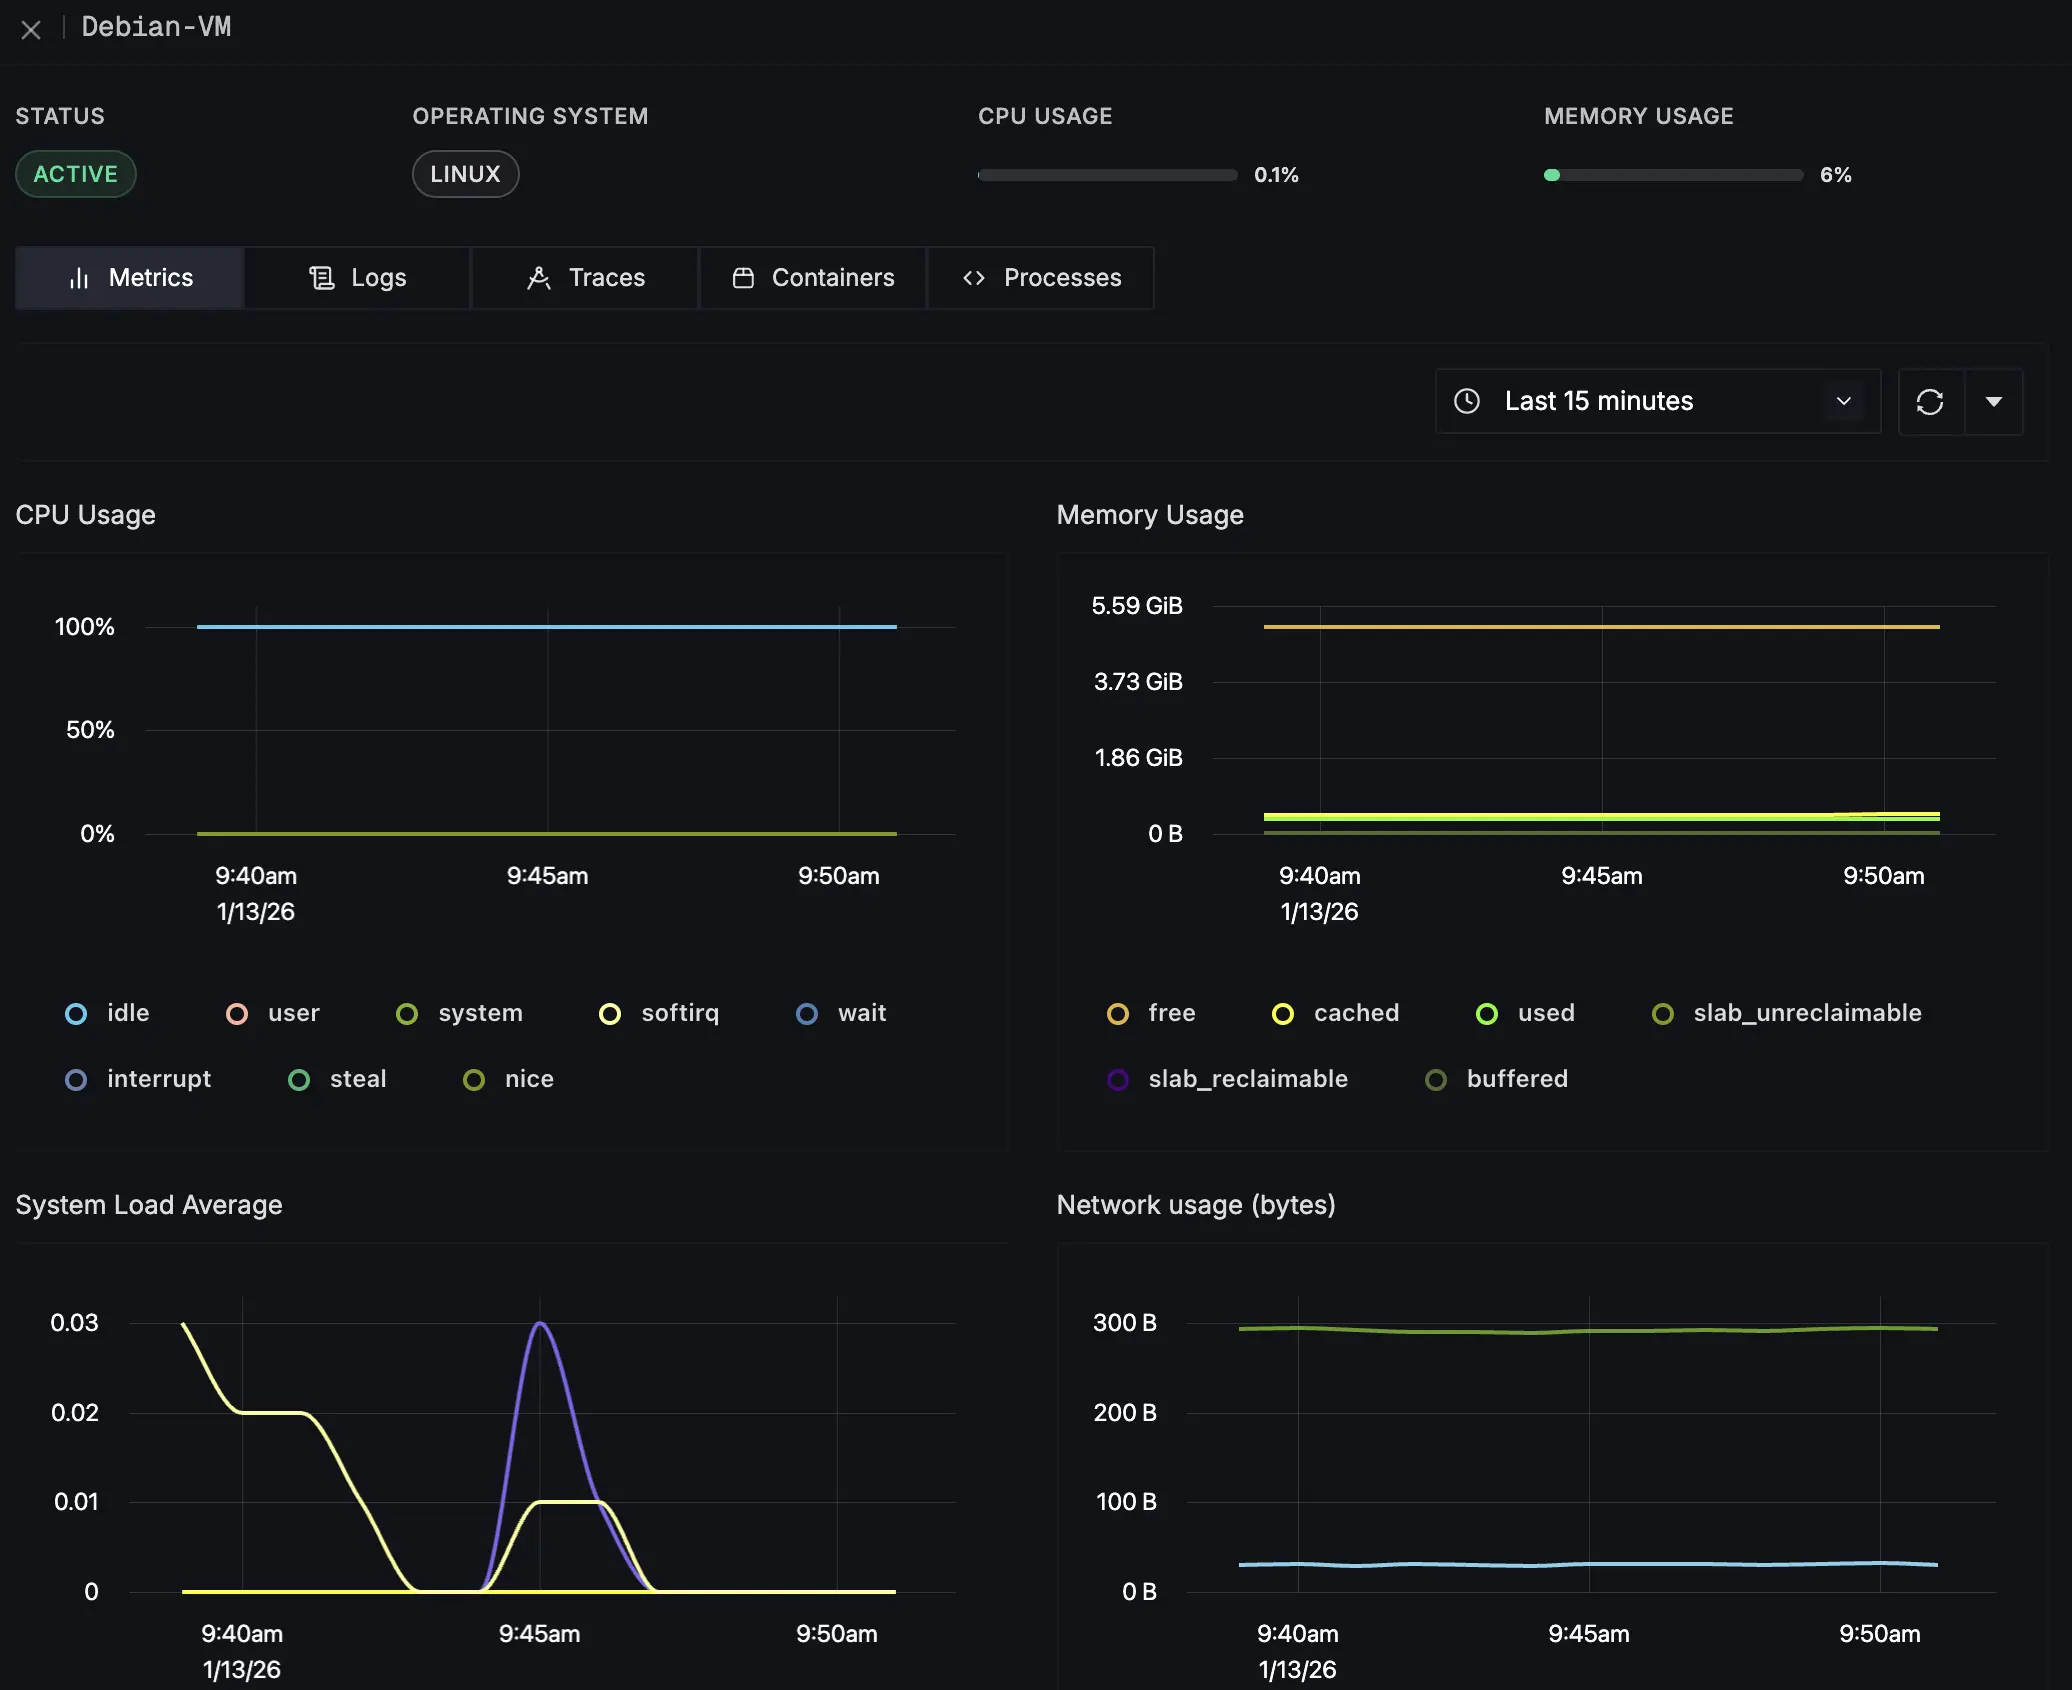
Host metrics are fundamental performance indicators collected directly from a system's operating system. These metrics provide granular visibility into the physical or virtual server's resource utilization and health status.
The OpenTelemetry hostmetrics receiver collects metrics on CPU, memory, disk, network, paging, and system performance.
Prerequisites
- An instance of SigNoz (either Cloud or Self-Hosted)
Step 1: Install OpenTelemetry Collector
Follow the OpenTelemetry Collector Installation Guide to install OpenTelemetry Collector.
Step 2: Configure the Collector
Configure the Hostmetrics Receiver
Open your OpenTelemetry Collector configuration file which is typically located at /etc/otelcol-contrib/config.yaml.
Add the hostmetrics receiver which scrapes metrics from the host system, add it to the receivers section:
receivers:
  hostmetrics:
    collection_interval: 60s
    scrapers:
      cpu: {}
      disk: {}
      load: {}
      filesystem: {}
      memory: {}
      network: {}
      nfs: {} # Linux only
      paging: {}
      process:
        mute_process_name_error: true
        mute_process_exe_error: true
        mute_process_io_error: true
      processes: {}
      system: {}
Configure the Processors
Add resourcedetection processor to the processors section to enrich metrics with resource attributes:
processors:
  batch:
  resourcedetection:
    detectors: [env, system]
The resourcedetection processor automatically adds resource attributes like hostname and OS information to your metrics.
Configure the Exporters
Add otlp exporter with SigNoz endpoint and ingestion key to the exporters section:
exporters:
  otlp:
    endpoint: 'ingest.<region>.signoz.cloud:443'
    tls:
      insecure: false
    headers:
      'signoz-ingestion-key': '<your-ingestion-key>'
Verify these values:
<region>: Your SigNoz Cloud region.<your-ingestion-key>: Your SigNoz ingestion key.
Configure the Service
Enable hostmetrics receiver, resourcedetection and batch processors in the service section:
service:
  pipelines:
    metrics:
      receivers: [hostmetrics]
      processors: [resourcedetection, batch]
      exporters: [otlp]
View Complete Configuration
Here is how the complete config.yaml file should look:
receivers:
  hostmetrics:
    collection_interval: 60s
    scrapers:
      cpu: {}
      disk: {}
      load: {}
      filesystem: {}
      memory: {}
      network: {}
      nfs: {} # Linux only
      paging: {}
      process:
        mute_process_name_error: true
        mute_process_exe_error: true
        mute_process_io_error: true
      processes: {}
      system: {}

processors:
  batch:
  resourcedetection:
    detectors: [env, system]

exporters:
  otlp:
    endpoint: "ingest.<region>.signoz.cloud:443"
    tls:
      insecure: false
    headers:
      "signoz-ingestion-key": "<your-ingestion-key>"

service:
  pipelines:
    metrics:
      receivers: [hostmetrics]
      processors: [resourcedetection, batch]
      exporters: [otlp]
Step 3: Run the Collector
After saving the configuration, restart the collector service to apply changes.
If you are using systemd to manage the collector service:
sudo systemctl restart otelcol-contrib
sudo systemctl status otelcol-contrib
If you are running the binary manually (e.g., for testing):
./otelcol-contrib --config config.yaml
Step 1: Install OpenTelemetry Collector
Follow the OpenTelemetry Collector Installation Guide to install OpenTelemetry Collector.
Step 2: Configure the Collector
To collect host metrics from a Docker container, you must bind mount the host filesystem.
Configure the Hostmetrics Receiver
Create a config.yaml file and add the following configuration. Note the root_path setting which is required for Docker.
receivers:
  hostmetrics:
    root_path: /hostfs  # Required: points to the host filesystem mounted inside the container
    collection_interval: 60s
    scrapers:
      cpu: {}
      disk: {}
      load: {}
      filesystem: {}
      memory: {}
      network: {}
      paging: {}
      process:
        mute_process_name_error: true
        mute_process_exe_error: true
        mute_process_io_error: true
        mute_process_user_error: true
      processes: {}
      system: {}
Configure the Processors
Add resource detection processor to enrich metrics:
processors:
  resourcedetection:
    detectors: [env, system]
Configure the Exporters
Add the exporter configuration:
exporters:
  otlp:
    endpoint: 'ingest.<region>.signoz.cloud:443'
    tls:
      insecure: false
    headers:
      'signoz-ingestion-key': '<your-ingestion-key>'
Verify these values:
<region>: Your SigNoz Cloud region.<your-ingestion-key>: Your SigNoz ingestion key.
Configure the Service
Set up the pipeline:
service:
  pipelines:
    metrics:
      receivers: [hostmetrics]
      processors: [resourcedetection, batch]
      exporters: [otlp]
The mute_process_*_error settings suppress common errors when the collector can't access certain process information due to permissions. This is normal in containerized or restricted environments.
View Complete Configuration
Here is how the complete config.yaml file should look:
receivers:
  hostmetrics:
    root_path: /hostfs
    collection_interval: 60s
    scrapers:
      cpu: {}
      disk: {}
      load: {}
      filesystem: {}
      memory: {}
      network: {}
      paging: {}
      process:
        mute_process_name_error: true
        mute_process_exe_error: true
        mute_process_io_error: true
        mute_process_user_error: true
      processes: {}
      system: {}

processors:
  batch:
  resourcedetection:
    detectors: [env, system]

exporters:
  otlp:
    endpoint: "ingest.<region>.signoz.cloud:443"
    tls:
      insecure: false
    headers:
      "signoz-ingestion-key": "<your-ingestion-key>"

service:
  pipelines:
    metrics:
      receivers: [hostmetrics]
      processors: [resourcedetection, batch]
      exporters: [otlp]
Step 3: Run the Collector
Run the collector container with the --volume flag to mount the host root directory to /hostfs.
docker run -d \
  --name otelcol-hostmetrics \
  --volume /:/hostfs:ro \
  --volume $(pwd)/config.yaml:/etc/otelcol-contrib/config.yaml \
  otel/opentelemetry-collector-contrib:latest \
  --config=/etc/otelcol-contrib/config.yaml
Step 1: Install OpenTelemetry Collector
Follow the OpenTelemetry Collector Installation Guide to install OpenTelemetry Collector.
Step 2: Configure the Collector
- Locate your
config.yamlfile.- Default:
C:\Program Files\OpenTelemetry Collector\config.yaml
- Default:
Configure the Hostmetrics Receiver
Add the following to your config.yaml:
receivers:
  hostmetrics:
    collection_interval: 60s
    scrapers:
      cpu: {}
      disk: {}
      load: {}
      filesystem: {}
      memory: {}
      network: {}
      paging: {}
      process:
        mute_process_name_error: true
        mute_process_exe_error: true
        mute_process_io_error: true
        mute_process_user_error: true
      system: {}
Configure the Processors
Add the resource detection processor:
processors:
  resourcedetection:
    detectors: [env, system]
Configure the Exporters
Configure the OTLP exporter:
exporters:
  otlp:
    endpoint: 'ingest.<region>.signoz.cloud:443'
    tls:
      insecure: false
    headers:
      'signoz-ingestion-key': '<your-ingestion-key>'
Verify these values:
<region>: Your SigNoz Cloud region.<your-ingestion-key>: Your SigNoz ingestion key.
Configure the Service
Enable the pipeline:
service:
  pipelines:
    metrics:
      receivers: [hostmetrics]
      processors: [resourcedetection, batch]
      exporters: [otlp]
Step 3: Run the Collector
After saving the configuration, run the collector service to apply changes.
.\otelcol-contrib.exe --config config.yaml
Advanced Configuration
Configure Different Frequencies
You can configure different collection intervals for different metrics by defining multiple hostmetrics receivers. This is useful if you want frequently changing metrics (like CPU/Memory) to be collected more often than stable ones (like Filesystem).
receivers:
  # Receiver for high-frequency metrics (e.g., every 10s)
  hostmetrics/fast:
    collection_interval: 10s
    scrapers:
      cpu: {}
      memory: {}

  # Receiver for low-frequency metrics (e.g., every 1m)
  hostmetrics/slow:
    collection_interval: 60s
    scrapers:
      filesystem: {}
      disk: {}
      network: {}

service:
  pipelines:
    metrics:
      receivers: [hostmetrics/fast, hostmetrics/slow]
      # ... other processors and exporters
Verification
Once configured, verify that metrics are flowing to SigNoz.
- Go to the Infrastructure Monitoring section in SigNoz (Hosts tab).
- You should see your host listed with metrics like CPU and Memory usage.


Troubleshooting
No metrics appearing in SigNoz
Symptoms: Host not visible in Infrastructure Monitoring > Hosts tab.
Resolution:
Check collector logs for errors.
Linux (Systemd):
journalctl -u otelcol-contrib -fDocker:
docker logs otelcol-hostmetrics -fWindows (PowerShell):
Get-Content "C:\Program Files\OpenTelemetry Collector\otelcol.log" -WaitVerify the hostmetrics receiver is enabled in your config.
Ensure the collector can reach the SigNoz endpoint (port 443 for Cloud, 4317 for Self-Hosted).
Host Name is blank/empty
Symptoms: Host name appears blank or empty in Infrastructure Monitoring > Hosts tab.
Cause: Metrics are missing the host.name resource attribute (metadata the collector attaches to every metric to identify which host it came from). This typically happens when:
- The
resourcedetectionprocessor is not added to theprocessorssection of your collector config, or - The processor is defined but not enabled in your metrics pipeline (the
processorslist underservice > pipelines > metrics).
Resolution:
- Verify that the
resourcedetectionprocessor is in yourprocessorssection:
processors:
  resourcedetection:
    detectors: [env, system, docker]
  batch:
- Verify that
resourcedetectionis listed in your metrics pipeline beforebatch:
service:
  pipelines:
    metrics:
      receivers: [hostmetrics]
      processors: [resourcedetection, batch]
      exporters: [otlp]
- Restart the collector to apply changes and check logs for errors (see Run the Collector).
The resourcedetection processor automatically detects resource attributes like host.name and OS information from the host environment. For the full list of supported detectors, see the resourcedetection processor documentation.
Verification: After restarting, go to Infrastructure Monitoring > Hosts. Your host should now appear with its hostname populated.
Connection Refused
Symptoms: Logs show connection refused errors.
Resolution:
- Ensure the OTLP endpoint is reachable.
- Verify the correct port is being used.
- Check firewall settings.
Invalid Key (Cloud)
Symptoms: HTTP 401 Unauthorized errors in logs.
Resolution:
- Double-check your ingestion key in
config.yaml. - Ensure it matches the key in SigNoz (Settings > Ingestion Settings).
Next Steps
- Visualize Host Metrics using Dashboard Templates
- Set up Alerts for Host Metrics
- Learn more about Infrastructure Monitoring
Get Help
If you need help with the steps in this topic, please reach out to us on SigNoz Community Slack.
If you are a SigNoz Cloud user, please use in product chat support located at the bottom right corner of your SigNoz instance or contact us at cloud-support@signoz.io.
