SigNoz is an open-source observability tool powered by OpenTelemetry. Use SigNoz to monitor your applications and infrastructure with logs, metrics, traces, and exceptions — all in one place. Set alerts on any telemetry signal, then debug issues using built-in analytics features like the Trace Explorer, Logs Explorer, and Metrics Explorer.
SigNoz is built on top of OpenTelemetry, which gives you the advantage of keeping your code vendor-free.
What is OpenTelemetry?
OpenTelemetry is an open-source standard for collecting telemetry data (traces, metrics, and logs) from your applications and infrastructure. Unlike proprietary agents from other vendors that lead to lock-in, OpenTelemetry lets you collect data once and send it to any backend that supports the standard.
Although many vendors support OpenTelemetry, SigNoz has been built on OpenTelemetry since day 1. Our docs are OpenTelemetry-first, and we utilize OpenTelemetry's semantic conventions to provide richer context while debugging applications.
Key capabilities
- Unified observability — Logs, metrics, traces, and exceptions in a single platform with correlated views for faster debugging.
- OpenTelemetry-native — Built on OpenTelemetry from day 1. No proprietary agents — your instrumentation stays vendor-free.
- Powerful querying — Query Builder with aggregations, filters, and formulas across all signal types.
- Flexible alerting — Alerts on any telemetry signal with threshold, anomaly, and Apdex-based detection.
- Custom dashboards — Build dashboards from any combination of metrics, logs, and trace data.
- ClickHouse-powered — Fast queries and cost-effective storage using ClickHouse, with hot/cold storage tiers.
Key product capabilities
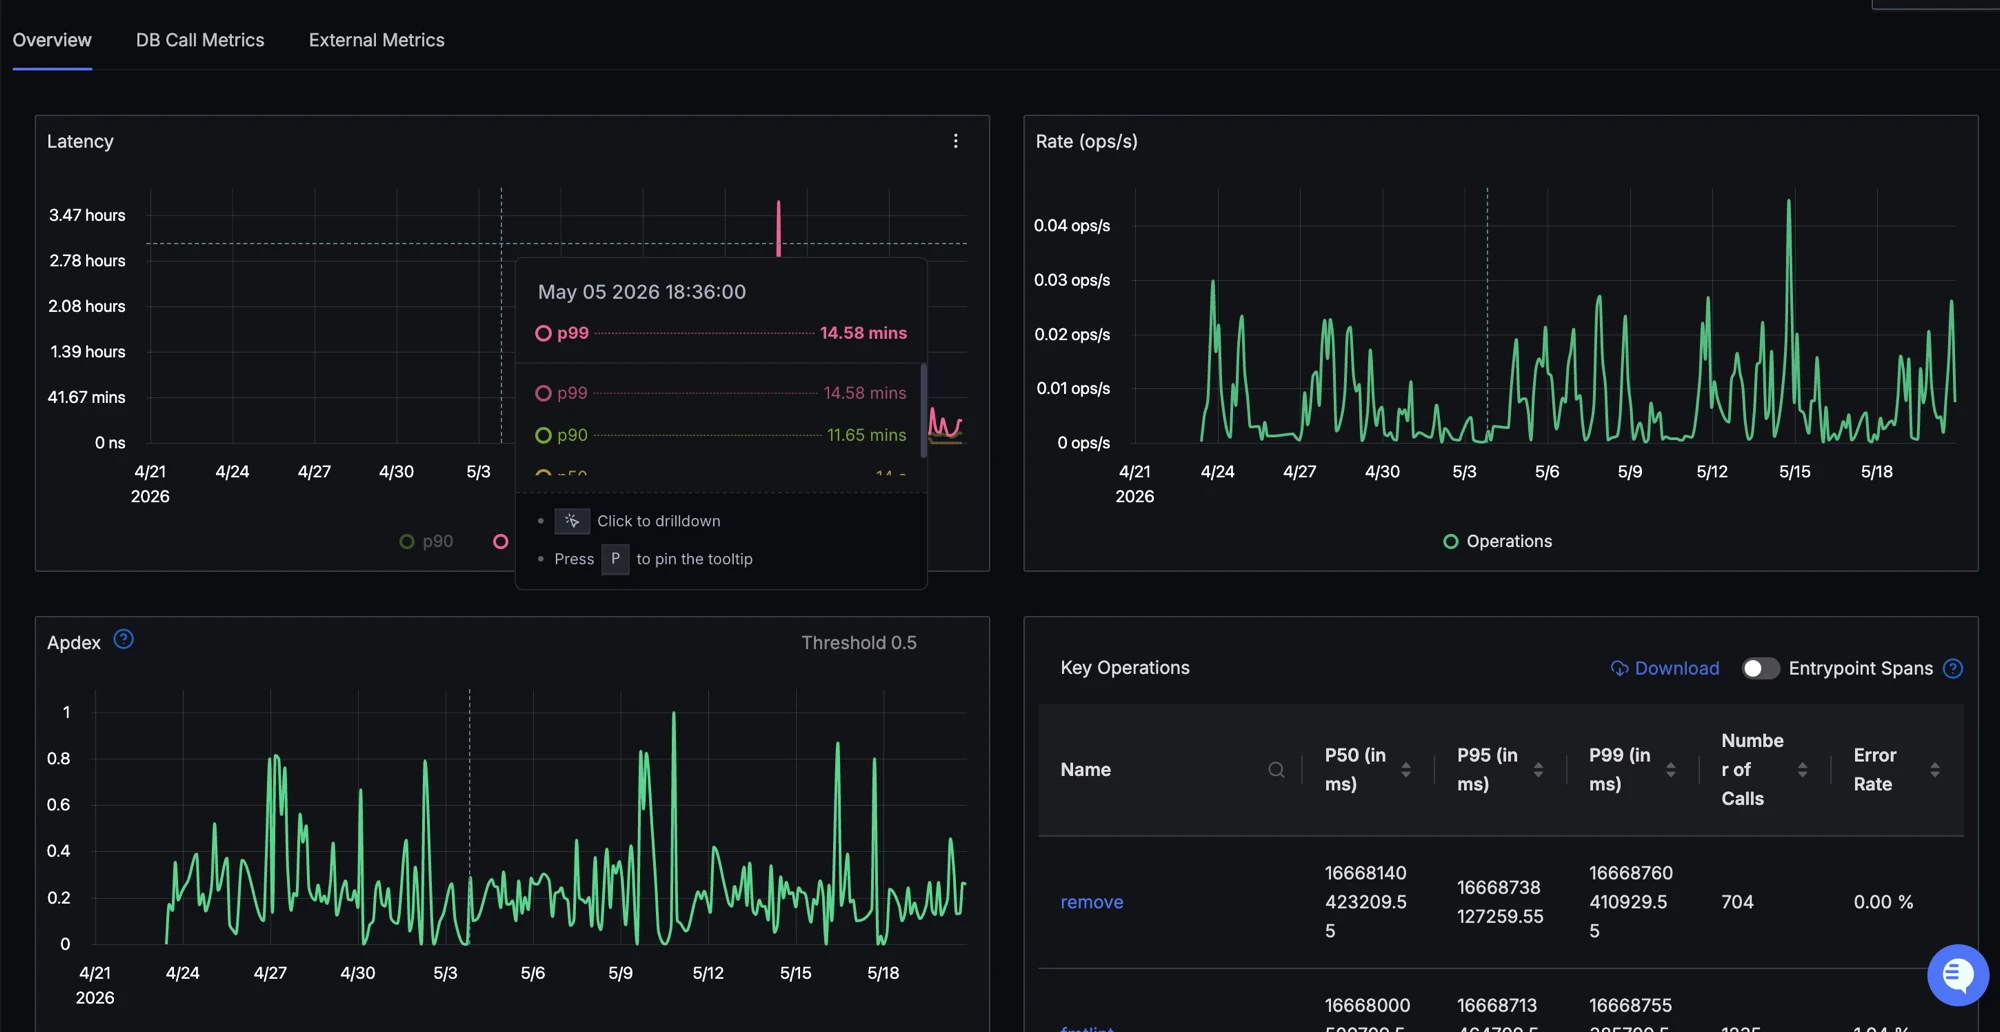
Application Performance Monitoring
Use SigNoz APM to monitor your applications and services. It comes with out-of-box charts for key application metrics like p99 latency, error rate, Apdex and operations per second. You can also monitor the database and external calls made from your application.
You can instrument your application with OpenTelemetry to get started.
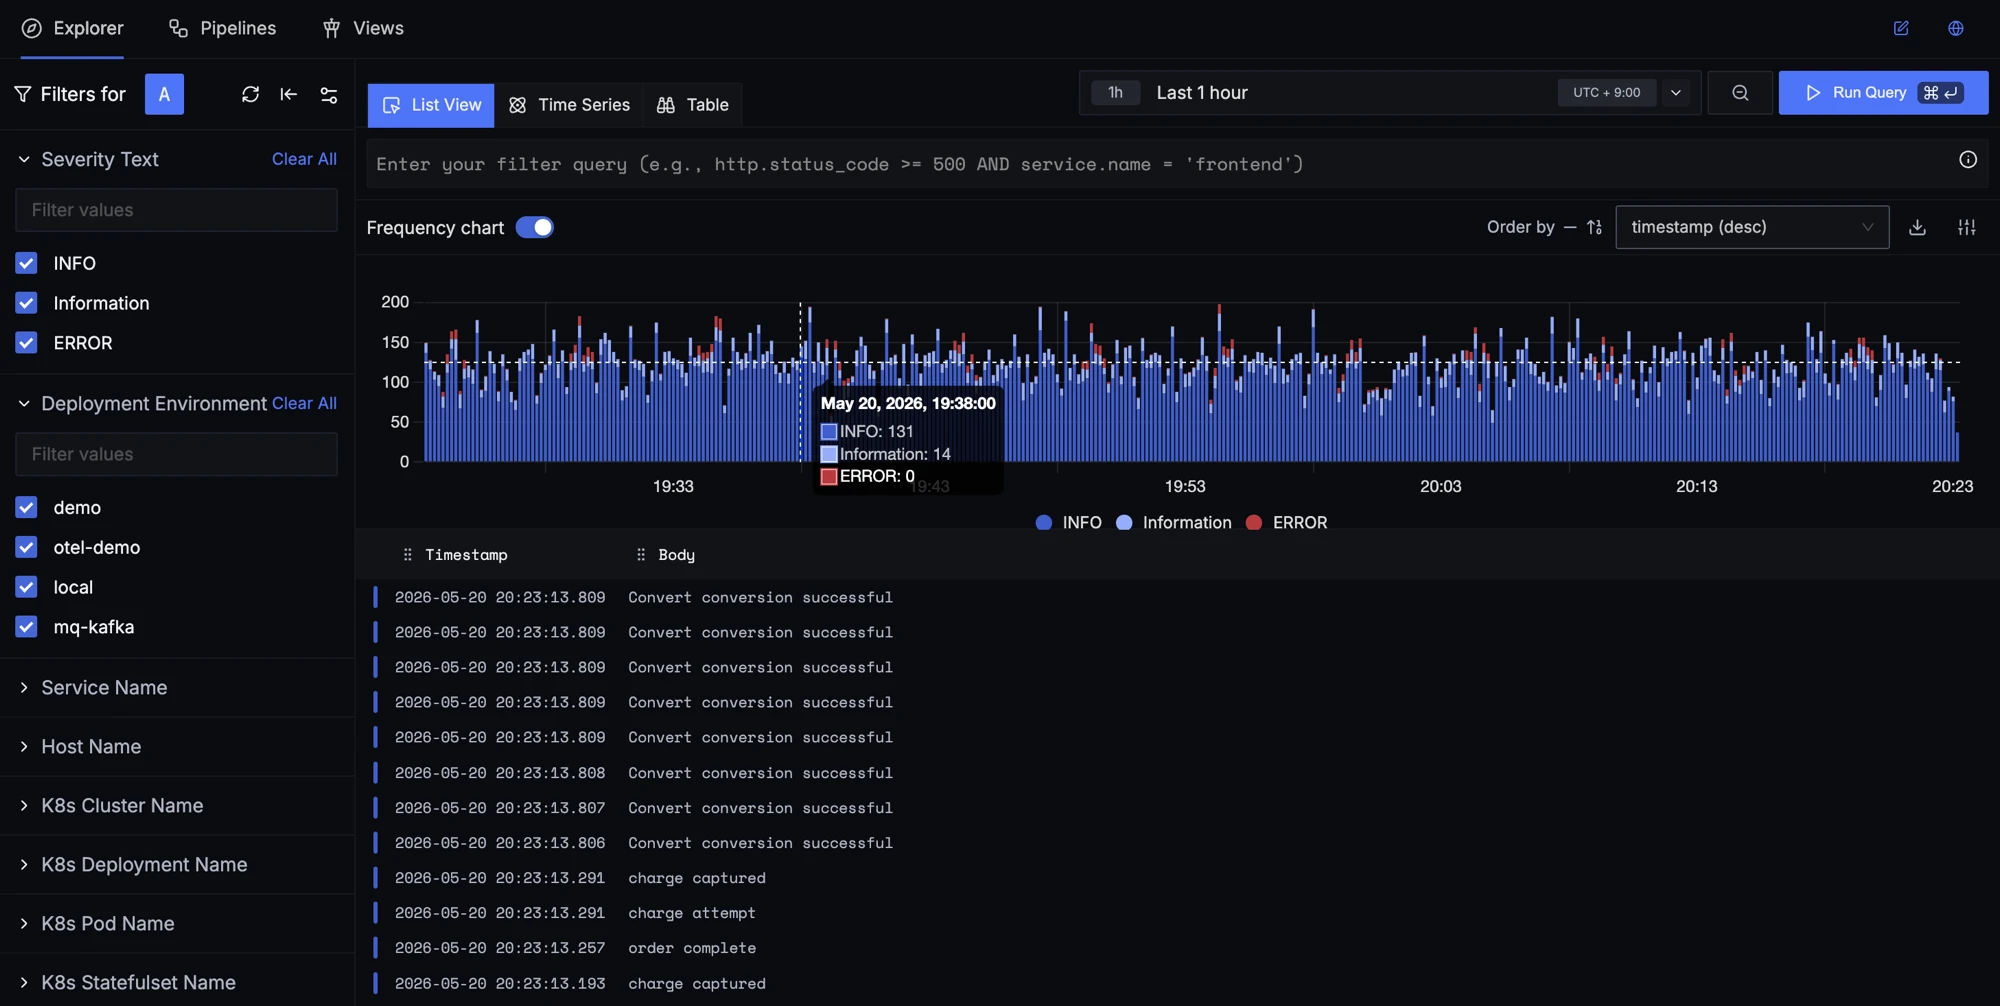
Log Management
SigNoz can be used as a centralized log management solution. We use ClickHouse (used by likes of Uber & Cloudflare) as a datastore — an extremely fast and highly optimized storage for logs data. Instantly search through all your logs using quick filters and a powerful query builder.
You can also create charts on your logs and monitor them with customized dashboards.
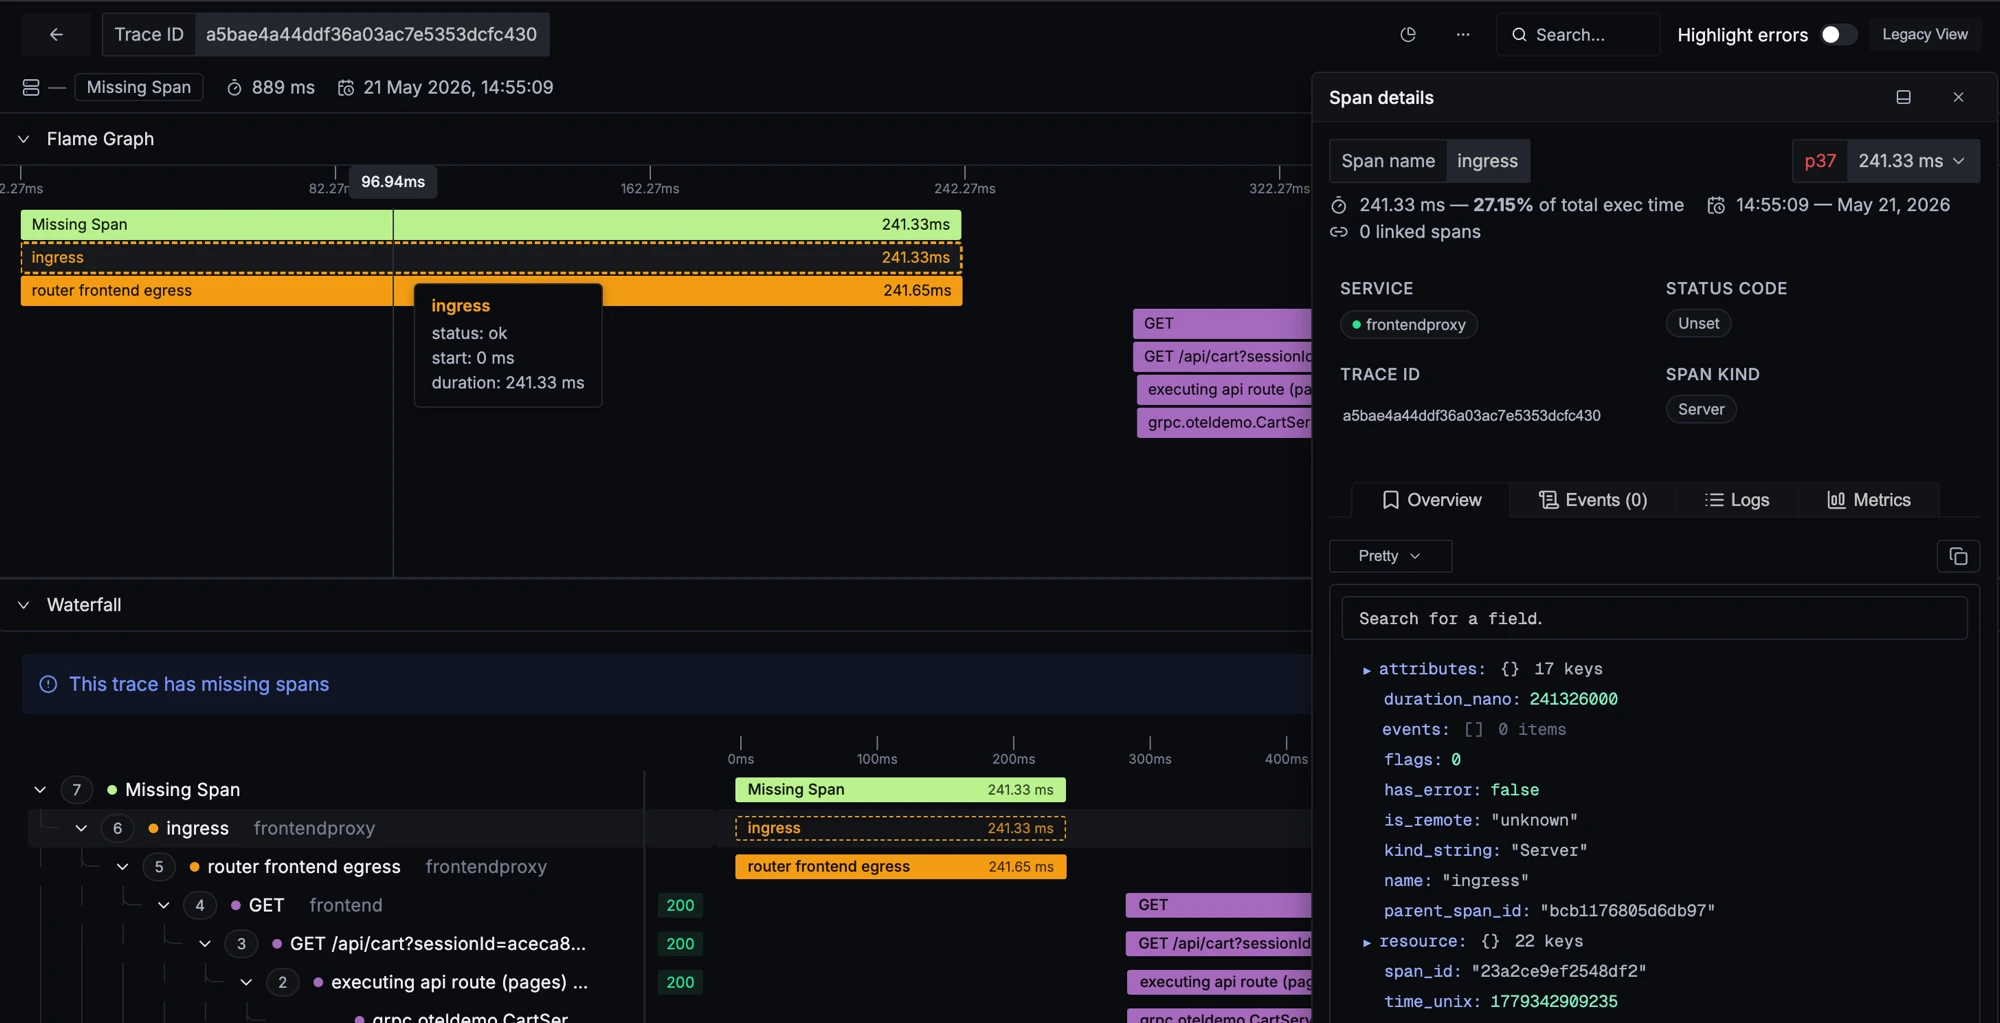
Distributed Tracing
Distributed Tracing is essential to troubleshoot issues in microservices applications. Powered by OpenTelemetry, distributed tracing in SigNoz can help you track user requests across services to help you identify performance bottlenecks.
See user requests in a detailed breakdown with the help of Flamegraphs and Gantt Charts. Click on any span to see the entire trace represented beautifully, which will help you make sense of where issues actually occurred in the flow of requests.
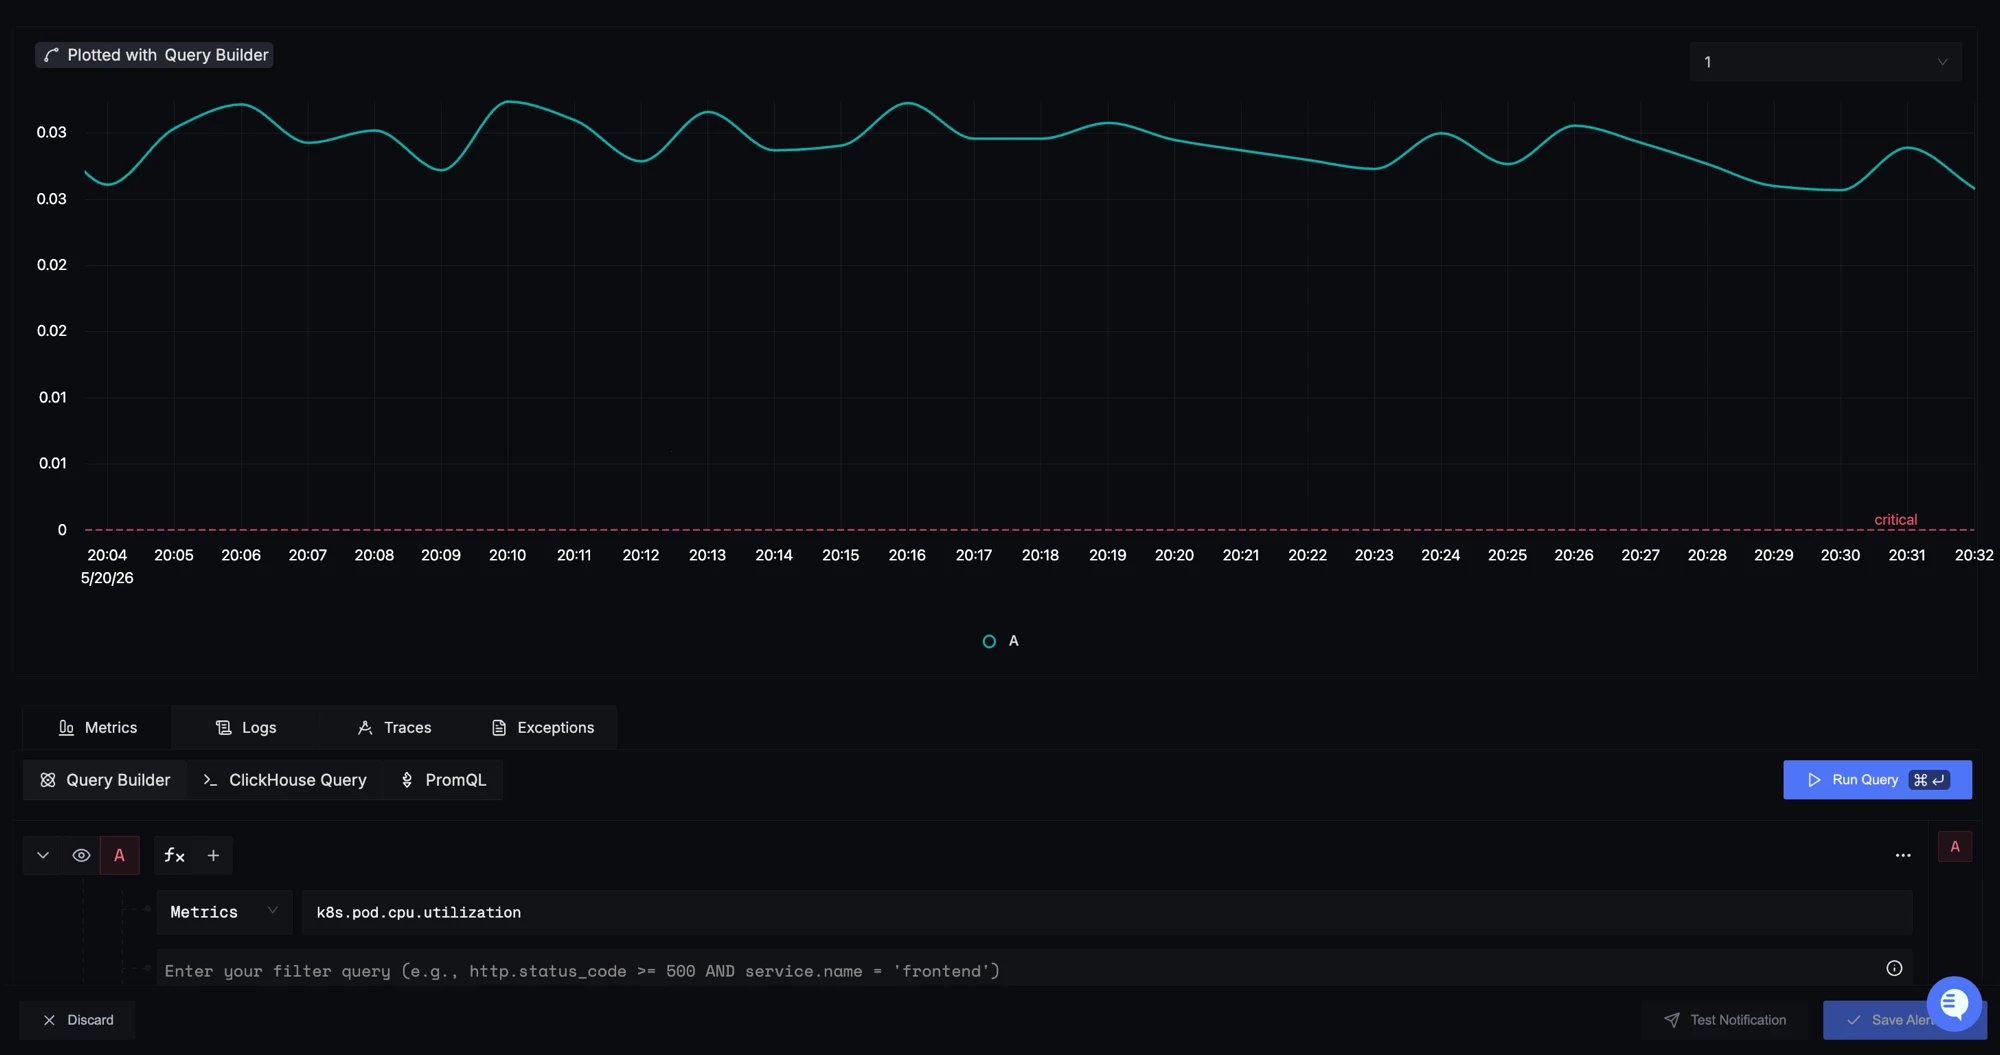
Alerts
Use alerts in SigNoz to get notified when anything unusual happens in your application. You can set alerts on any type of telemetry signal (logs, metrics, traces), create thresholds and set up a notification channel to get notified. Advanced features like alert history and anomaly detection can help you create smarter alerts.
Alerts in SigNoz help you identify issues proactively so that you can address them before they reach your customers.
Metrics & Dashboards
Ingest metrics from your infrastructure or applications and create customized dashboards to monitor them. Create visualizations that suit your needs with a variety of panel types like pie chart, time-series, bar chart, etc.
Create queries on your metrics data quickly with an easy-to-use metrics query builder. Add multiple queries and combine those queries with formulae to create really complex queries quickly.

Exceptions
Monitor exceptions automatically in Python, Java, Ruby, and Javascript. For other languages, just drop in a few lines of code and start monitoring exceptions.
See the detailed stack trace for all exceptions caught in your application. You can also log in custom attributes to add more context to your exceptions. For example, you can add attributes to identify users for which exceptions occurred.
Get started
- Application Performance Monitoring — Instrument your services with OpenTelemetry.
- Send Logs — Collect and analyze logs.
- Send Metrics — Ingest infrastructure and application metrics.
- Create Dashboards — Build custom visualizations.
- Exceptions Monitoring — Track and debug application errors.
- Create Alerts — Get notified about issues proactively.
Popular docs
- AWS Monitoring — Monitor AWS infrastructure.
- GCP Monitoring — Monitor Google Cloud resources.
- Host Monitoring — Collect host-level metrics.
- Kubernetes Infra Metrics and Logs — Monitor Kubernetes clusters.
- Monitor HTTP Endpoints — Synthetic monitoring for endpoints.
- OpenTelemetry Binary Usage in a VM — Run the OTel Collector on VMs.
