Alerts in SigNoz can help you to define which data to monitor, set thresholds to detect potential problems, and specify who should be notified and how. This can help you to identify critical issues and reduce noise. This document will help you in understanding how to set up and use alerts effectively.
Managing Alerts

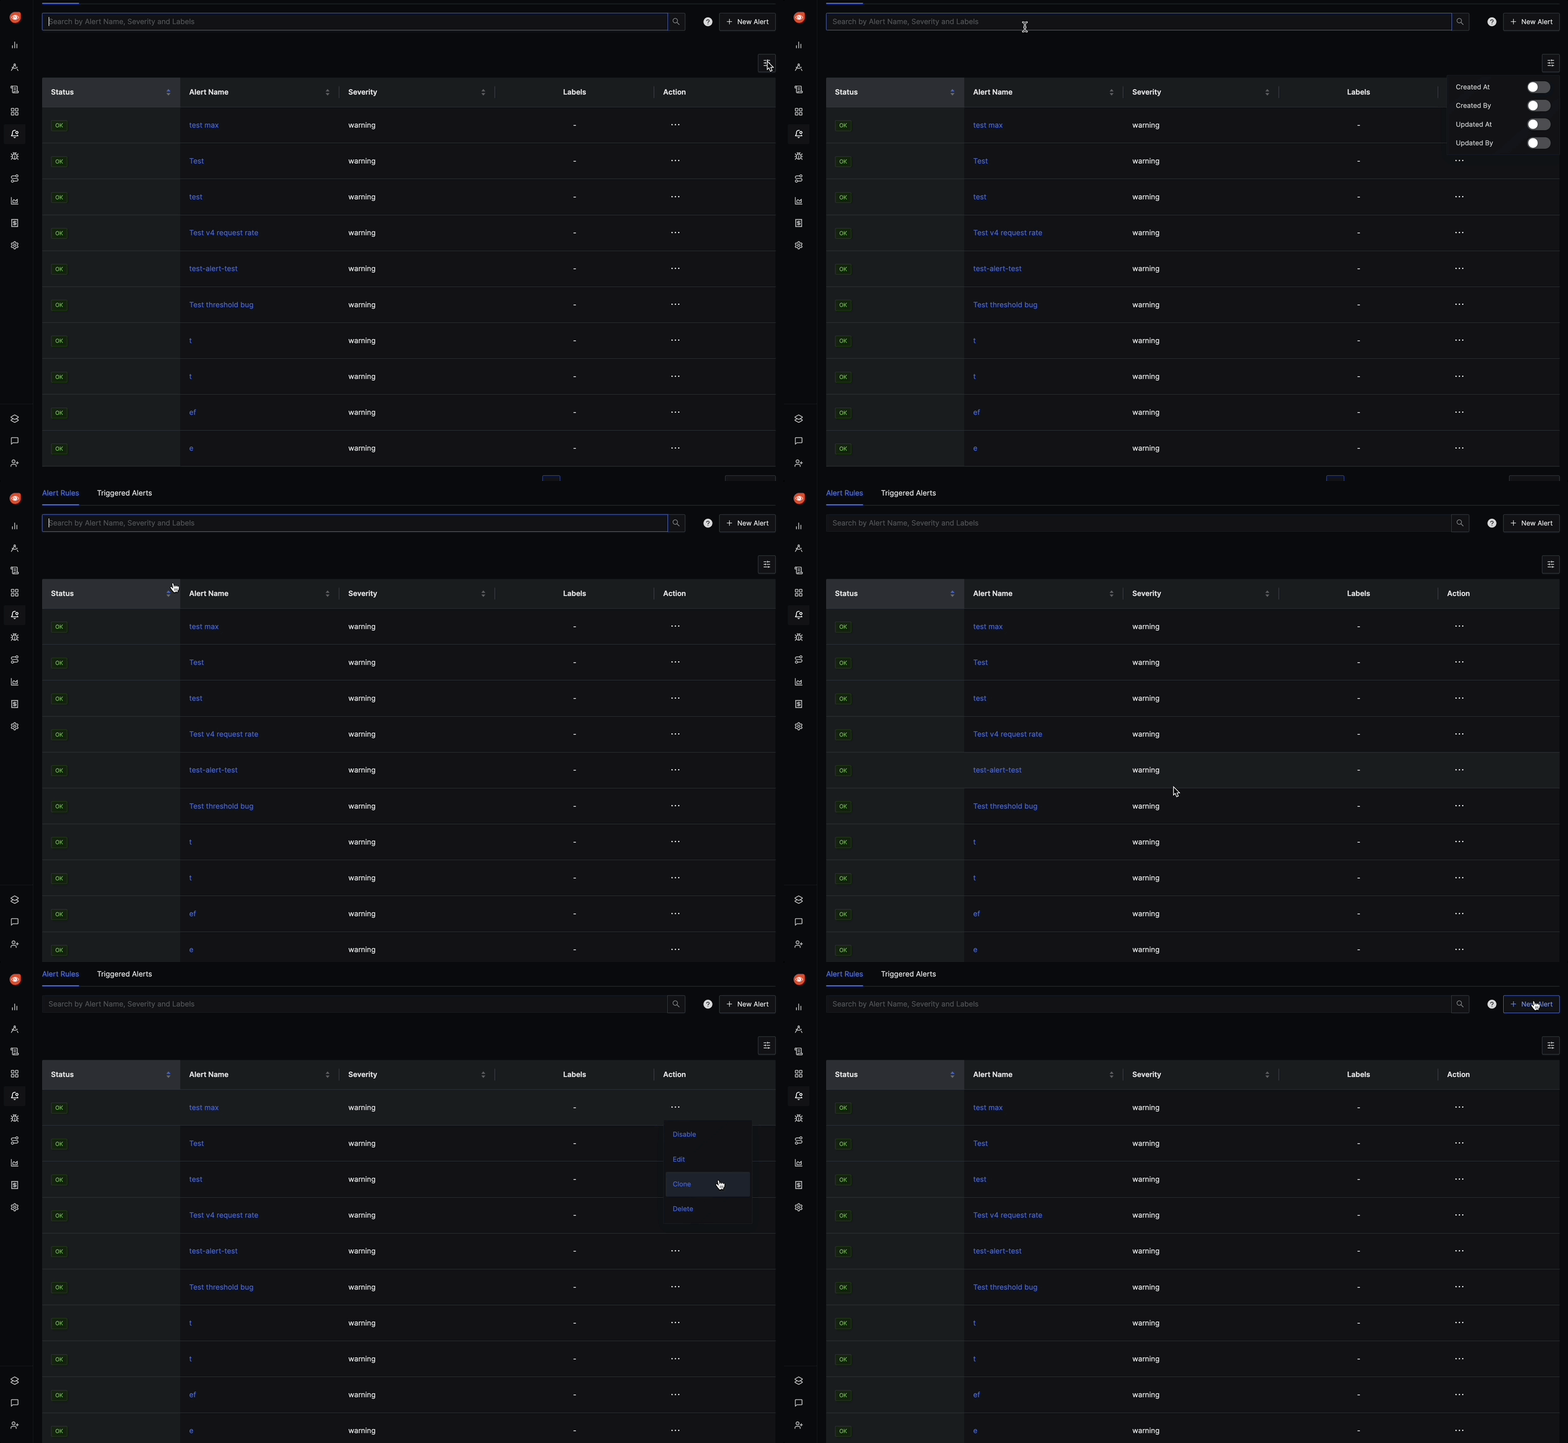
The Alert Rules Tab in SigNoz provides an overview of the alert defined by the user. This section allows you to view, edit, or manage alert rules, along with their associated metadata. Here's a breakdown of the features available:
Alert Rule Columns
- Status: Indicates whether the alert rule is enabled (OK) or disabled.
- Alert Name: The name given to the alert rule for easy identification.
- Severity: The level of severity assigned to the alert. For example,
warning,criticaletc. - Labels: Displays any labels associated with the alert rule. Labels can help in categorizing alerts.
Additional Alert Rule Options
- Filter by Created At, Created By, Updated At, and Updated By: The filter option in the top-right corner allows you to customize which fields are displayed. You can choose to show fields like when was the alert created who created the alert, when it was last updated, and who updated it.
- Sorting Columns: By hovering over a column name and clicking it, you can sort the list of alert rules in ascending or descending order based on that column's data.
- New Alert: At the top-right corner, the "+ New Alert" button lets you create a new alert rule.
Navigation and Search
- Search Bar: At the top of the tab, you can search for specific alert rules by name, severity, or label.
- Pagination Controls: At the bottom-right corner, you can navigate through multiple pages of alert rules.
- Actions Menu: Found on the right side of each row, this menu allows you to perform additional actions on the alert, such as Enable, Edit, Clone and Delete.
Triggered Alerts Tab

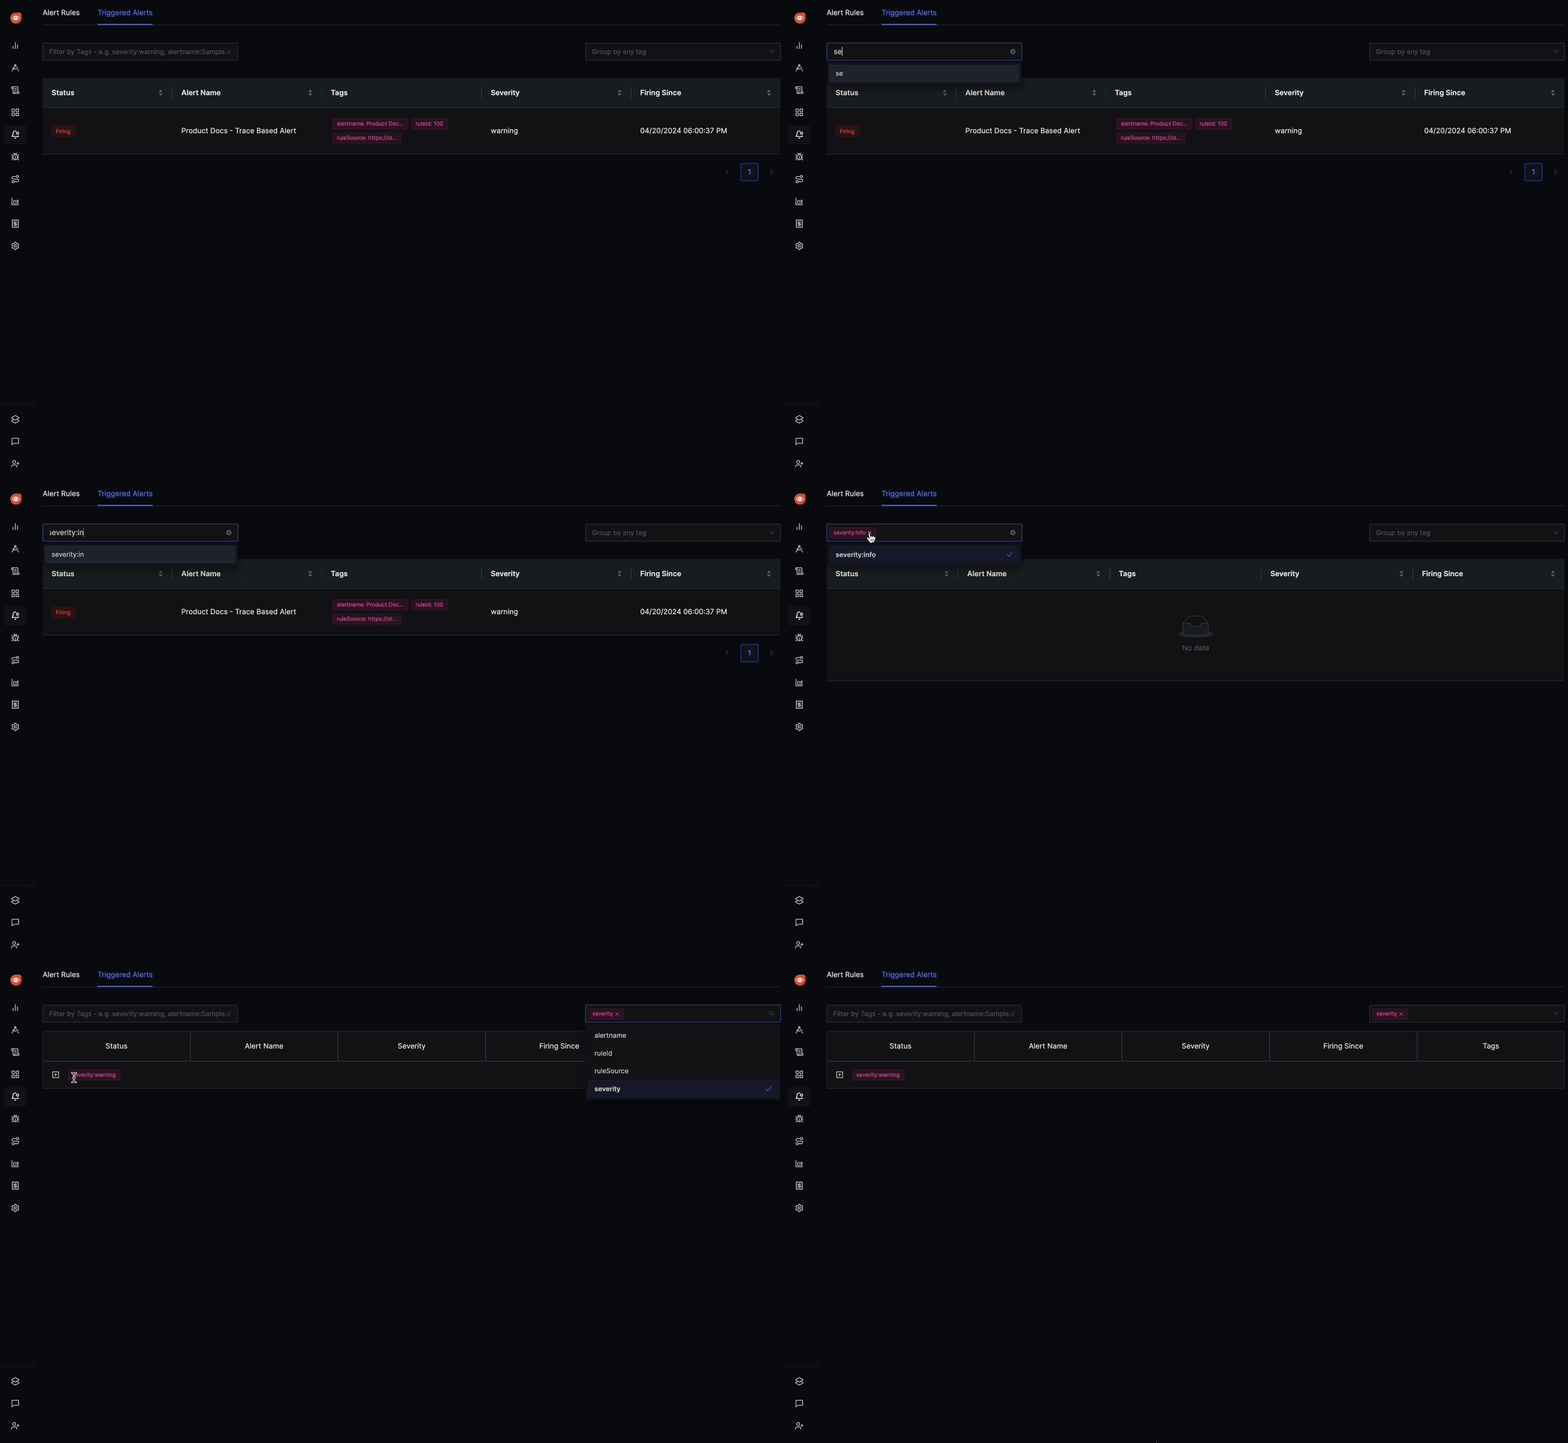
The Triggered Alerts Tab shows the currently firing alerts. It provides a real-time view of alerts, allowing you to quickly assess which alerts are active and require attention. Here's a detailed description of the tab's features:
Triggered Alert Columns
- Status: Shows whether the alert is currently firing. It can have values like "Firing."
- Alert Name: The name of the triggered alert.
- Severity: Indicates the severity of the triggered alert (e.g., "warning").
- Tags: Displays additional information or tags related to the alert.
- Firing Since: The timestamp indicating when the alert started firing.
Additional Triggered Alert Options
- Filter by Tags: You can apply filters to narrow down the list of triggered alerts based on specific tags.
- Group by: The "Group by" feature allows you to group alerts based on various criteria, such as alert name, severity etc.
Creating a New Alert in SigNoz
After setting up a new notification channel, you can create an alert by clicking the "New Alert" button in the Alerts Tab. You will see five types of alerts to choose from:
Anomaly-based Alert: Sends a notification when a condition occurs in metric data (e.g., CPU usage, memory utilization, request rates). You can set thresholds or rate-based conditions.
Metric-based Alert: Sends a notification when a condition occurs in metric data (e.g., CPU usage, memory utilization, request rates). You can set thresholds or rate-based conditions.
Log-based Alert: Sends a notification when a condition occurs in log data (e.g., specific patterns, keywords, error messages). You can set conditions based on log entries or error codes.
Trace-based Alert: Sends a notification when a condition occurs in trace data (e.g., latency, errors, specific trace events). You can define conditions to trigger the alert based on distributed system traces.
Exceptions-based Alert: Sends a notification when a condition occurs in exceptions data (e.g., application exceptions or errors). You can set conditions to trigger the alert when specific exceptions are detected.
These five types of alerts offer flexibility in monitoring different system aspects.
Repeat Notification
Configure repeat notifications to retrigger alerts at specified intervals if they remain unresolved. This feature allows you to receive follow-up notifications for ongoing issues.
To enable repeat notifications:
- Scroll to the bottom of the alert configuration
- Look for the "Repeat Notification" option
- Enable the toggle switch
- Set your desired interval
- Configure the condition:
- Firing: Send repeat notifications when the alert is actively firing
- No Data: Send repeat notifications when no data is received

Managing Alerts via the API
You can manage alert rules programmatically using the SigNoz API. Use GET /api/v1/rules to retrieve all alert rules and POST /api/v1/rules to create a new alert rule. This is useful for transferring alerts between SigNoz instances — retrieve the rules from one instance and create them on another.
For an infrastructure-as-code approach, you can also use the Terraform provider.
See the SigNoz API reference for full details on available endpoints and request formats.
