Overview
The Query Builder is SigNoz's structured query interface that combines the power of expression-based querying with intelligent auto-completion. Whether you're troubleshooting production issues, analyzing performance trends, or creating custom dashboards, the Query Builder gives you the flexibility to write sophisticated search expressions, aggregations, and filtering logic while providing contextual suggestions.
What you'll learn:
- How to filter data with precision using multiple criteria
- Advanced aggregation techniques for meaningful insights
- Performance optimization tips for large datasets
Quick Start
Your First Query
Let's start with a practical example. Suppose you want to find all error spans from your recommendationservice service in the last 6 hours:
- Navigate to Traces → Explorer
- Write filter expression:
service.name = 'recommendationservice' AND has_error = true - Set time range: Last 6 hours
- Run query to see results instantly
Use the keyboard shortcut CMD+ENTER (Mac) or CTRL+ENTER (Windows/Linux) to quickly execute Stage & Run Query.
Notice how you can write logical expressions directly, with auto-completion helping you discover available attributes and operators as you type. This basic pattern—filter, refine, visualize—forms the foundation of all Query Builder operations.
Filtering:
Filtering is your first line of defense against data overload. The Query Builder supports sophisticated filtering that goes beyond simple equality checks. Learn more about search syntax here
Aggregation & Grouping: Extracting Insights
Transform raw data into actionable insights using SigNoz's comprehensive aggregation functions.
Core Aggregation Functions
Statistical Functions
- Count: Total occurrences
count() - Count Distinct: Unique values
count_distinct(user_id, product_id) - Sum: Numerical totals
sum(bytes_sent) - Average: Mean values
avg(response_time_ms) - Min/Max: Range boundaries
min(latency),max(latency)
Advanced Functions
- Percentiles: Distribution analysis
p50(response_time_ms),p95(response_time_ms),p99(response_time_ms) - Rate: Total occurrences per time unit
rate() - Rate Sum: Change in totals
rate_sum(requests) - Rate Average: Change in averages
rate_avg(bytes_sent)
Grouping
Grouping transforms aggregations from single values into comparative datasets:
Real-World Examples: Cart Service Analytics
Example 1: Product Popularity Analysis
- Goal: Identify which products are being added to carts most frequently
- Insight: Top 5 most popular products being added to shopping carts
Example 2: User Shopping Behavior
- Goal: Analyze quantity patterns per user to identify bulk buyers
- Insight: Users adding large quantities (potential bulk buyers or businesses)
Example 3: Cart Activity Timeline
- Goal: Track cart additions over time to understand shopping patterns
- Insight: Shopping patterns throughout the day
Example 4: Average Quantity per Product
- Goal: Understand typical purchase quantities for different products
- Insight: Products typically bought in larger quantities vs. single items
How Grouping Handles Missing Values
When you group data and some records don't have the grouping key:
- These records get grouped under an "empty" value
- Your results will show groups with blank/empty labels
Example: Grouping users by department:
- Users with no department → grouped as "" (empty)
- Users with department → grouped normally ("Sales", "Marketing", etc.)
To exclude empty groups: Add key EXISTS to your search:
department EXISTS AND [rest of your query]
Important: We don't automatically exclude empty groups because sometimes you want to see them (e.g., finding users without departments).
Result Manipulation: Refining Your Analysis
Fine-tune your query results with result manipulation options that help you focus on what matters most.
Sorting & Limiting
Order By: Control result ordering
- Ascending:
avg(response_time) asc - Descending:
count() desc - Multiple:
sum(quantity) desc, userId asc
Limit: Focus on top results
- Top performers:
LIMIT 10 - Combined with ordering for "Top N" analysis
How Limit Works for Time Series
When you apply a limit to a time series query with group by fields, the limit determines which groups (series) are included in the results:
- Without limit or limit = 0: All groups matching your filter are included
- With limit > 0: Only the top N groups are included based on your ordering
Behind the Scenes
When a limit is specified with group by:
First, a query runs to identify the top N groups based on:
- Your aggregation (e.g.,
count(),sum(duration)) - Your ordering (e.g.,
order by count() desc) - The entire time range
- Your aggregation (e.g.,
Then, the time series query runs but only includes data for those top N groups
Example
Query: count() by service.name
Time Range: Last 24 hours
Limit: 5
Order: count() desc

Result: Time series data for only the 5 services with the highest total count over 24 hours
Important Notes
- The limit applies to the number of series (groups), not individual data points
- The "top N" selection is based on the aggregate value across the entire time range, not per time bucket
- Without group by, limit has no effect on time series queries
- Each group selected will have data points for all time intervals in your query range
Conditional Filtering with Having
Use Having clause to filter aggregated results:
Aggregation: count()
Group By: endpoint
Having: count() > 1000 AND count() < 5000
Result: Only endpoints with more than 1000 requests and less then 5000 requests
Common Having Patterns:
- High-traffic endpoints:
count() > 10000 - Slow operations:
avg(duration) > 500 - Error-prone services:
sum(errors) > 10
Combining Multiple Conditions:
Use parentheses with AND/OR operators to create complex conditions:
Having: (count() > 1000) AND (count() < 5000)
Note: Always use parentheses when combining conditions to ensure correct evaluation order, especially when mixing AND and OR operators.
Time Aggregation Windows
When querying time series data (traces, logs, or metrics), the system automatically manages the step interval (also known as aggregation interval) to ensure optimal performance and visualization. The step interval determines how data points are aggregated over time.
Automatic Step Interval Assignment
If you don't specify a step interval in your query, the system automatically calculates an optimal value based on:
- The time range of your query (end time - start time)
- The type of data you're querying (traces/logs vs metrics)
- A target of approximately 300 data points for optimal visualization
Step Interval Limits
To prevent performance issues and ensure responsive queries, the system enforces a maximum of 1,500 data points per series. If your specified step interval would result in more than 1,500 points, it will be automatically adjusted upward. The behavior is different by telemetry data type
Traces and Logs
Minimum step interval: 5 seconds
Calculation rules:
- For automatic assignment:
(time_range / 300) rounded down to nearest 5 seconds - For limit enforcement:
(time_range / 1500) rounded down to nearest 5 seconds - The step interval is always a multiple of 5 seconds
Examples:
- 1 hour query → 12 second steps (300 points) → rounded down 10 second steps
- 24 hour query → 288 second steps (~5 minute steps, 300 points)
- If you set 1 second steps for a 1 hour query (3,600 points), it adjusts to 2.4 seconds → 5 seconds
Metrics
Minimum step interval: 60 seconds
Note: The 60-second minimum for metrics is being updated. Soon, you'll be able to set step intervals matching your collection interval, as long as the query stays within the 1,500 point limit. Follow progress on issue #7248
Calculation rules:
- Base calculation same as traces/logs but with additional adjustments:
- For time ranges < 1 day: Multiple of 60 seconds
- For time ranges 1-7 days: Multiple of 5 minutes (300 seconds)
- For time ranges > 7 days: Multiple of 30 minutes (1,800 seconds)
Examples:
- 6 hour query → 72 seconds → 60 seconds (360 points)
- 3 day query → 864 seconds → 900 seconds (15 minutes, 288 points)
- 2 week query → 4,032 seconds → 3,600 seconds (1 hour, 336 points)
Best Practices
Let the system choose: For most use cases, don't specify a step interval. The automatic calculation provides a good balance between detail and performance.
Adjusting for more detail: If you need more granular data:
- Reduce your time range
- Or specify a smaller step interval (keeping in mind the 1,500 point limit)
Impact on Your Queries
- Filters: Applied regardless of step interval
- Group By: Each group counts toward the series limit
- Aggregations: Applied within each step interval window
Troubleshooting
"My specified step interval was ignored"
- Check if it would exceed 1,500 points
- Ensure it meets the minimum requirements (5s for traces/logs, 60s for metrics)
"I need more than 1,500 data points"
- Leave a comment here explaining your use case.
Legend Formatting
Customize the legend in your query's visual output to give more clarity, by formatting how grouped data will be labeled in your charts or graphs. We use the double curly braces - {{}} format to show the attribute.
Format: {{service.name}}
For example, if you have grouped by service.name attribute then you can write {{service.name}} in your legend. You can also add text along with the attribute like {{service.name}} - Application Service which will be shown as user-auth-service - Application Service.
You can combine multiple attributes and add custom text to create descriptive legends:
{{service.name}} ({{environment}})→payment-api (production)Service: {{service.name}} | Version: {{service.version}}→Service: user-service | Version: v2.1.0
Multi-Query Analysis: Advanced Comparisons
Combine multiple queries to perform sophisticated analysis that single queries cannot achieve.
Use Cases for Multiple Queries
Error Rate Calculation
- Query A: Count of error requests
- Query B: Count of all requests
- Formula:
(A/B) * 100(error percentage)
SLA Monitoring
- Query A: Requests under 200ms
- Query B: Total requests
- Formula:
(A/B) * 100(SLA compliance percentage)
Available Mathematical Functions in Formula
- Basic Operations:
+,-,*,/ - Logarithmic:
log,ln,log2,log10 - Exponential:
exp,exp2,exp10 - Trigonometric:
sin,cos,tan,asin,acos,atan - Mathematical:
sqrt,cbrt,abs - Utility:
now,degrees,radians
Multi-Query Best Practices
- Align time ranges: Ensure all queries use the same time window
- Consistent grouping: Use identical
Group Byclauses for meaningful comparisons
Multi-Query Analysis: Trace Operators
Combine Multiple Trace Queries to perform sophisticated analysis within a trace (Parent Child Relationships)
Use Cases for Multiple Queries
Direct Descendants
- Query A: Span with service.name = 'frontend' being the root span
- Query B: Span with service.name = 'customer' as the direct descendant of the 'frontend' span
- Trace Matching:
A => B(Direct Descendant)
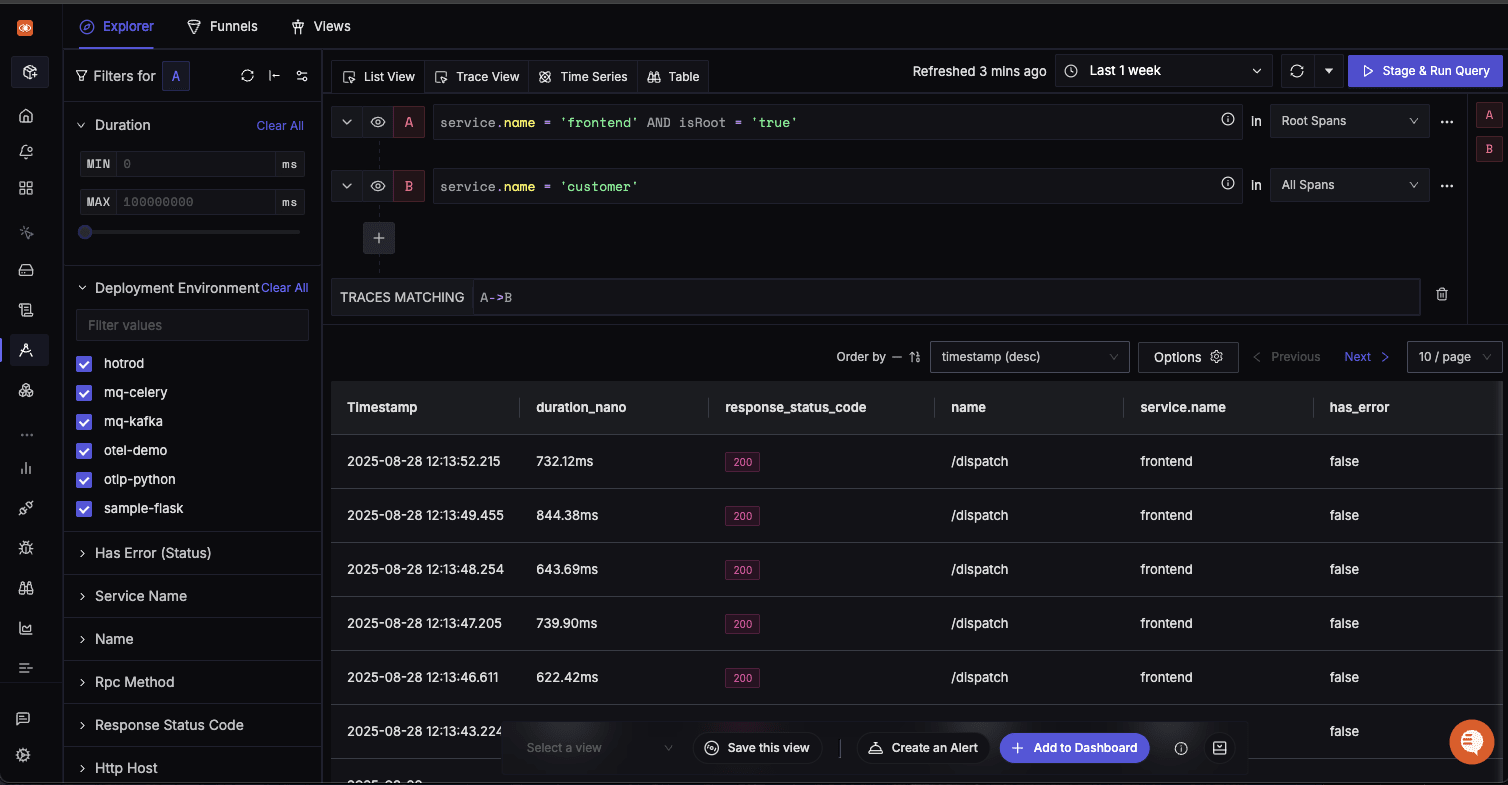
InDirect Descendants
- Query A: Span with service.name = 'frontend' as the root span
- Query B: Span with service.name = 'customer' and 'has_error = true' anywhere in the same trace as nth descendant
- Trace Matching:
A -> B(InDirect Descendant)
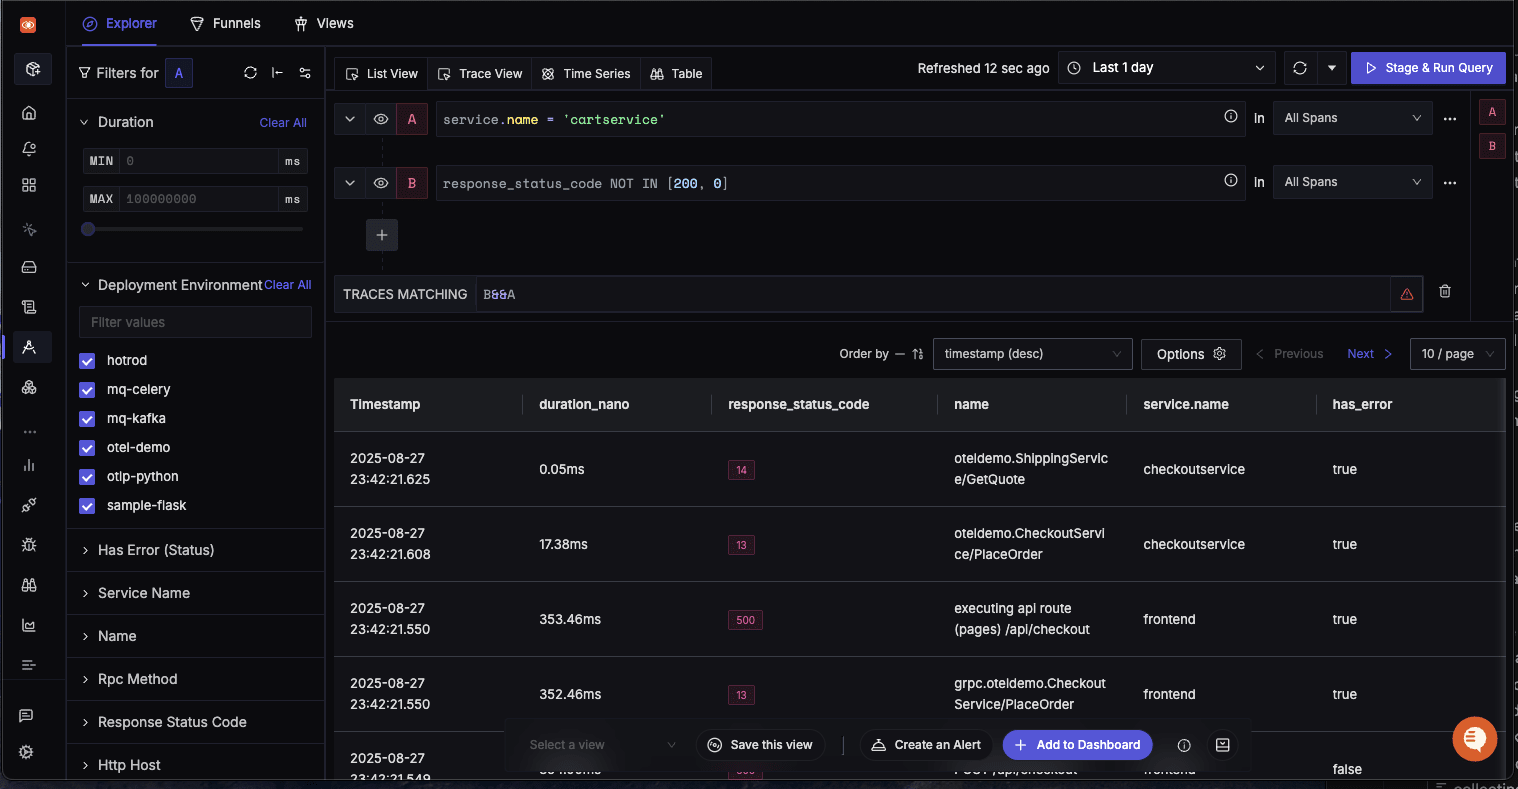
AND (Within a Trace)
- Query A: Span with service.name = 'cartservice'
- Query B: Any span in the trace with status_code != 200
- Trace Matching:
A && B(AND Operation)
Available Trace Operators
- Direct Descendant: '=>`
- InDirect Descendant: '->`
- AND: '&&`
- OR: '||`
- NOT: 'NOT`
Troubleshooting & Performance
Common Query Issues
Query Performance Problems
- Symptom: Slow query execution
- Potential Solutions:
- Check time range selection
- Use resource attributes in WHERE clauses
- Reduce GROUP BY cardinality
- Increase aggregation intervals
No Results Returned
- Check: Filter syntax and attribute names
- Verify: Time range includes expected data
- Confirm: Service/attribute existence in the time period
Unexpected Results
- Review: Filter combinations (AND vs OR logic)
- Validate: Aggregation functions match your intent
- Check: Group By attributes for proper categorization
Performance Optimization
Query
- Filter early: Apply restrictive filters first
- Limit scope: Use specific time ranges
- Resource attribute awareness: Leverage resource attributes to speed up queries
- Aggregation efficiency: Choose appropriate time windows
Dashboard Performance
- Adjust refresh frequency: Balance freshness with performance
- Optimize time ranges: Avoid unnecessarily wide windows
- Limit concurrent queries: Stagger dashboard loads
