Overview
This documentation provides detailed instructions on how to send logs to SigNoz using HTTP. Sending logs over HTTP offers flexibility, allowing you to create custom wrappers, directly transmit logs, or integrate existing loggers, making it a versatile choice for diverse use-cases.
Payload Structure
The payload is an array of logs in JSON format. It follows a structure similar to OTEL Logs Data Model.
Below is how the payload would look like:
[
  {
    "timestamp": <uint64>,
    "trace_id": <hex string>,
    "span_id": <hex string>,
    "trace_flags": <int>,
    "severity_text": <string>,
    "severity_number": <int>,
    "attributes": <map>,
    "resources": <map>,
    "body": <string>
  }
]
Here's a brief description of each field in the log record:
| Field Name | Description |
|---|---|
timestamp | Time when the event occurred |
trace_id | Request trace id |
span_id | Request span id |
trace_flags | W3C trace flag |
severity_text | The severity text (also known as log level) |
severity_number | Numerical value of the severity |
attributes | Additional information about the event |
resources | Describes the source of the log |
body | The body of the log record |
To know more details about the different fields in a log record, you can check this documentation.
Additional Keys
Any additional keys present in the log record, apart from the ones mentioned in the above payload structure, will be moved to the attributes map.
For example, if the JSON payload has fields like host, method etc. which are not a part of the standard payload structure:
[
  {
    "host": "myhost",
    "method": "GET",
    "body": "this is a log line"
  }
]
Then they will be moved to attributes and the log record will be finally treated as:
[
  {
    "attributes": {
      "host": "myhost",
      "method": "GET"
    },
    "body": "this is a log line"
  }
]
Sending Logs to SigNoz
Construct the cURL request
You can use cURL to send your logs. Below is a sample cURL request to send a JSON-formatted log record to a SigNoz Cloud ingestion endpoint:
curl --location 'https://ingest.<region>.signoz.cloud:443/logs/json' \
--header 'Content-Type: application/json' \
--header 'signoz-ingestion-key: <your-ingestion-key>' \
--data '[
    {
        "trace_id": "000000000000000018c51935df0b93b9",
        "span_id": "18c51935df0b93b9",
        "trace_flags": 0,
        "severity_text": "info",
        "severity_number": 4,
        "attributes": {
            "method": "GET",
            "path": "/api/users"
        },
        "resources": {
            "host": "myhost",
            "namespace": "prod"
        },
        "message": "This is a log line"
    }
]'<your-ingestion-key>: Your SigNoz Cloud ingestion key<region>: Your chosen region for SigNoz Cloud
Verify Your Request
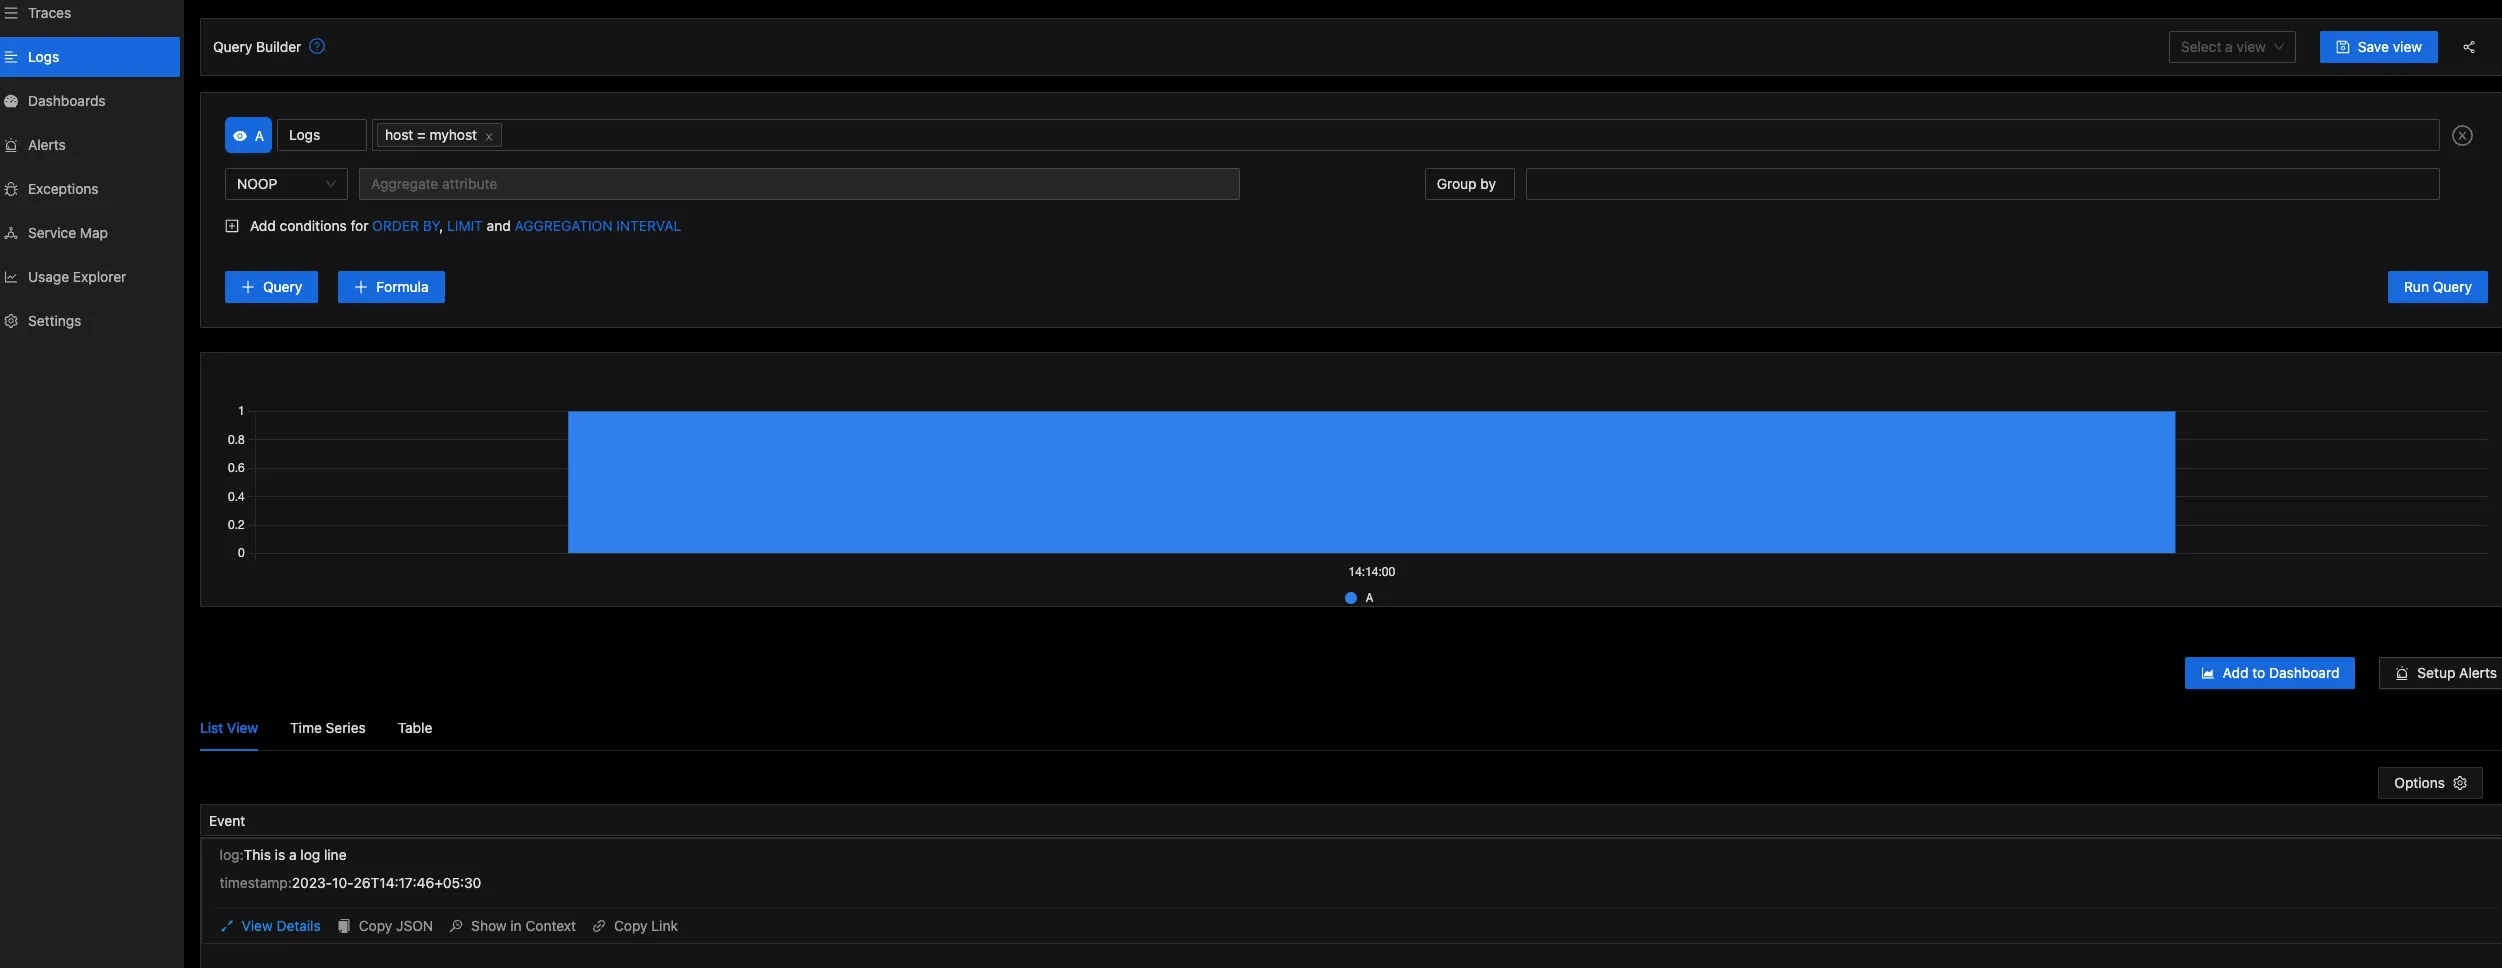
Once you run the above cURL request, you should see the logs in the SigNoz UI.
Install SigNoz
Follow this link to install self-hosted SigNoz.
Expose Port
Modify docker-compos-minimal.yaml to expose port 8082:
...
otel-collector:
    image: signoz/signoz-otel-collector:0.88.11
    command: ["--config=/etc/otel-collector-config.yaml"]
    volumes:
      - ./otel-collector-config.yaml:/etc/otel-collector-config.yaml
    ports:
      - "8082:8082"
...
Add Receiver
Add httplogreceiver in otel-collector-config.yaml:
receivers:
  httplogreceiver/json:
    endpoint: 0.0.0.0:8082
    source: json
...
Update the pipeline section:
service:
    ....
    pipelines:
        logs:
            receivers: [otlp, httplogreceiver/json]
            processors: [batch]
            exporters: [clickhouselogsexporter]
Restart the collector container.
Construct the cURL request
curl --location 'http://<IP>:8082' \
--header 'Content-Type: application/json' \
--data '[
  {
      "trace_id": "000000000000000018c51935df0b93b9",
      "span_id": "18c51935df0b93b9",
      "trace_flags": 0,
      "severity_text": "info",
      "severity_number": 4,
      "attributes": {
          "method": "GET",
          "path": "/api/users"
      },
      "resources": {
          "host": "myhost",
          "namespace": "prod"
      },
      "message": "This is a log line"
  }
]'
<IP> is the address of the system where your collector is running. To know more details about <IP>, checkout this troubleshooting guide.
Verify Your Request


