Overview
The Trace Details interface in SigNoz offers a powerful and intuitive interface to visualize and analyze the journey of a request through your system. By displaying detailed trace information, it enables you to quickly diagnose performance issues, pinpoint errors, and understand the intricate flow of operations in your systems. It is engineered to handle massive trace data supporting more than a million spans per trace making it an ideal solution for high-volume environments.
The Trace Details Page enables you to:
Visualizes the Entire Trace:
Render large traces seamlessly using synchronized flame graphs and waterfall charts.Drills Down Into Details:
Inspect individual spans to view metadata, span percentile, context, attributes and events associated with each span.Efficient Navigation and Search:
Use the dynamic search bar and filtering options to quickly jump to specific spans or error events making it easier to analyze and troubleshoot.Responsive and Scalable:
Handle traces from your architectures (monolithic or microservices) without performance lag, ensuring smooth and real-time analysis.
Key Concepts
Understanding the following concepts is essential for effectively using the Trace Detail feature:
Trace:
A trace represents the complete path a request takes through your system, helping you understand its flow across various components and services.Span:
Spans are the building blocks of a trace, representing individual units of work performed by an application or service during the request’s lifecycle. Each span is essentially a structured log message enriched with context, hierarchy, and correlations to help you pinpoint specific operations. Key components of a span includes:- Span Context:
Metadata that links spans across services, enabling distributed tracing and hierarchical structuring. - Span Attributes:
Key-value pairs that store additional metadata about the operation performed by the span. - Span Links:
References that establish causal relationships between spans, useful for correlating asynchronous operations or background tasks with the main trace. - Span Events:
Structured log messages that record important events at specific timestamps during the span's execution.
- Span Context:
Navigating the Trace Detail Interface
Opening a Trace
Select a Trace:
Choose a trace from your list of traces in the trace explorer which will open the Trace Detail page with the spans.
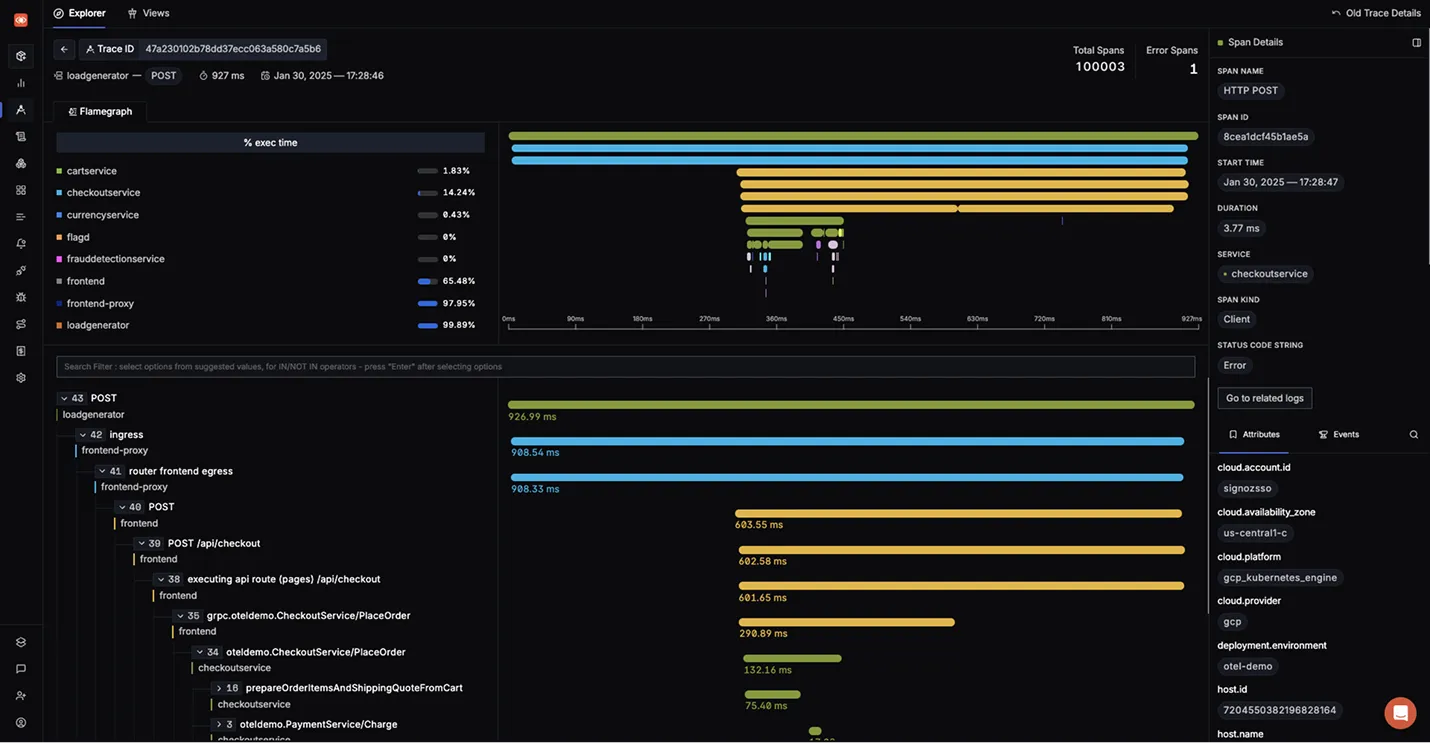
Initial Visualization:
Once loaded, you will see two synchronized views:
- Flame Graph:
Displays a hierarchical representation of the trace, showing the nested relationships between spans. - Waterfall Chart:
Provides a detailed timeline view, illustrating the sequence and duration of each span.
Detailed Span Inspection
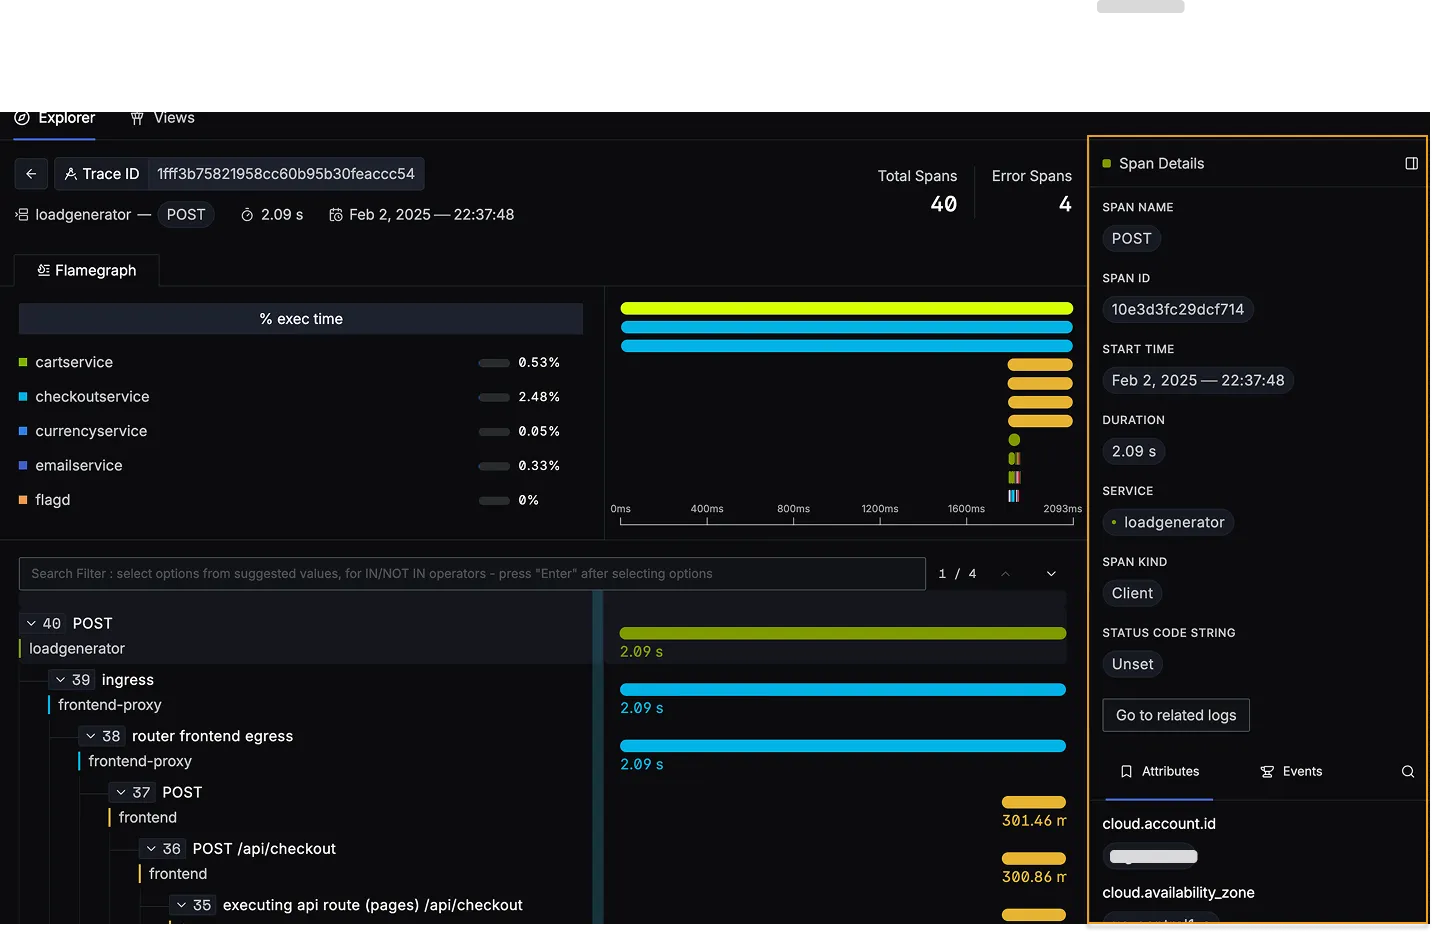
Expand Span Details:
Click on a specific span in either the flame graph or waterfall view to inspect detailed information, including:
- Span context and attributes.
- Related span links and events.
- The kind of the span (e.g., client, server, service, producer, or consumer etc.).
Span Percentile:
When you view a span's details, you can see its percentile compared to other spans from the same service over the past hour (for example, p50, p90, p95, p99). The percentile information may take a few seconds to appear after opening the span details. This helps you quickly identify performance outliers and understand where the span falls within the typical latency distribution.

Click on the percentile to view more details, including the exact p50, p90, and p99 values for the matching spans

You can further refine this analysis by adding more resource attributes to narrow down the set of similar spans, or by increasing the time range to observe percentile behavior over a longer period. This flexibility enables deeper, more targeted performance analysis.

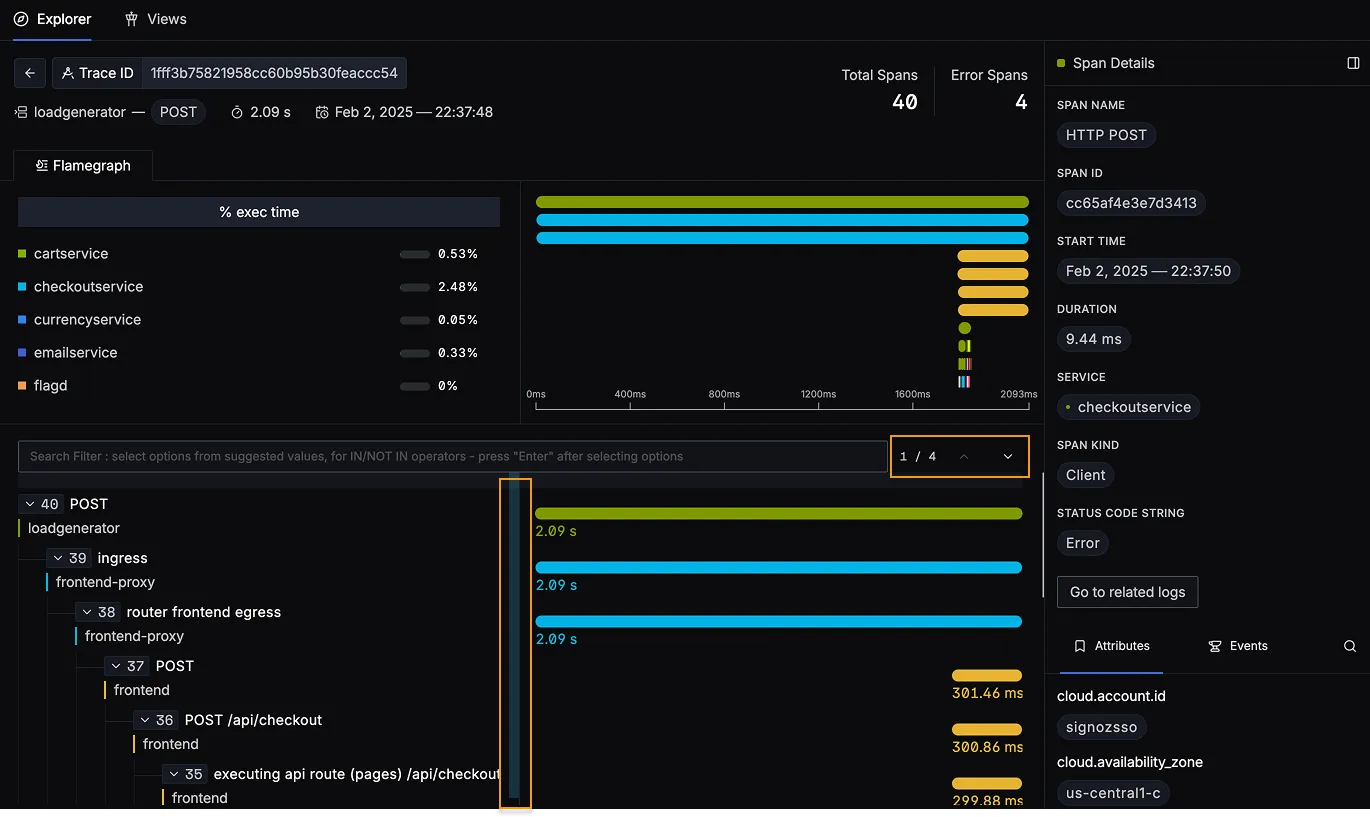
Synchronized Navigation:
The flame graph and waterfall views remain perfectly synchronized. Navigating in one view automatically updates the other, so you can always see where a span fits into the overall trace timeline.
Using the Search Filter Feature
The Trace Detail interface allows you to filter spans on basis of different for quick analysis while dynamically loading additional spans as you scroll, ensuring smooth navigation even in large traces.
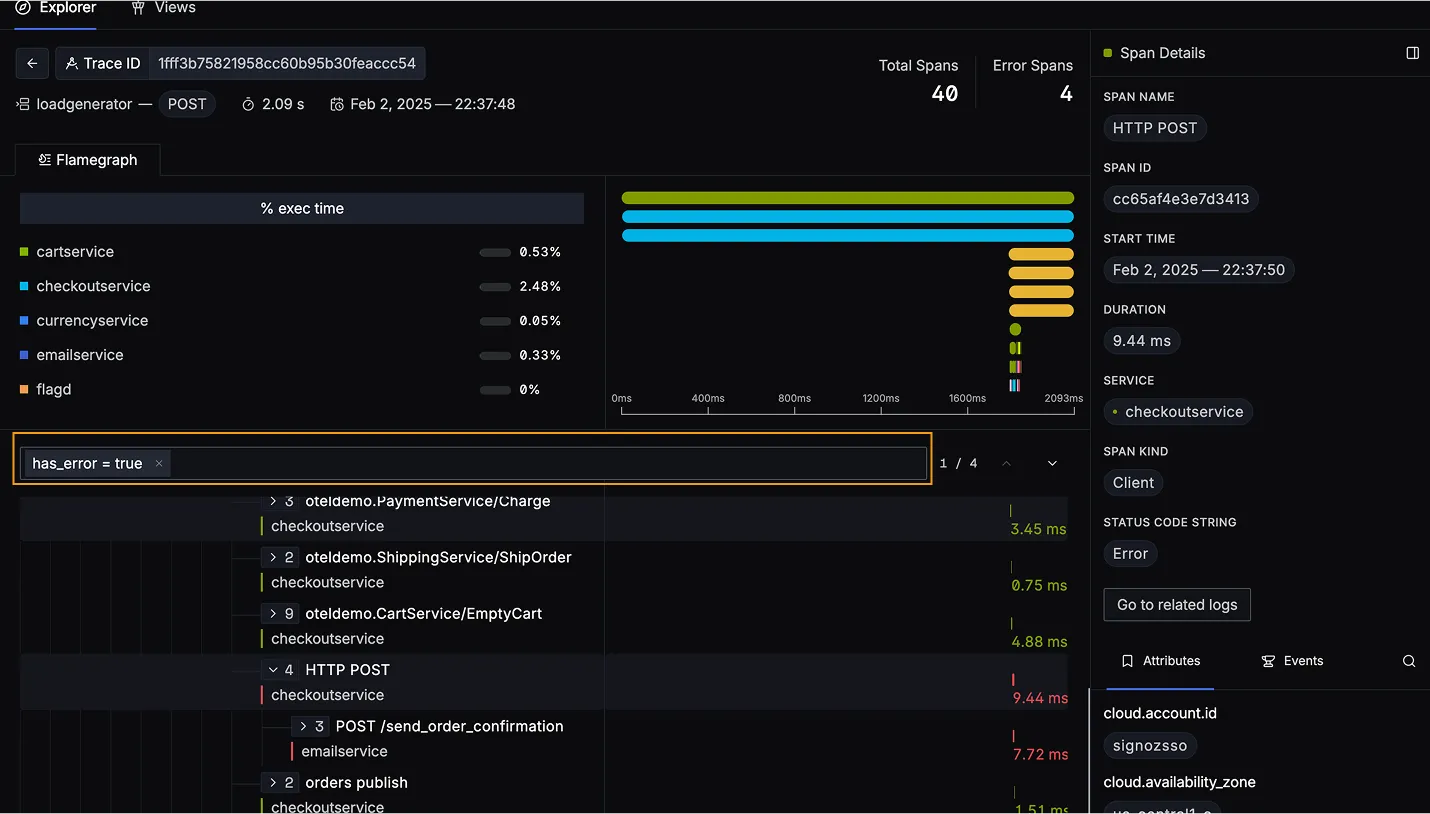
For example, to debug errors:
- Enable the
has_error = truefilter to highlight error spans. - Click on an error span to view associated error messages and logs.
- Analyze the affected services and identify bottlenecks causing failures.
Adjusting the Interface for Better Visibility
Resizable Span Names Anchor:
If span names or details appear cramped, use the draggable window to adjust the size of the display area. This ensures that you can comfortably read and analyze all information.
The Trace Detail feature in SigNoz empowers you to effortlessly navigate, analyze, and debug complex traces across your systems—providing the insights necessary to debug issues, optimize performance, and understand your system's behavior in real time. Upcoming updates will introduce more detailed performance metrics, integrated span event visualizations, and granular filtering options for even deeper trace analysis.
