Azure Observability - Mastering Cloud Monitoring
Azure Observability transforms how you monitor and manage your cloud infrastructure. It provides deep insights into your applications, infrastructure, and network — empowering you to detect and resolve issues faster than ever before. This comprehensive guide will walk you through the essentials of Azure Observability, from its core components to advanced implementation techniques.
What is Azure Observability and Why It Matters
Azure Observability is an advanced approach to understanding and monitoring the performance, behaviour, and health of your cloud environment. Unlike traditional monitoring, which focuses on collecting predefined metrics and logs, Azure Observability provides a richer, more comprehensive view of your systems. It gives you insights into individual metrics and how different parts of your environment interact, making it easier to detect issues and optimize performance.
Key components of Azure Observability include:
Azure Monitor: This is the core tool for observability within Azure. Azure Monitor collects and analyzes data from various Azure resources, applications, and virtual machines. It provides a centralized platform for gathering logs, metrics, and traces, allowing for real-time monitoring and alerting.
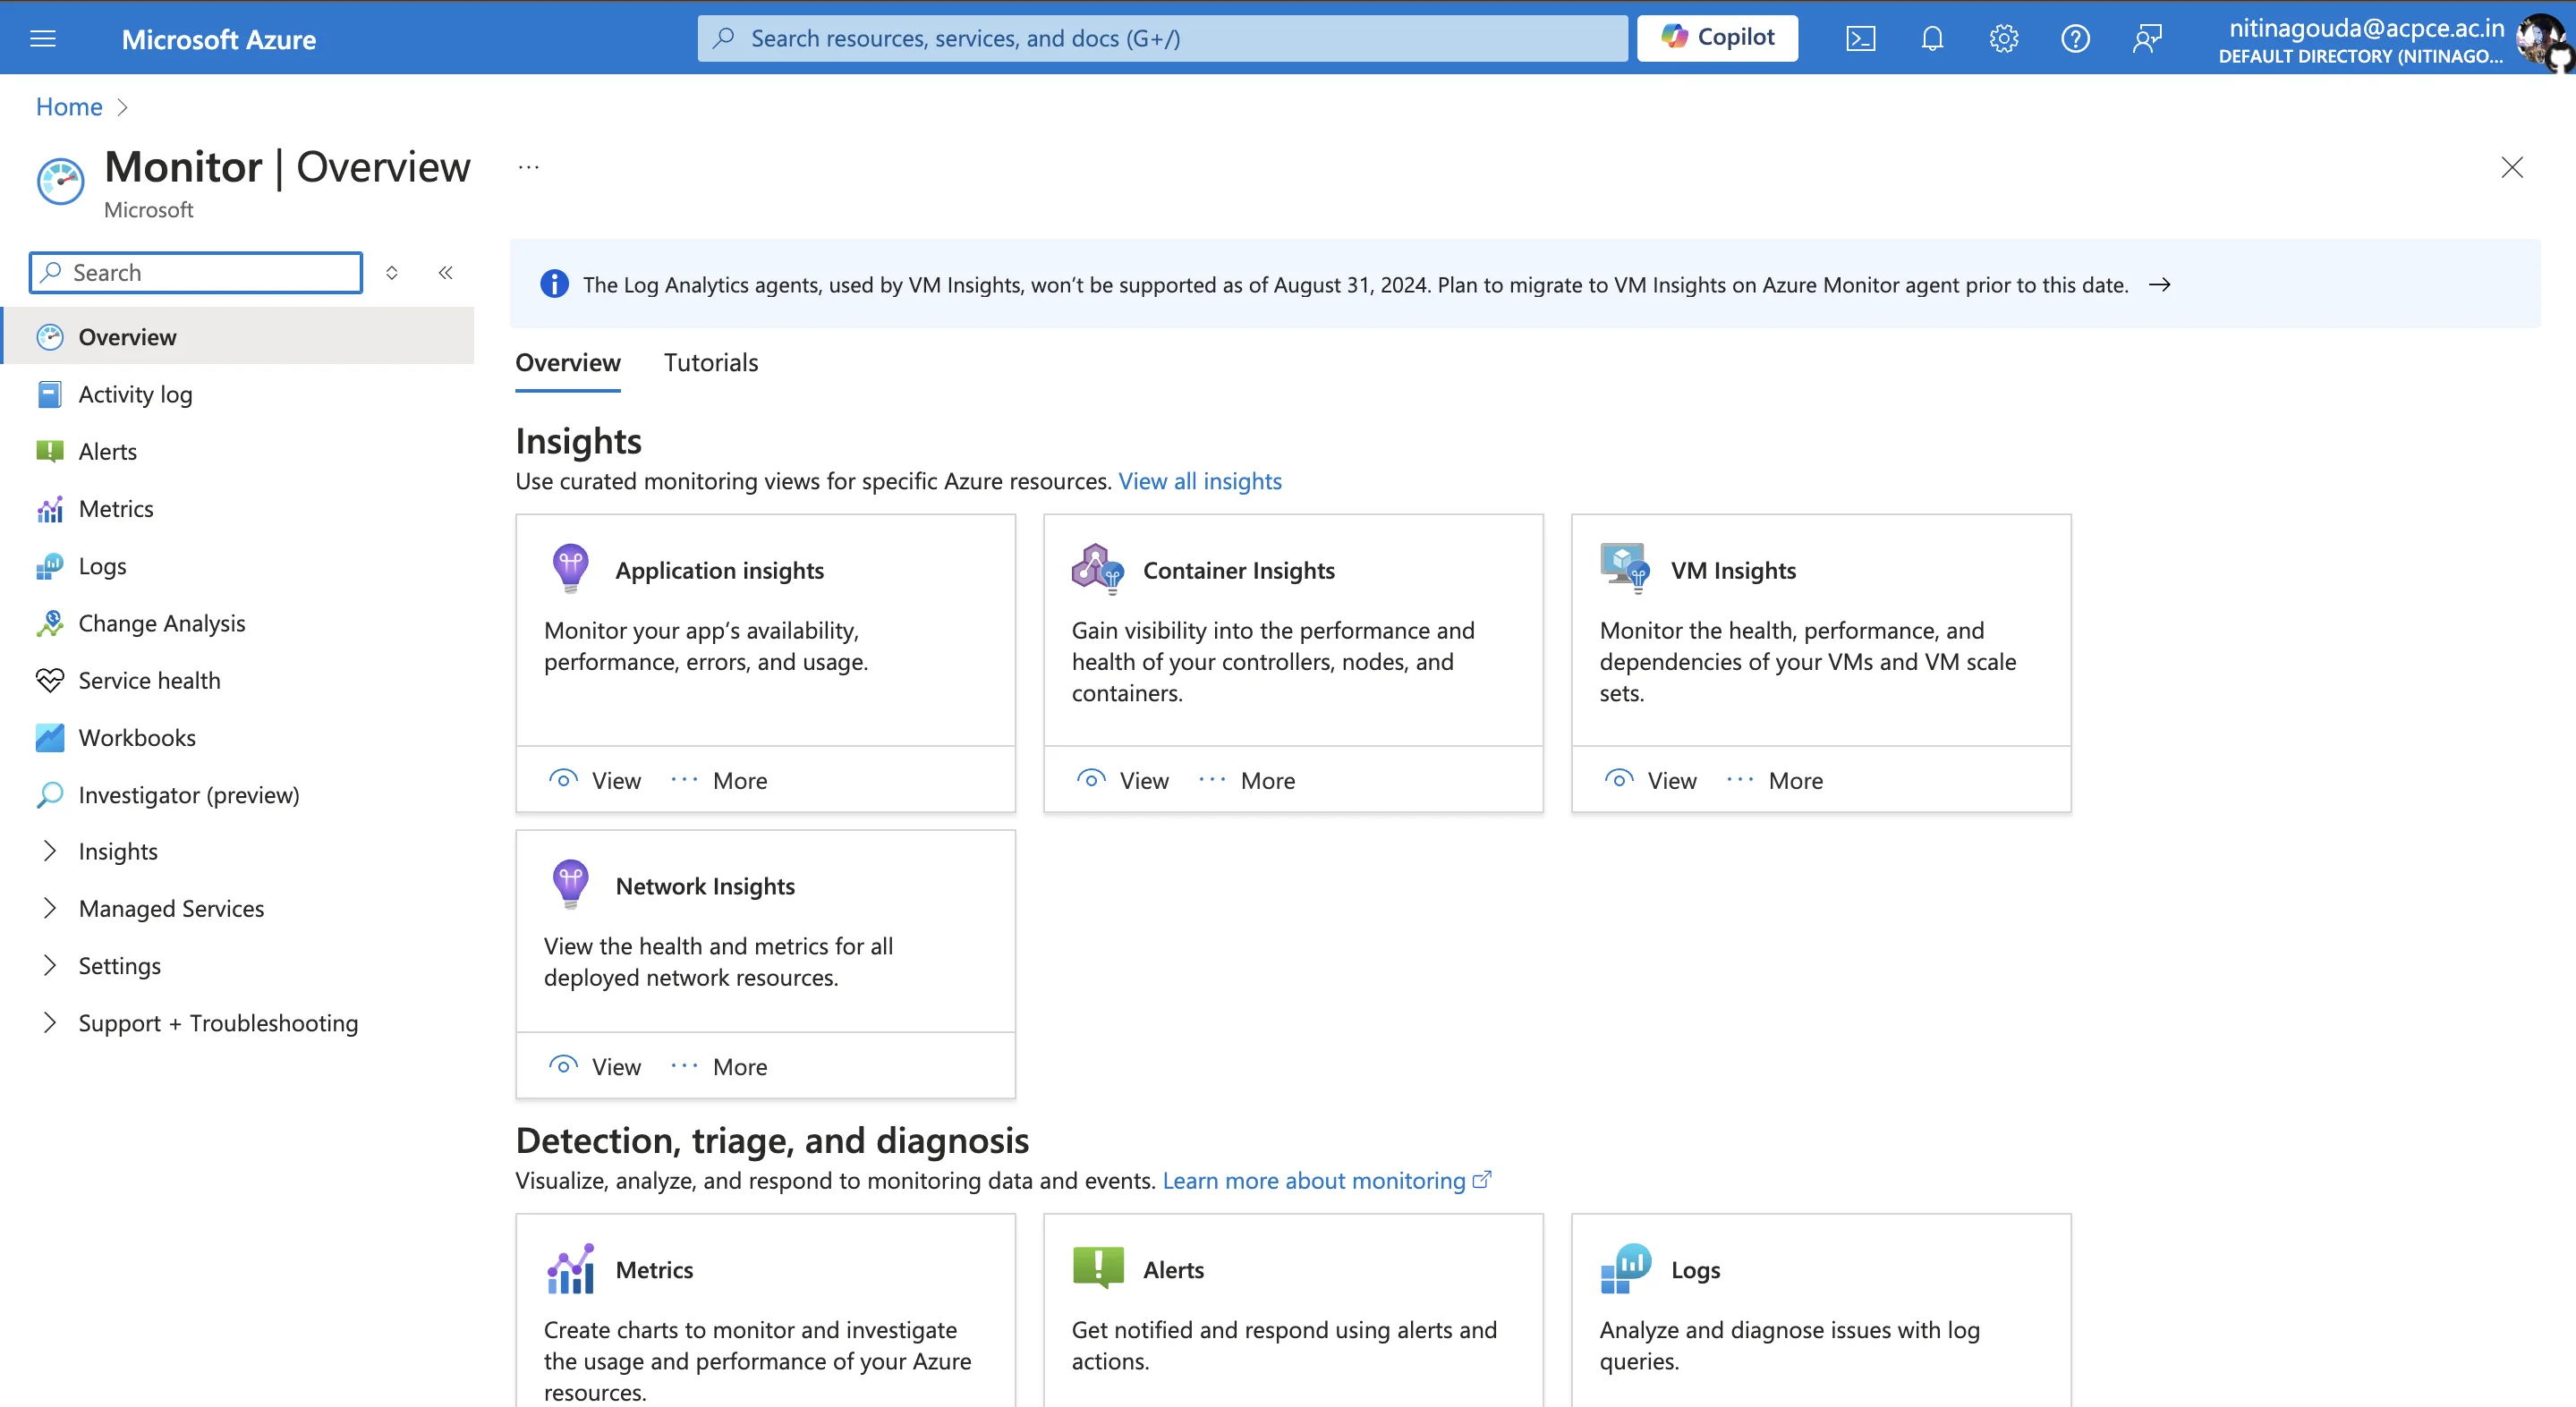
Azure Monitor Application Insights: Application Insights focuses specifically on application performance monitoring (APM). It allows you to track the performance of your applications in detail, providing insights such as request response times, user interactions, and error rates. This helps you ensure your applications run efficiently and meet user expectations.
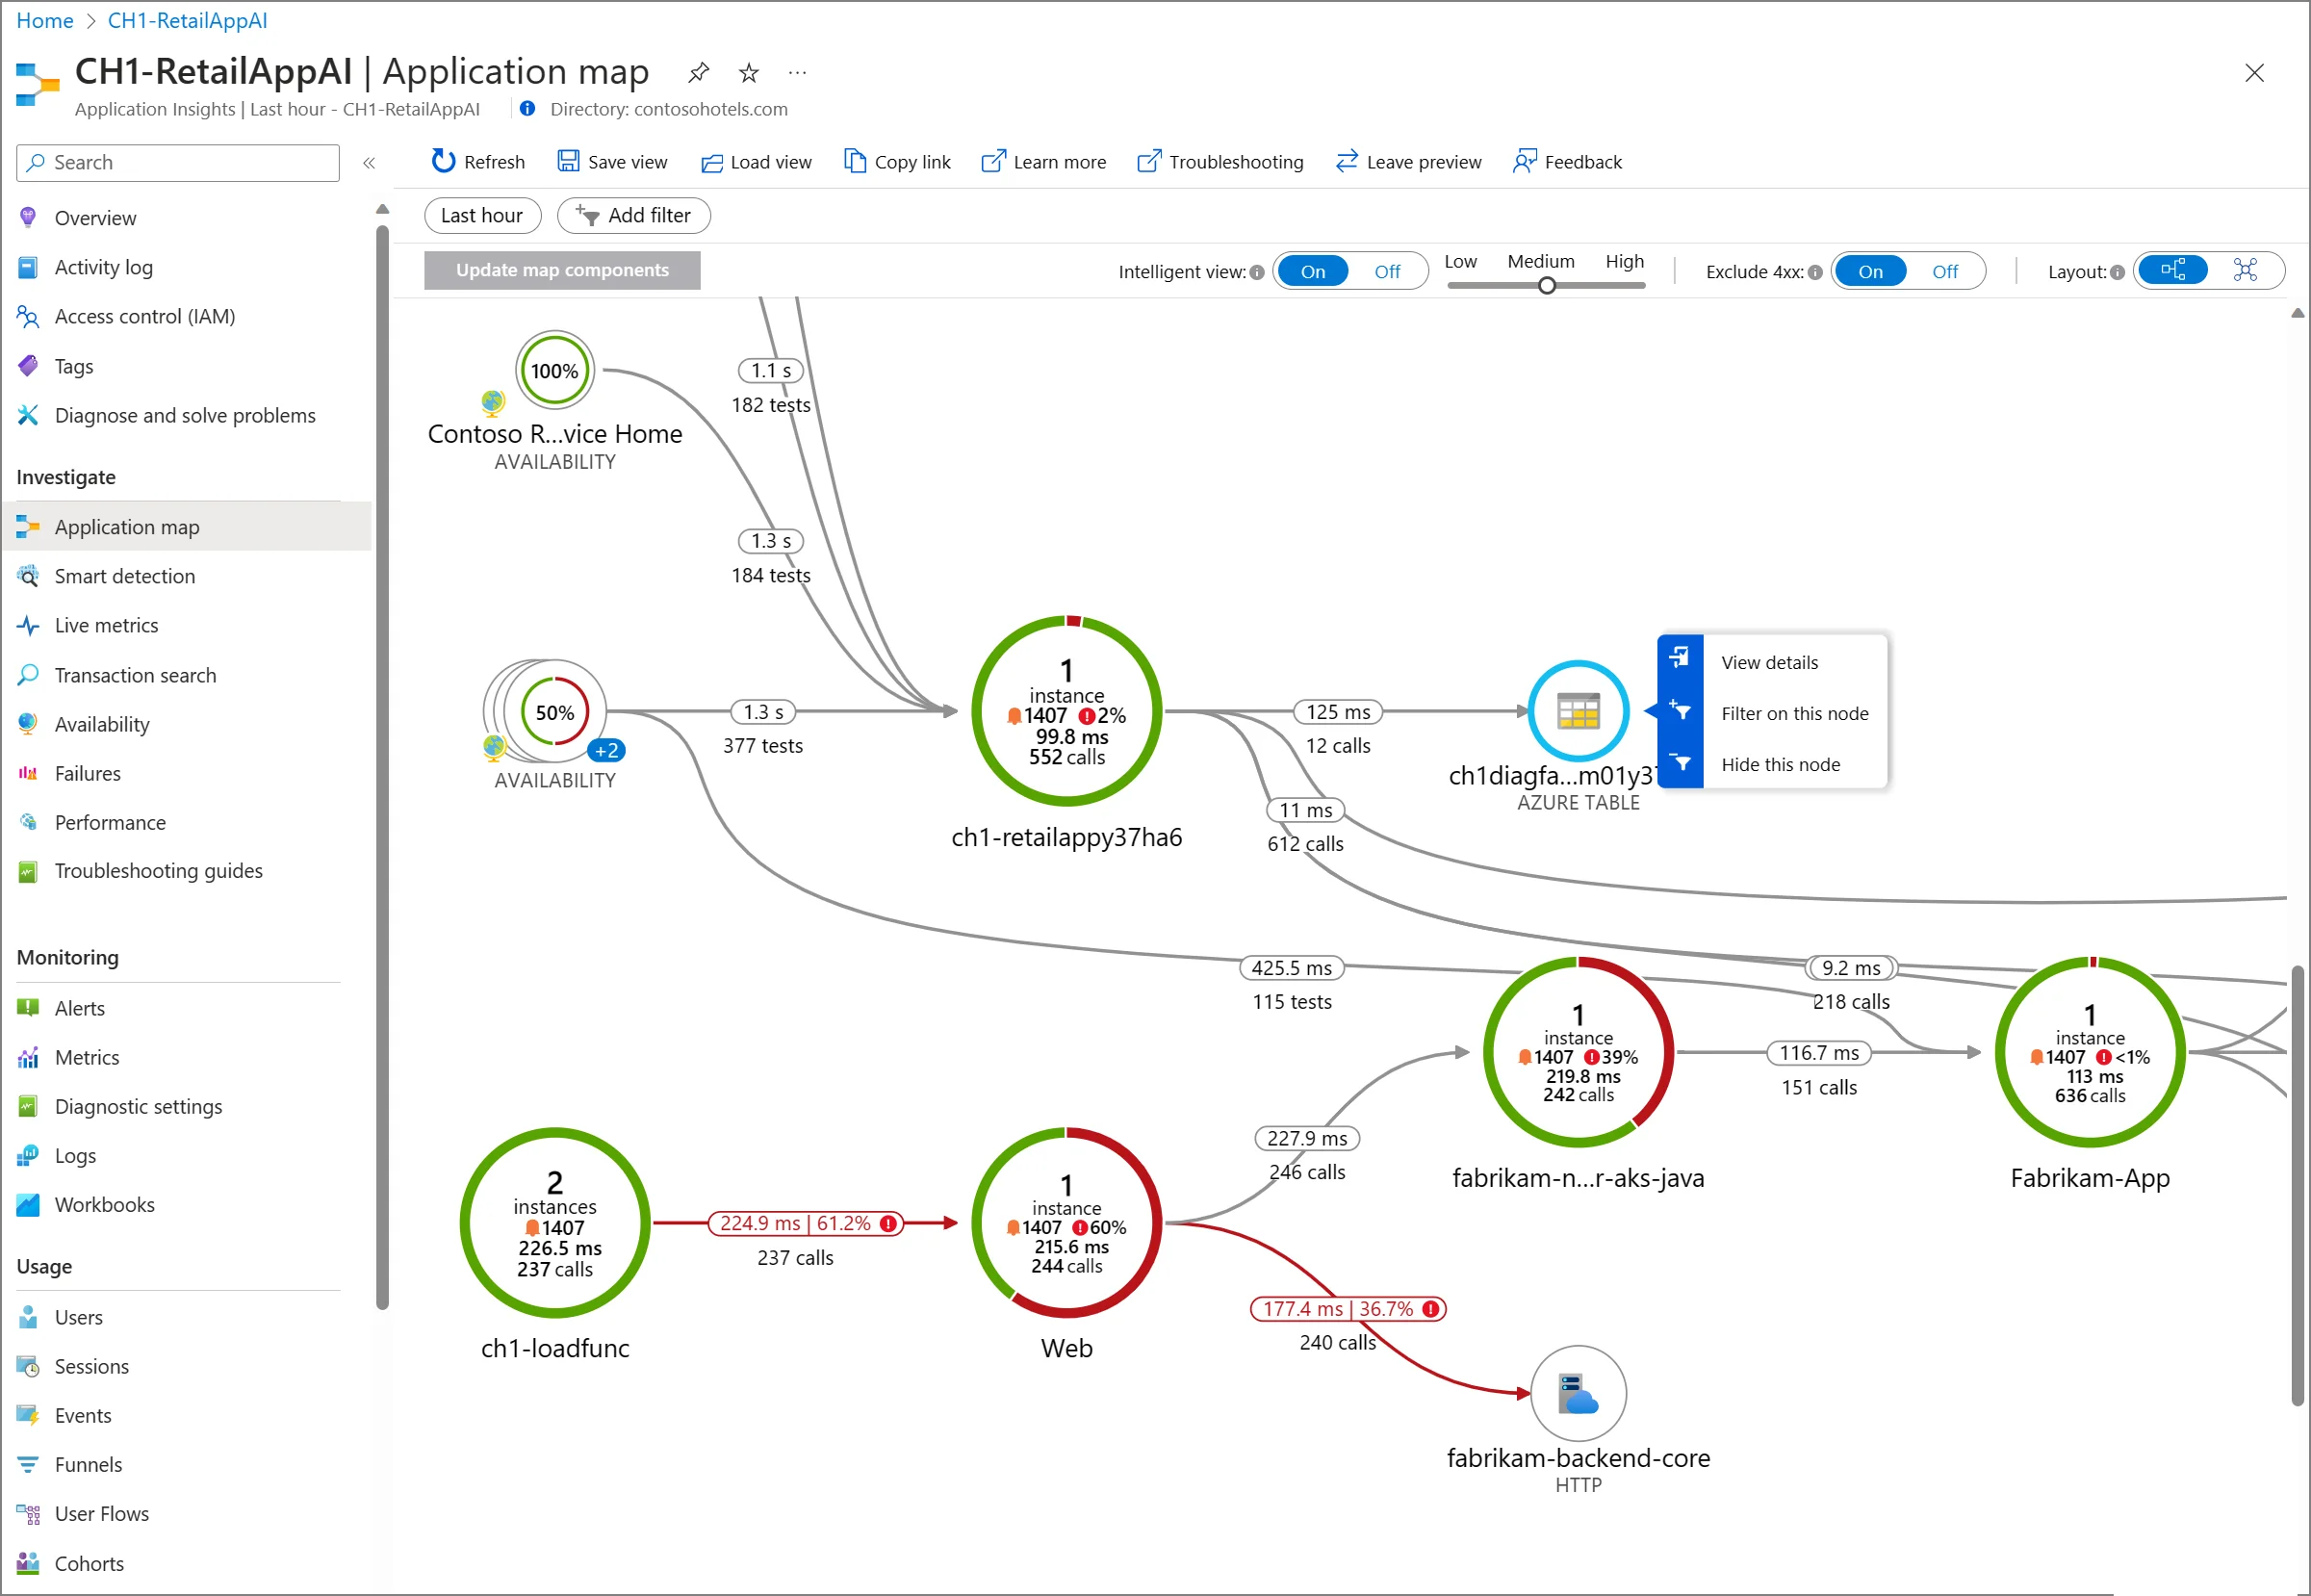
Application insights ~ From Azure Docs
Implementing observability in Azure environments offers several benefits:
- Proactive issue detection: Azure Observability allows you to spot issues before they impact end users. Monitoring key performance indicators (KPIs) and setting up alerts allows you to spot anomalies early on and take action to avoid downtime or performance degradation.
- Faster troubleshooting: Observability tools allow you to pinpoint the root cause when issues arise. By correlating logs, metrics, and traces, you get a complete picture of the issue, making it easier to diagnose and resolve problems faster than traditional monitoring would allow.
- Improved performance: With continuous monitoring and real-time insights, you can optimize your applications by identifying bottlenecks and areas for improvement. Whether it's tuning resource allocation or refining application code, observability gives you the data needed to enhance performance.
- Enhanced decision-making: Azure Observability supports data-driven decisions around scaling, resource allocation, and infrastructure management. Instead of guessing, you can rely on insights from observability tools to determine when to scale up or down, ensuring cost-efficiency and performance balance.
Unlike traditional monitoring, which often provides a fragmented view of your environment, Azure Observability gives you a holistic and interconnected view. This means you can see how different components of your system—like applications, databases, and virtual machines—interact. This interconnected data allows for deeper understanding, making it easier to maintain system health, detect and prevent issues, and continuously improve application performance.
Understanding the Azure Observability Landscape
Azure Monitor forms the foundation of Azure observability. It collects and analyzes telemetry data from various sources, providing a unified platform for monitoring your entire Azure environment.
Telemetry data is the key to understanding the performance and health of your systems. In Azure Observability, this data is categorized into three main types:
- Metrics: Metrics are numerical values that measure the state of a specific aspect of your system at a given moment. Examples include CPU usage, memory consumption, and request response times. Metrics provide real-time insights into how your system is performing at any particular point in time, helping you identify trends or spikes in resource usage.
- Logs: Logs are records of events that happen on your system. They record information regarding system activities, such as when a service begins or ends, when mistakes occur, or when particular thresholds are met. Logs give a thorough historical record that is essential for troubleshooting, auditing, and determining how your system acted over time.
- Traces: Traces give a thorough record of how a request moves through your system. They provide insight into how various components in your system interact, allowing you to understand how data flows across services and detect bottlenecks or sites of failure. This is particularly useful in microservices systems, where queries may span numerous services.
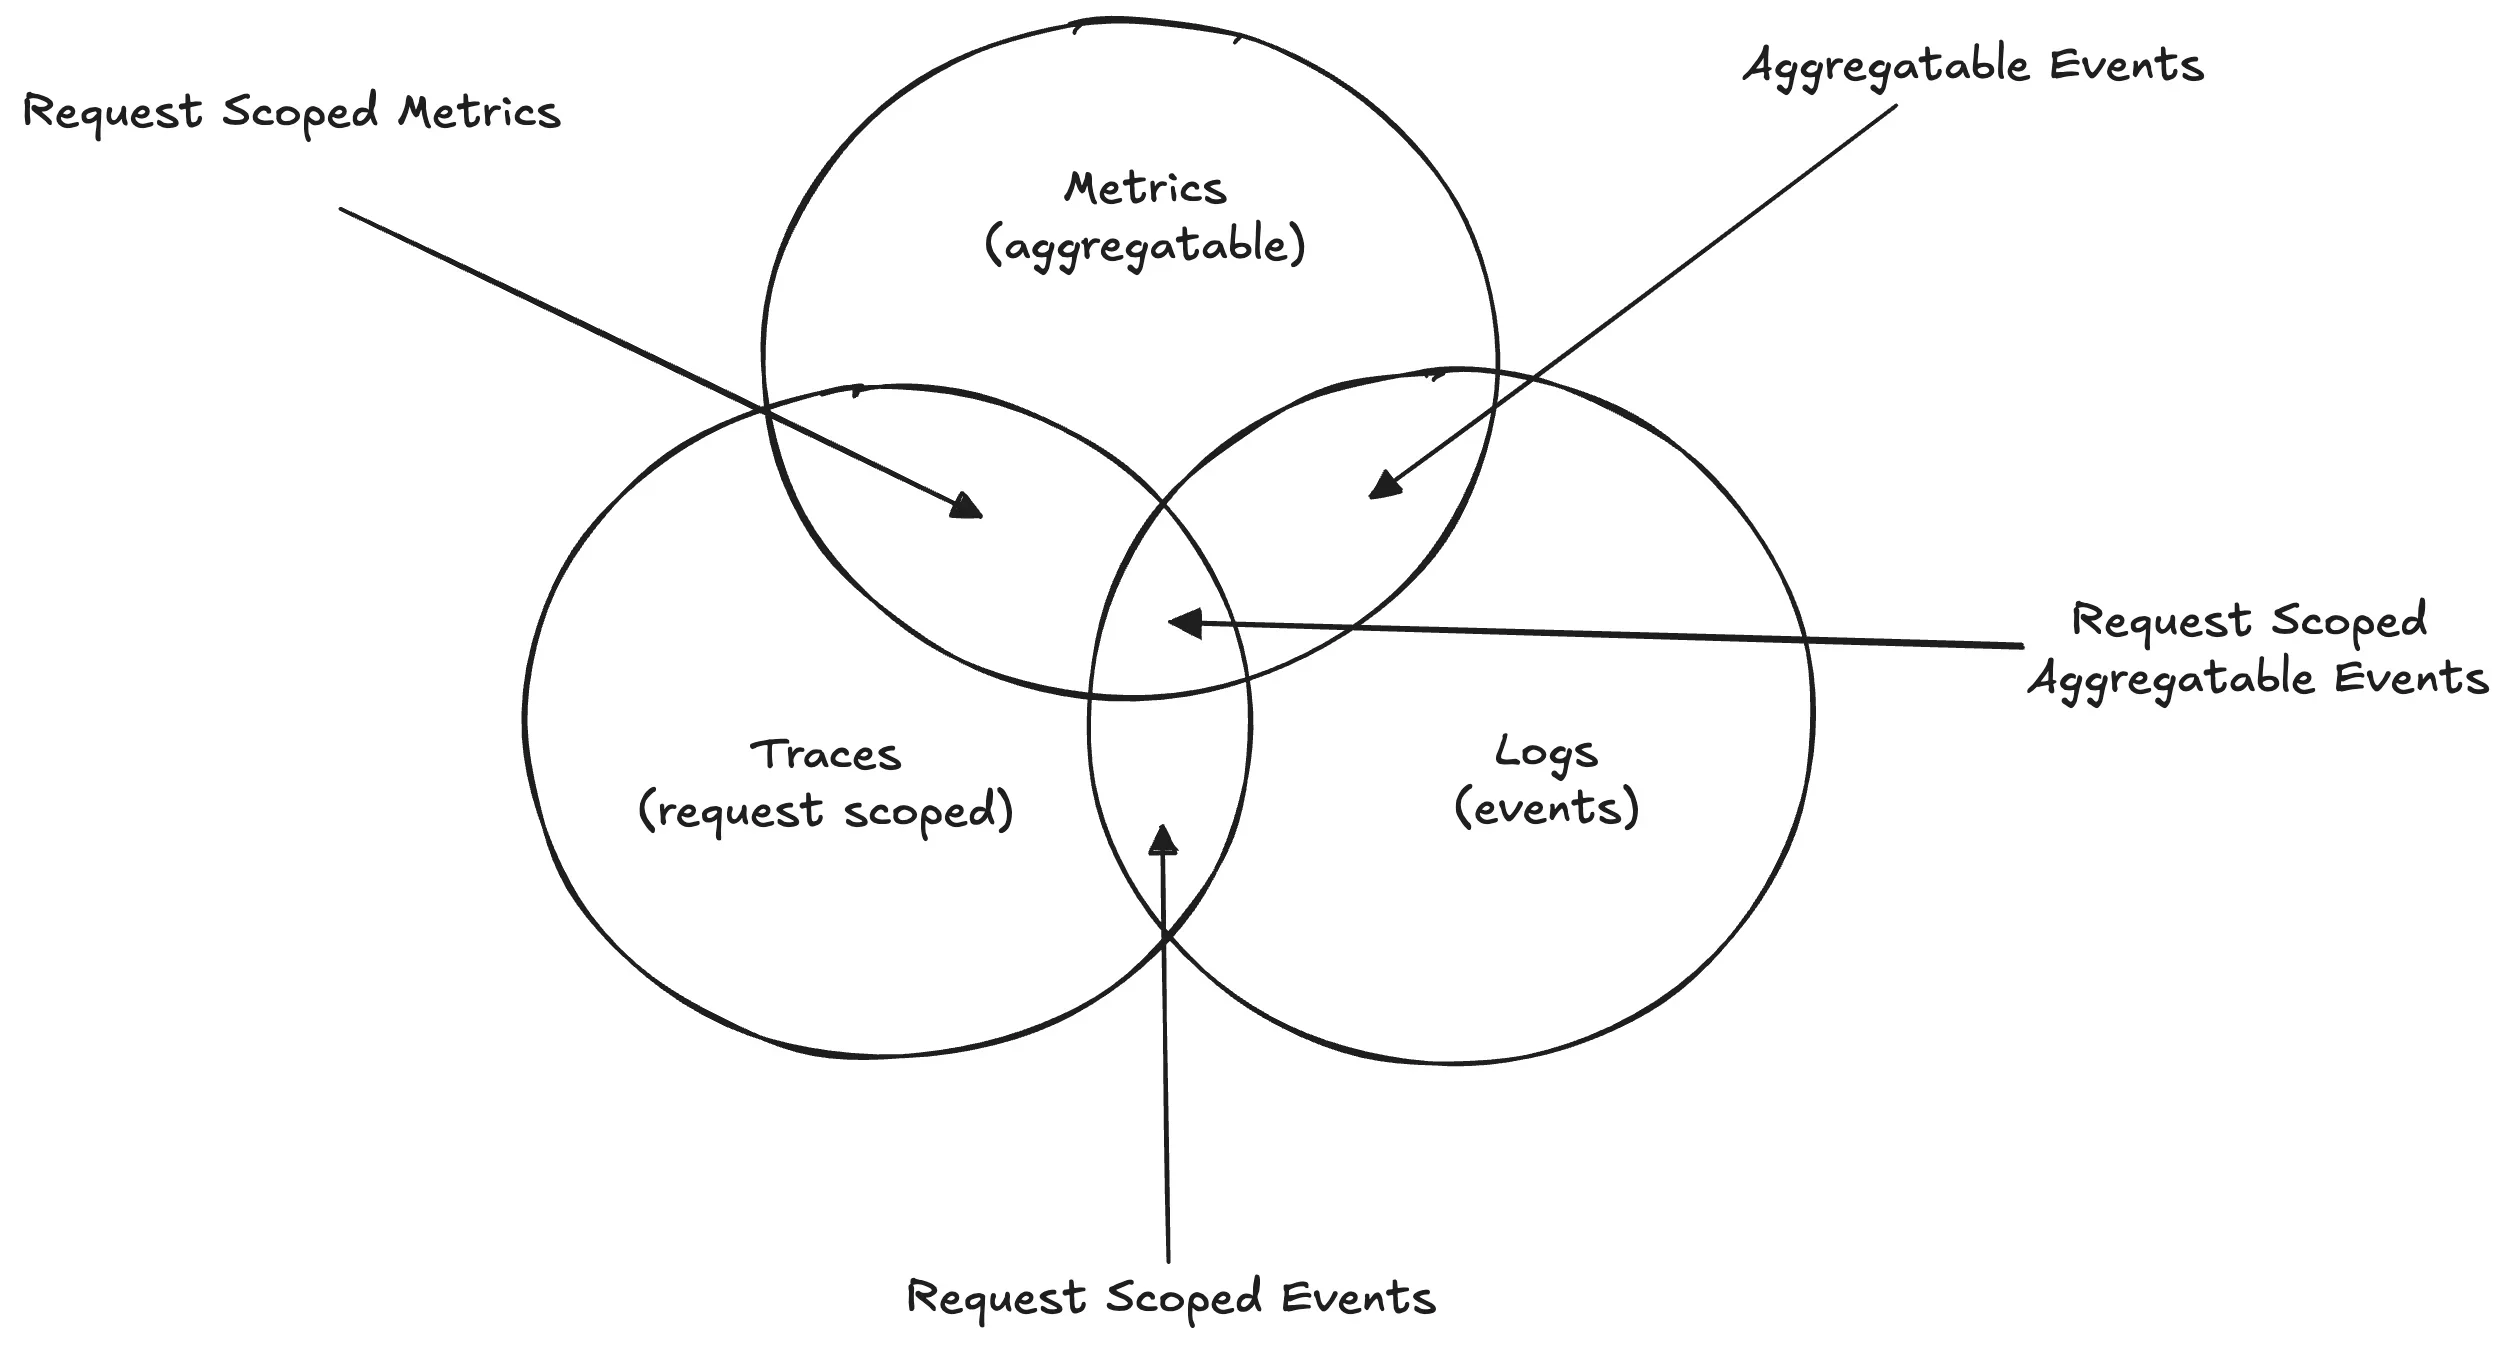
Azure Observability also integrates with Azure Resource Health and Azure Service Health to provide additional layers of visibility. These tools focus on the availability and health of Azure services and your specific resources:
- Azure Resource Health: Offers insights into the current health status of your Azure resources, helping you diagnose and mitigate issues specific to your virtual machines, databases, or storage accounts. It provides information on outages or performance degradation at the resource level, enabling proactive management.
- Azure Service Health: Focuses on the overall health of Azure services across regions. It alerts you to any service disruptions or issues affecting Azure globally, so you can stay informed about events that might impact your systems.
Key Observability Patterns in Azure
To make the most of Azure Observability, it's essential to implement specific patterns that enhance visibility, troubleshooting, and system optimization. These patterns allow you to understand your systems at a deeper level and respond proactively to issues before they impact your users. Here are some of the key observability patterns to focus on:
Distributed tracing for microservices architectures: In microservices architectures, applications are often composed of multiple independent services that work together to fulfill requests. Distributed tracing helps you follow a request as it flows through each of these services. By capturing the full journey of a request, you can:
- Identify bottlenecks or slow services that affect overall performance.
- Pinpoint failures or errors in specific parts of your architecture.
- Understand how various services are interacting and dependent on one another.
Distributed tracing is extremely useful for troubleshooting complicated, distributed systems, where errors in one service might have far-reaching consequences throughout the application. Distributed tracing is typically done by instrumenting your services with tracing libraries or agents that generate trace data for each request. This data is then collected and visualized in tools like Jaeger, Zipkin, or Azure Monitor, allowing you to track the flow of requests across microservices and identify performance issues or failures.
Centralized logging and log analytics: Managing logs from multiple resources, applications, and environments can be overwhelming without a centralized logging approach. By aggregating all your logs in a single location, such as Azure Monitor's Log Analytics, you can:
- Correlate events across different services, making it easier to troubleshoot complex issues.
- Use queries and filters to extract meaningful insights from large volumes of log data.
- Set up alerts based on log patterns, such as repeated errors or failure events.
Centralized logging provides a unified view of your system’s behaviour and simplifies the task of identifying and responding to issues. To setup your own Centralized logging you can check the steps here.
Real-time metrics and dashboards: Real-time metrics are crucial to monitor the health of your systems effectively. With Azure Monitor, you can create custom dashboards that visualize key performance indicators (KPIs) such as CPU usage, memory consumption, or application response times. These dashboards allow you to:
- Spot trends and anomalies quickly.
- Keep track of critical performance metrics in real time.
- Customize your views to focus on the data most relevant to your team.
Dashboards help you monitor your environment at a glance, making it easier to react swiftly to changes or potential issues.
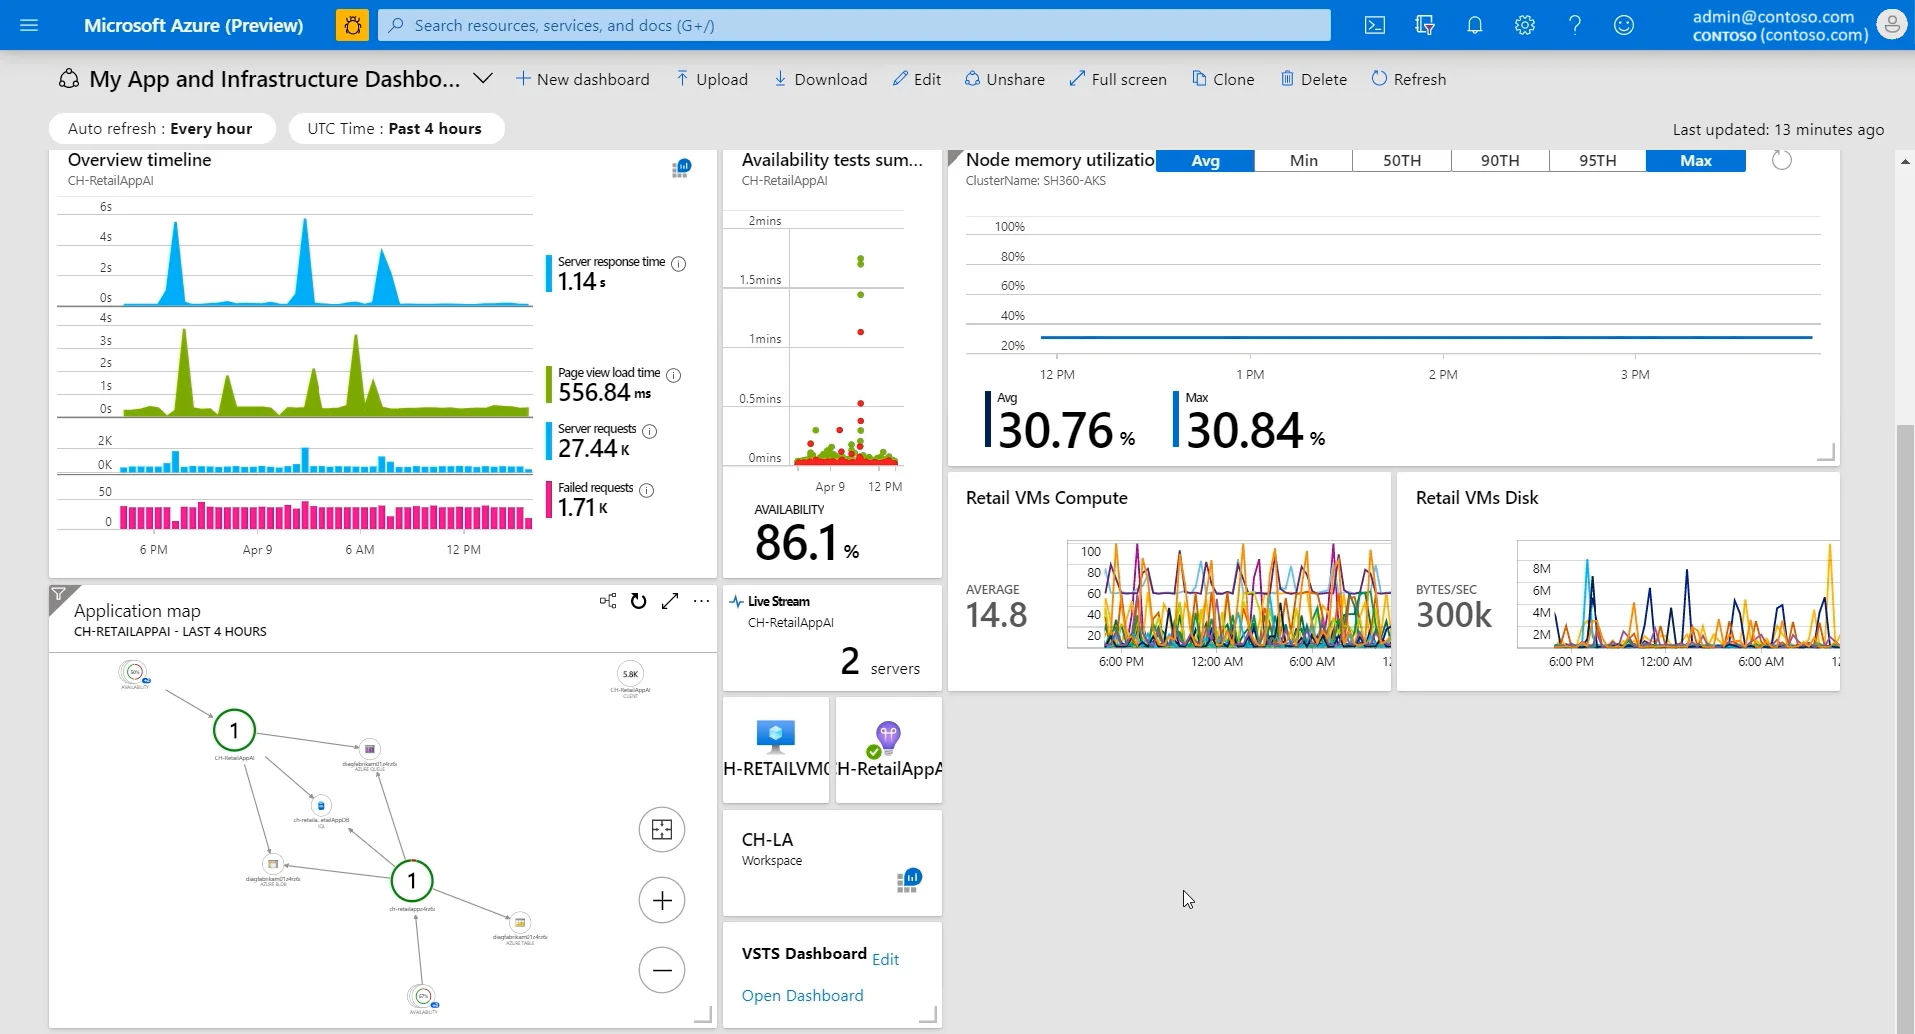
Azure Dashboard ~ From Azure Docs Anomaly detection and predictive analytics: Azure’s advanced observability tools use machine learning algorithms to automatically detect unusual patterns or behaviours in your system. By implementing anomaly detection and predictive analytics, you can:
- Identify performance issues or system degradation before they become critical.
- Leverage predictive insights to forecast potential outages or resource shortages.
- Automatically trigger alerts or remediation actions when anomalies are detected.
This proactive approach ensures you can fix problems before they affect end users, improving system reliability and reducing downtime. To learn more about it, you can see the documentation page here.
Implementing Azure Observability: A Step-by-Step Guide
Follow these steps to set up Azure Observability for your environment:
Set up Azure Monitor:
- Navigate to the Azure portal: Log in to the Azure portal.
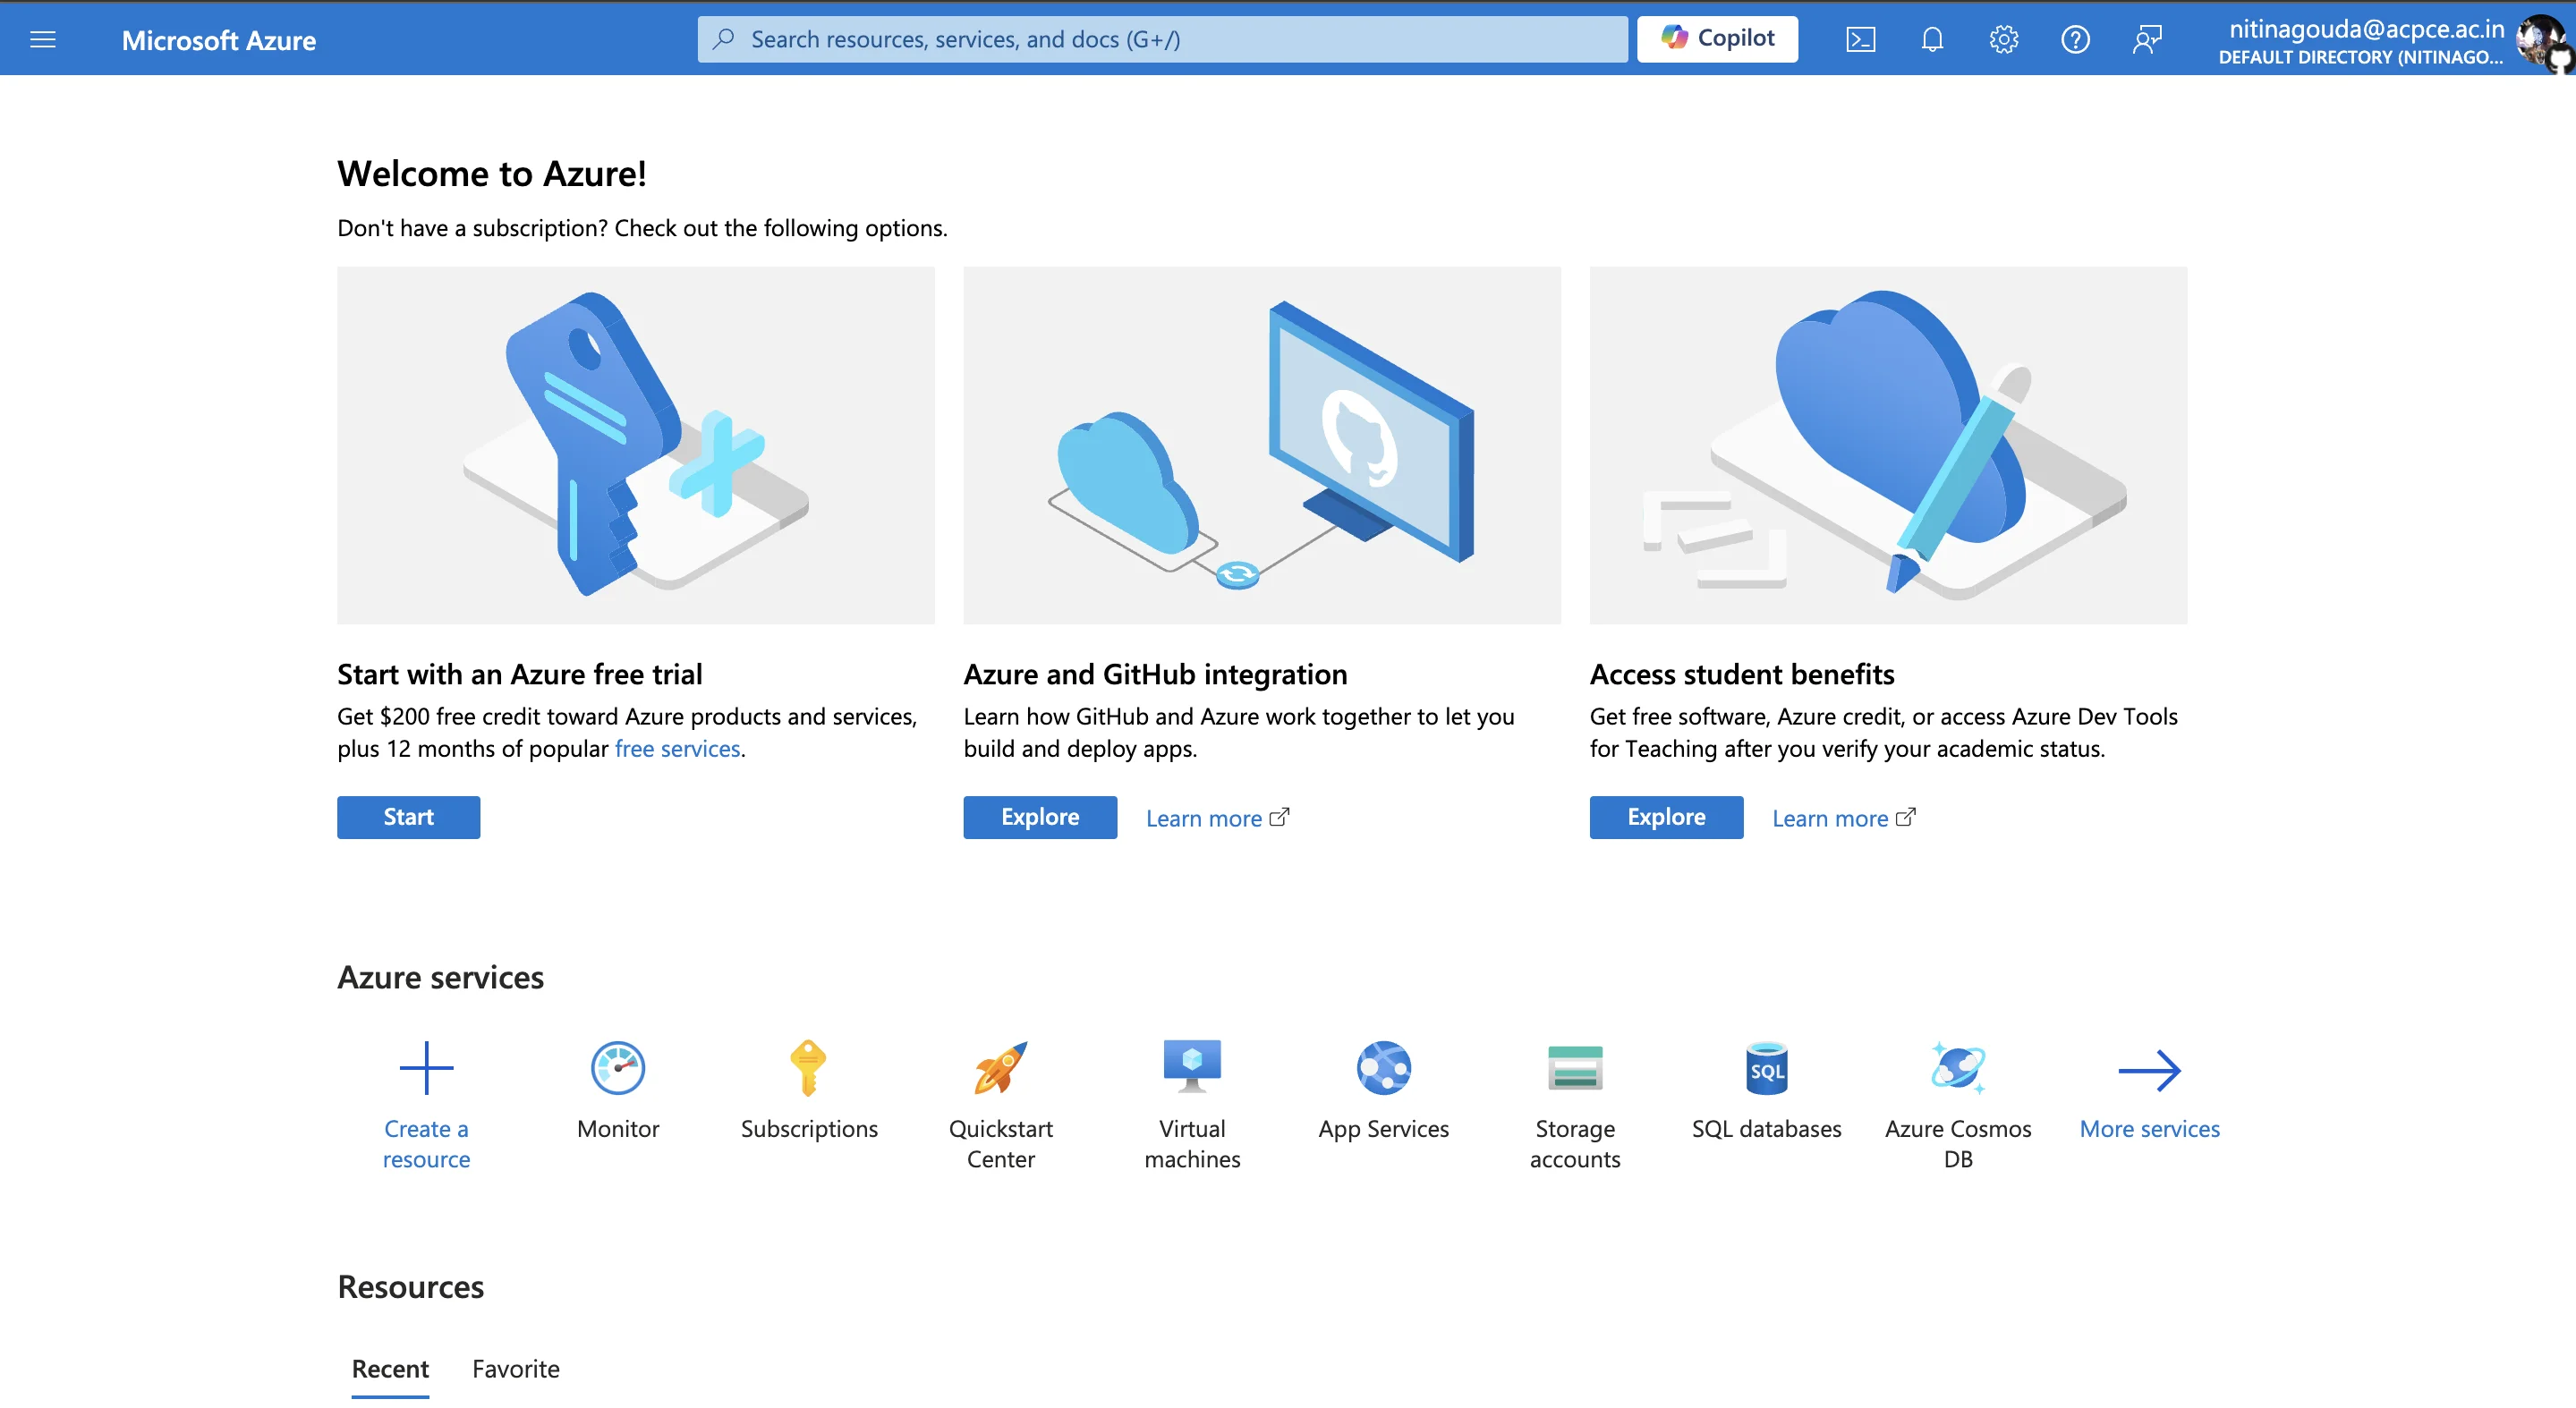
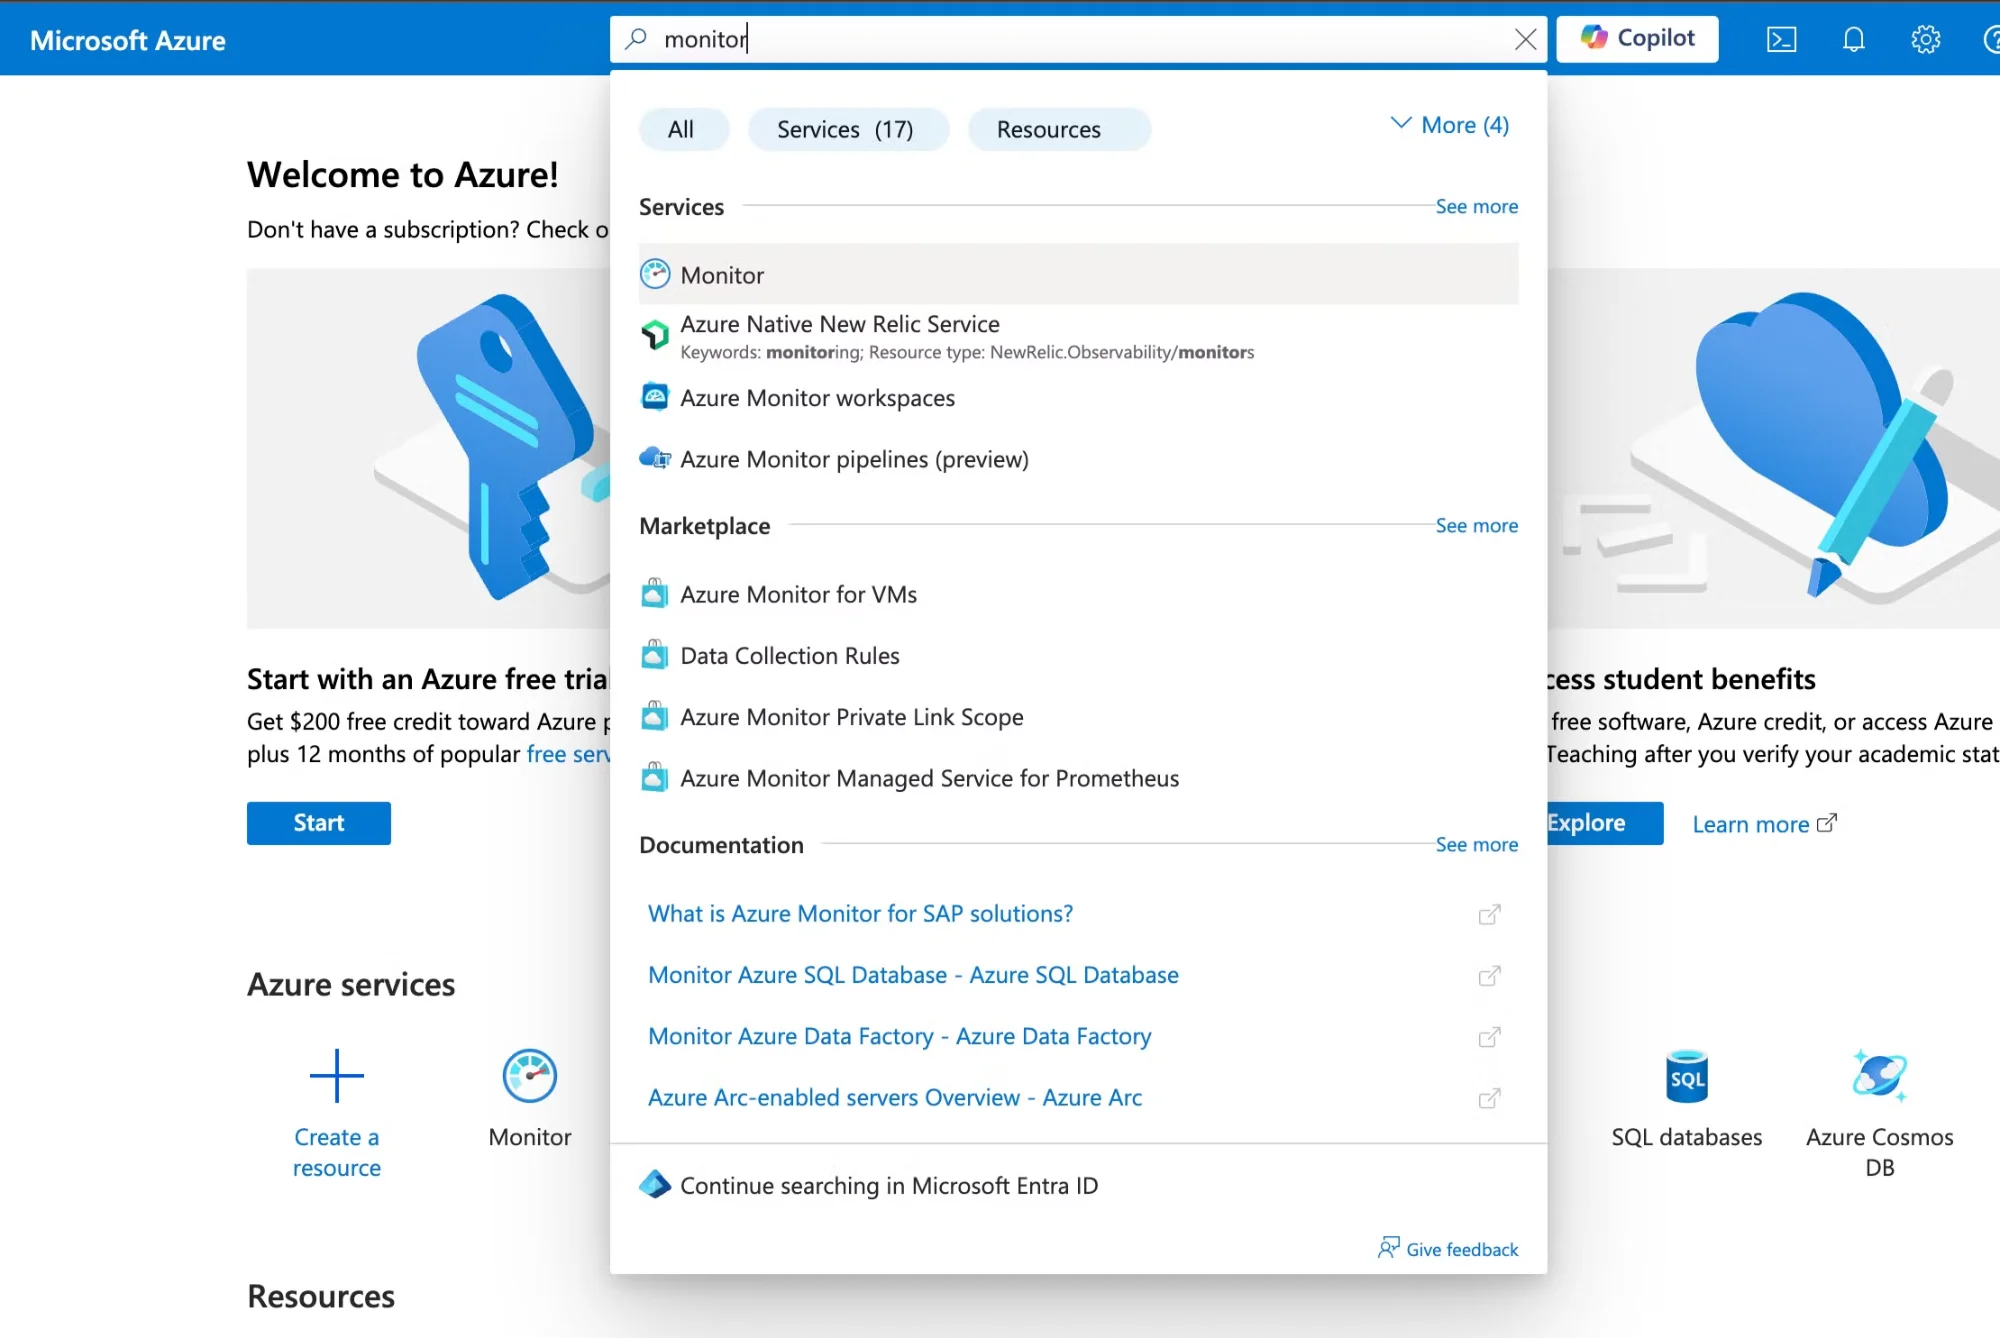
Azure Home Page - Search for "Monitor" and select it: Use the search bar at the portal's top to find "Monitor.”
Azure Monitor - Create a Monitor Workspace: Click on “Monitor,” and then click the "Create" button to set up a new Azure Monitor workspace. This workspace will act as a central hub for your observability data, including metrics, logs, and alerts.
Configure Application Insights for web applications:
- To configure Application insights from web applications, you can follow the Azure App Insights guide to effectively integrate your Azure services.
Establish log collection with Log Analytics:
Access Log Analytics in Azure Monitor: In the Azure Monitor section, click on "Logs" from the left-hand menu.
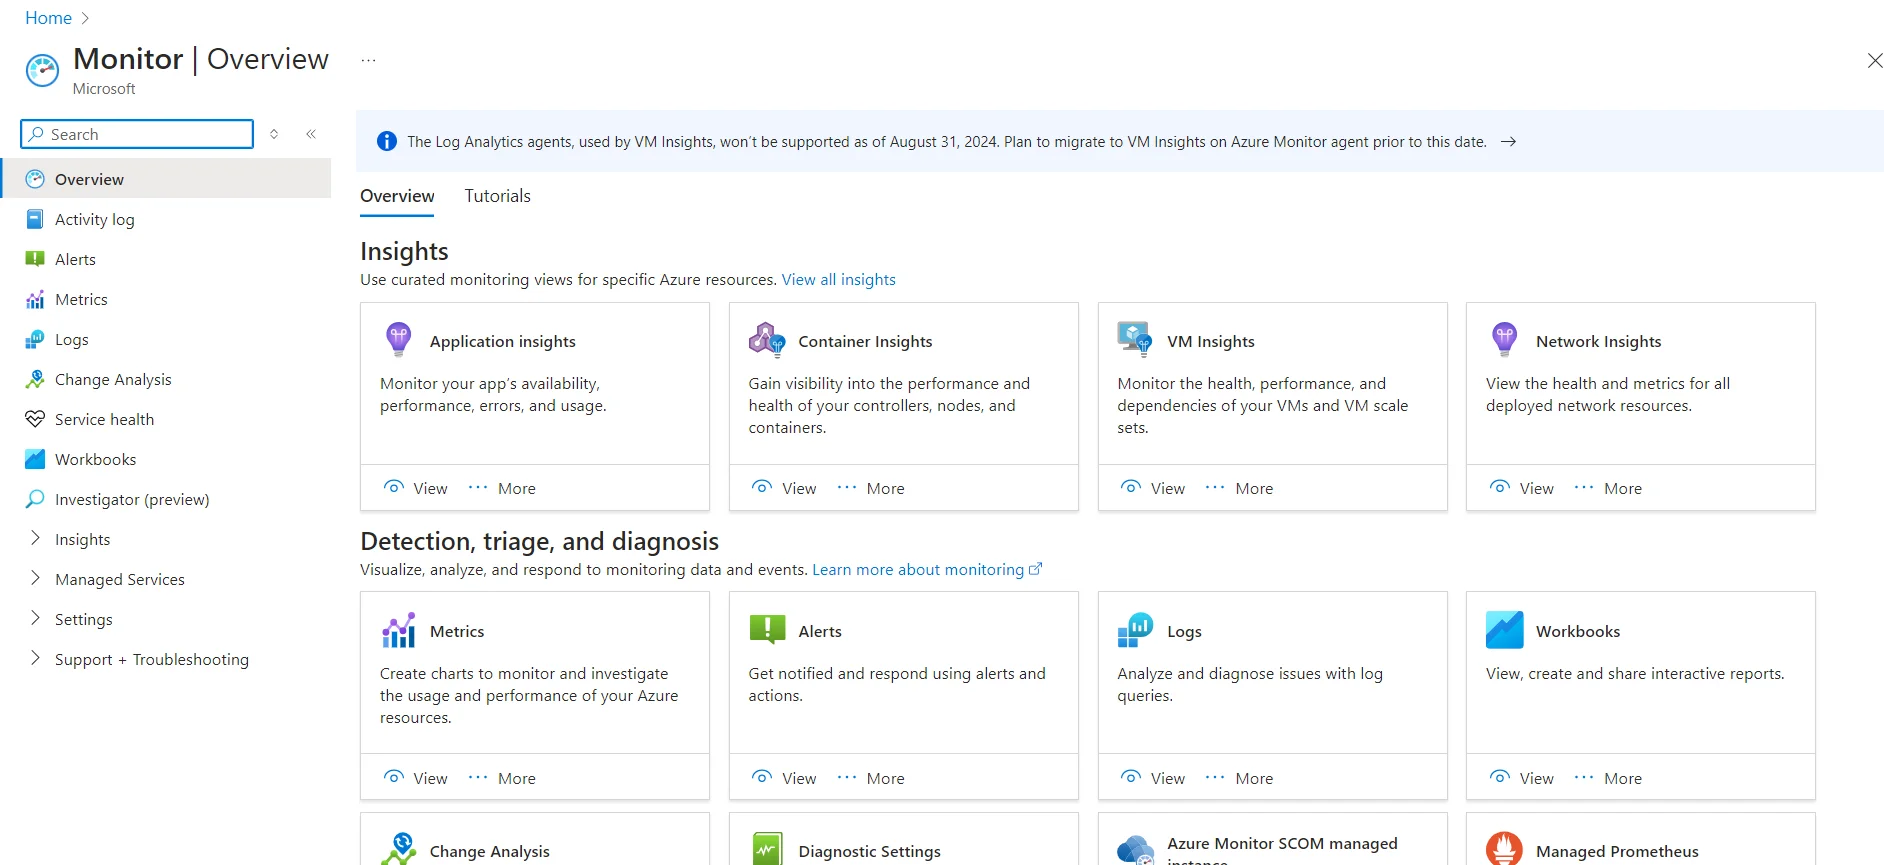
Azure Logs Monitor Overview Create a Log Analytics Workspace: If you don’t already have one, click "Create" to set up a new Log Analytics workspace. This is where your system and application logs will be collected and analyzed.
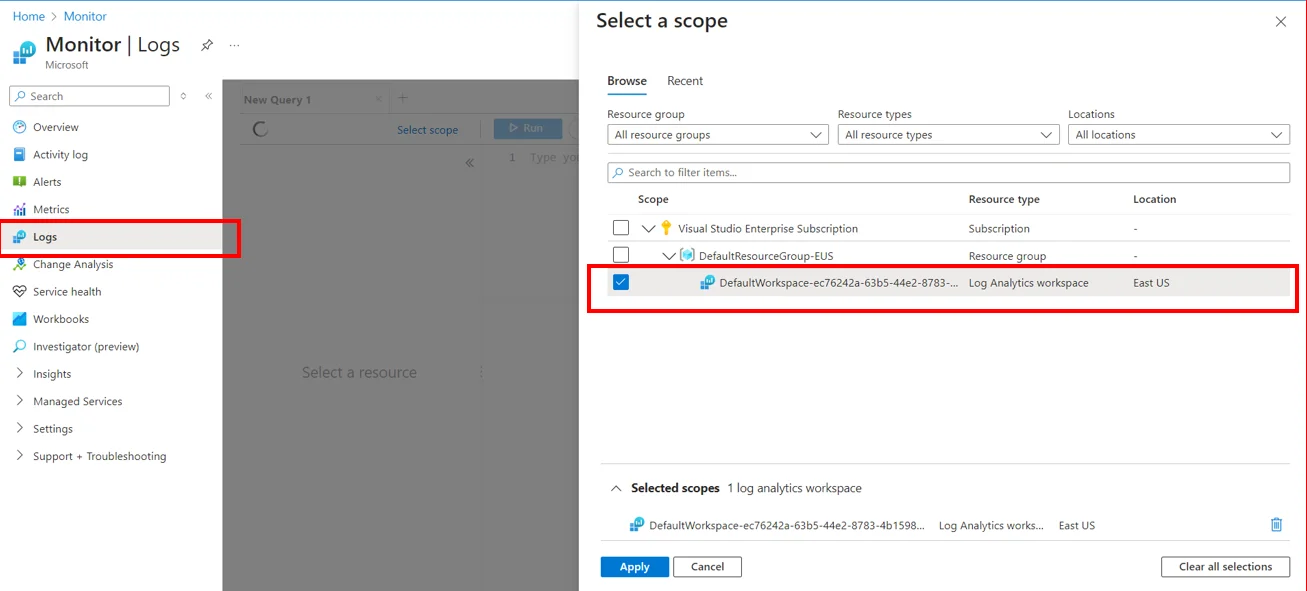
Log Analytics Workspace Azure Monitor Logs Connect Resources: After creating the workspace, connect your Azure resources (e.g., VMs, databases, applications) to start collecting logs. This enables you to search and analyze logs for troubleshooting and auditing purposes.
Create custom dashboards and alerts:
Create Dashboards for Monitoring: In Azure Monitor, click on “Dashboards” in the menu. Then, click “New dashboard” to start building a custom dashboard.
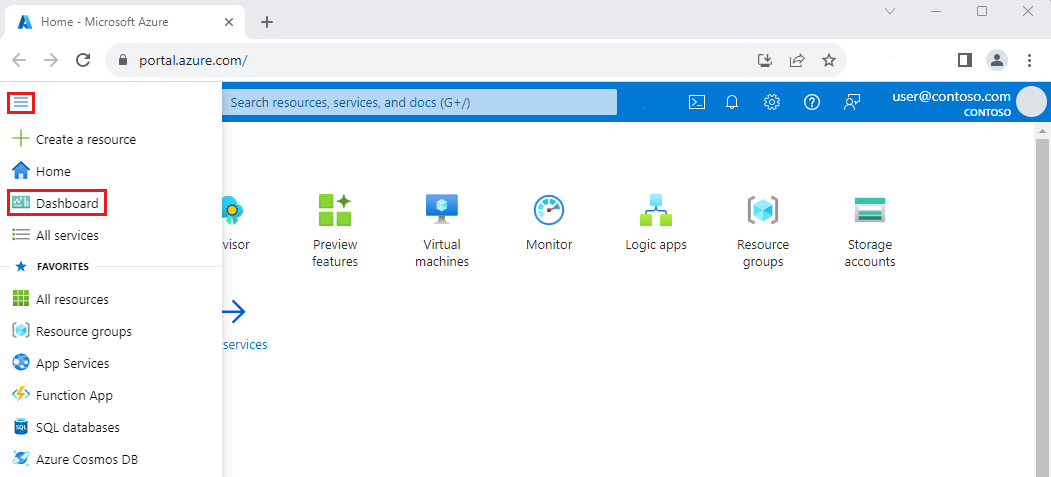
Creating a custom dashboard in Azure Monitor to visualize metrics and logs. (Image: Azure Docs) Select Create, then select Custom. This action opens the Tile Gallery, from which you can select tiles displaying different information types. You'll also see an empty grid representing the dashboard layout, where you can arrange the tiles.
- Select the text in the dashboard label and enter a name to help you easily identify the custom dashboard.
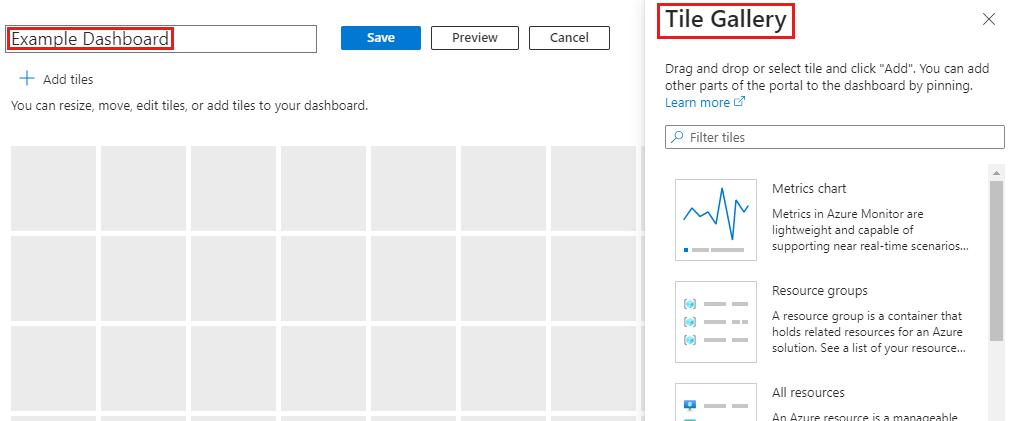
DashBoard view ~ Image Azure Docs To save the dashboard as is, select Save in the page header. The dashboard view now shows your new dashboard. Select the arrow next to the dashboard name to see other available dashboards. The list might include dashboards that other users have created and shared.
Set Up Alerts: To be notified of critical events, go to the “Alerts” section in Azure Monitor. Click “New alert rule” and define the conditions for triggering an alert (e.g., when CPU usage exceeds 80%). You can configure these alerts to send notifications via email or integrate with third-party tools like Slack or Teams.
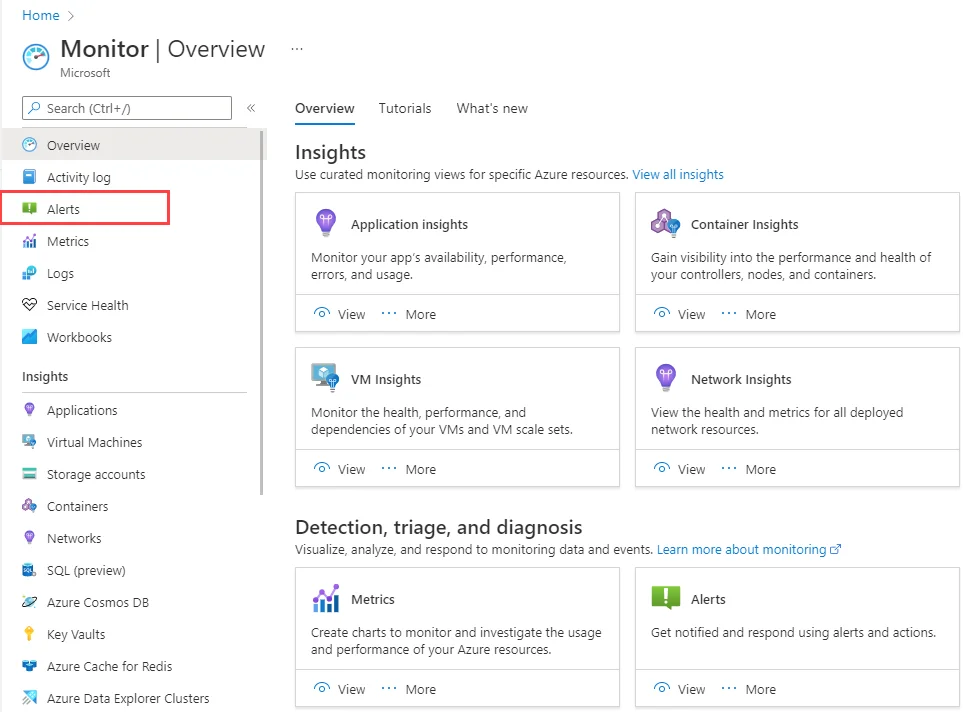
Alerts Page ~ Image ~ Azure Docs 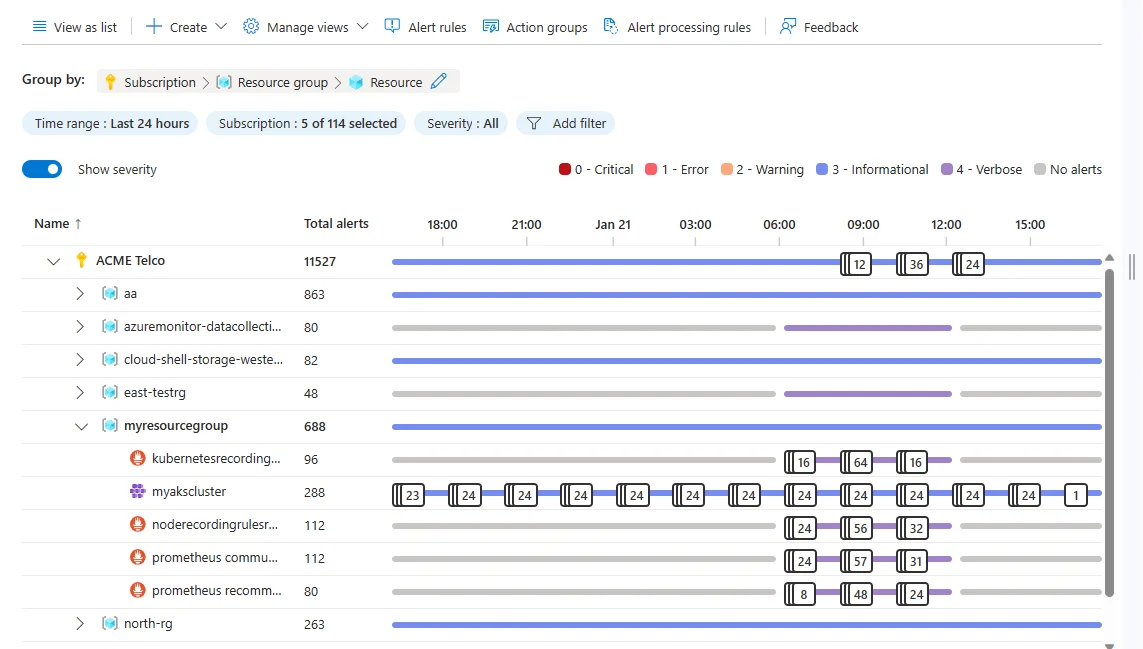
Timeline View Alerts ~ Image Azure Docs
Best Practices for Azure Observability
Here are some simplified and beginner-friendly best practices to help you get started with Azure Observability:
- Define Meaningful Metrics and KPIs: Focus on tracking metrics that impact your business and user experience. For example, monitor response times and error rates to ensure your applications perform well. Defining these metrics helps you track the aspects of your system that are most important to your success and respond quickly when issues arise.
- Use Consistent Tagging and Naming: Properly tag and name your resources so you can easily organize and find them later. This makes filtering and analysing data simpler, especially in large environments. Ensure that you can quickly find and manage resources based on attributes like environment (e.g.,
Production,Staging) or ownership (e.g.,Team A,Project B). - Leverage Auto-Scaling: Use insights from Azure Monitor to automatically scale resources up or down based on demand. This helps you maintain performance during peak times and save costs during low-traffic periods. By using real-time insights from your observability data, you can make sure that your resources are optimally provisioned at all times, enhancing both performance and cost-efficiency.
- Manage Data Retention and Compliance: Set log retention policies to store only what you need while staying compliant with industry regulations. This keeps costs under control and ensures your data is secure. Ensuring the right balance between data retention, cost, and compliance will help you meet both business and regulatory requirements without unnecessary expenditure.
By applying these practices, you'll enhance the visibility, efficiency, and security of your Azure environment.
Advanced Azure Observability Techniques
Take your observability to the next level with these advanced techniques:
- Azure Monitor for containers and Kubernetes: If you're running containerized applications or using Kubernetes, Azure Monitor provides specialized monitoring for these environments. It offers insights into the performance, health, and resource utilization of your containers and clusters, helping you maintain optimal performance and quickly resolve issues.
- Cross-component transaction monitoring: Transactions in today's distributed systems frequently include numerous services. You may track requests as they pass through different services and apps using Azure's cross-component transaction monitoring. This enables you to understand how various components interact and affect overall performance, allowing for faster troubleshooting and improvement.
- AI and machine learning for intelligent insights: Azure leverages AI and machine learning to automatically detect anomalies and forecast potential issues. This helps in predicting system failures or performance bottlenecks before they occur, allowing you to take preemptive actions and improve system reliability.
- Integration with third-party observability tools: While Azure provides robust native observability features, there may be cases where third-party tools offer additional specialized capabilities. By integrating tools like SigNoz, you can extend Azure’s observability for specific use cases, such as custom dashboards or enhanced tracing, to meet your organization's unique needs.
Enhancing Azure Observability with SigNoz
To optimize your Azure observability, leveraging an advanced platform like SigNoz can provide significant benefits. SigNoz is an open-source observability tool that offers end-to-end monitoring, troubleshooting, and alerting for your Azure applications and infrastructure.
SigNoz Cloud is the easiest way to run SigNoz. Sign up for a free account and get 30 days of unlimited access to all features.
You can also install and self-host SigNoz yourself since it is open-source. With 24,000+ GitHub stars, open-source SigNoz is loved by developers. Find the instructions to self-host SigNoz.
Getting started with SigNoz:
- Create a SigNoz Cloud Account or Set up SigNoz locally: SigNoz Cloud offers a 30-day free trial, allowing you to experience its full capabilities. This guide uses SigNoz Cloud, but you can also opt for the open-source version if preferred.
To enhance your Azure monitoring strategy with SigNoz, you can follow the Azure Monitor Metrics for effective integration of Azure Monitor Metrics using OpenTelemetry to SigNoz.
Overcoming Common Azure Observability Challenges
When adopting Azure Observability, especially for beginners, it’s important to be aware of the challenges that may arise. Here are some common hurdles and strategies to overcome them:
- Data volume and retention costs: As you begin collecting observability data, the volume of logs, metrics, and traces can quickly become overwhelming. This leads to increased storage and retention costs. To manage these expenses without losing valuable insights, it’s important to implement data sampling—this technique captures a representative subset of data rather than collecting everything. Additionally, setting appropriate data retention periods ensures that you're only keeping what is necessary, striking a balance between cost-efficiency and the depth of information available for troubleshooting and analysis.
- Observability in hybrid and multi-cloud environments: Many organizations use a combination of on-premises, multi-cloud, and hybrid environments, making observability more complex. Azure’s native observability tools primarily focus on Azure services, but you can extend these capabilities to resources outside of Azure with tools like Azure Arc. Azure Arc allows you to bring external systems under the same observability framework, providing a unified view of all your infrastructure, whether it resides in Azure, on-premises, or other cloud providers. This ensures consistent monitoring and reduces gaps in your observability strategy.
- Security and compliance concerns: Observability frequently entails the collection of extensive system data, which can pose security and compliance concerns, particularly in regulated businesses. Azure provides sophisticated security features including encryption, role-based access control (RBAC), and network isolation to protect your observability data. Furthermore, Azure complies with a number of industry standards, including GDPR, HIPAA, and ISO/IEC 27001, which aids in meeting legal obligations. Using these built-in features, you may securely deploy observability while protecting sensitive information.
- Balancing granularity and performance: One of the key decisions in observability is determining the level of granularity in your monitoring data. Collecting highly detailed metrics, logs, and traces can provide deep insights, but it may also introduce performance overhead and impact system performance. The challenge is to find the right balance—monitor critical components at a high level of detail while using lighter monitoring for less important or less resource-intensive areas. Azure offers tools like adaptive sampling to help manage this balance, ensuring that your observability data remains useful without negatively affecting your application’s performance.
Future Trends in Azure Observability
To ensure your monitoring strategies remain effective and scalable, it's important to stay informed about key trends shaping the future of Azure Observability. Here are some developments to watch:
- AIOps and predictive analytics: The integration of Artificial Intelligence for IT Operations (AIOps) is transforming how organizations manage their infrastructure. In the future, expect predictive analytics capabilities to improve significantly. AIOps will allow for the automatic detection of patterns, early identification of anomalies, and even the prediction of potential failures before they occur. Azure is likely to expand its use of AI to not only identify issues but to automatically resolve them, reducing downtime and minimizing the need for manual intervention.
- Observability-driven development Observability will increasingly become a core part of the development lifecycle, integrated into CI/CD pipelines. Developers will embed observability tools directly into their workflows to monitor code changes and ensure they meet performance expectations. This tighter integration ensures that issues can be detected and fixed earlier in the development process, reducing downtime and improving code quality.
- Edge computing and IoT observability: With the emergence of edge computing and the proliferation of Internet of Things (IoT) devices, observability will become increasingly important in these domains. Azure's monitoring and observability capabilities will most likely be expanded to include distributed, decentralized systems operating at the network's edge. As enterprises deploy more edge computing solutions, guaranteeing observability in these environments will become critical to sustaining performance, security, and dependability.
- Advanced visualizations and data exploration: As observability data grows in complexity, the tools for visualizing and exploring this data must evolve. Expect more advanced visualizations in Azure, allowing users to easily understand complex system behaviors and pinpoint issues quickly. These tools will likely incorporate interactive dashboards, heatmaps, and other visualization techniques that make it easier to explore data in real time, enhancing both monitoring efficiency and decision-making.
Key Takeaways
- Azure Observability combines Azure Monitor, Application Insights, and Log Analytics for a unified view of your cloud and on-premises environments, enabling effective monitoring of application performance and infrastructure health.
- Key observability patterns like distributed tracing (tracking requests across microservices) and centralized logging (consolidating logs) provide deeper insights and faster troubleshooting for complex systems.
- Best practices include:
- Defining meaningful metrics for critical system performance.
- Using tagging for easier data organization and analysis.
- Leveraging AI-driven insights to detect anomalies and predict issues.
- Tools like SigNoz complement Azure by enhancing monitoring, especially for open-source or custom applications.
- Stay current with trends like AIOps and observability-driven development for automated, intelligent monitoring solutions that adapt to evolving systems.
FAQs
What's the difference between Azure monitoring and observability?
Monitoring and observability serve different purposes, though they complement each other.
- Monitoring focuses on collecting predefined metrics, logs, and traces to track the performance of systems and applications. It answers "what is happening" by providing insights into known issues through these fixed data points.
- Observability, on the other hand, takes a more comprehensive approach. It allows you to understand the internal state of your system by analyzing all available data, including logs, metrics, and traces. Observability helps answer "why is it happening" and aids in troubleshooting complex and distributed systems more effectively.
How does Azure Observability handle data privacy and compliance?
Azure Observability is built with data privacy and compliance as core priorities. It adheres to Microsoft's comprehensive privacy standards, ensuring:
- Data residency controls, allowing you to define where data is stored and processed.
- Encryption at rest and in transit, safeguarding your information from unauthorized access.
- Compliance certifications such as ISO, SOC, and GDPR to help meet regulatory requirements across different regions and industries.
This ensures that organizations using Azure Observability can trust the platform to manage sensitive data in line with global compliance standards.
Can Azure Observability work with on-premises resources?
Yes, Azure Observability can monitor on-premises resources. By leveraging Azure Arc or deploying monitoring agents, you can send data from your on-premises systems to Azure Monitor. This allows you to maintain a unified observability solution across both cloud and on-premises environments, ensuring a consistent approach to monitoring and troubleshooting across hybrid systems.
What are the costs associated with implementing Azure Observability?
Costs for Azure Observability depend on several factors:
- Volume of data ingested: The amount of data you collect from logs, metrics, and traces.
- Retention periods: How long you retain the data for analysis and troubleshooting.
- Specific features used: Certain features, such as advanced analytics or AI-driven insights, may add to the cost.
To manage costs effectively, Azure offers a pricing calculator where you can estimate your usage based on data volume, retention, and features. You can also implement cost-saving strategies like data sampling or adjusting retention policies to balance observability needs with budget considerations.
