What is Edge Observability - A Guide to Modern System Monitoring
Edge observability lets you monitor and understand system behavior at edge locations in real-time. It extends traditional monitoring capabilities to the network edge—where your applications interact directly with users and devices. Unlike centralized monitoring, edge observability focuses on collecting and analyzing telemetry data at distributed edge locations.
Understanding Edge Observability
Edge computing moves processing and data storage closer to where data originates. This shift requires a new approach to monitoring.
Edge observability combines three key telemetry types:
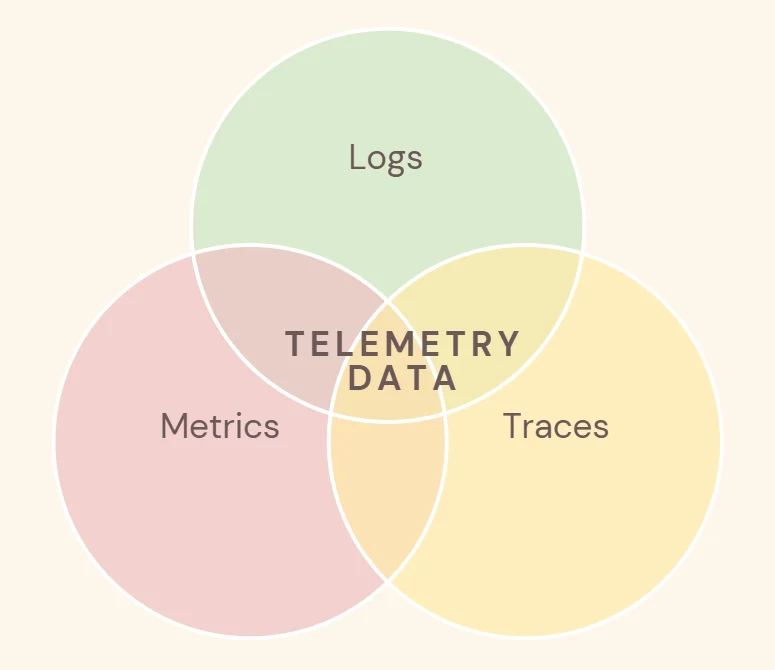
- Metrics: Numerical measurements of system performance (like CPU utilization, memory usage, or response times). Metrics provide a quick overview of health and performance and help detect real-time anomalies.
- Logs: Records of events, errors, and transactions that occur at the edge. Logs capture detailed information on each step of a process, enabling deeper troubleshooting and audit trails for events that might impact performance.
- Traces: End-to-end tracking of requests as they move across services and devices. Traces are essential for understanding dependencies, identifying bottlenecks, and following data flow across distributed systems.
Key Distributed Environments for Edge Observability
Traditional monitoring focuses on centralized data centers, while edge observability extends monitoring to distributed edge locations like:
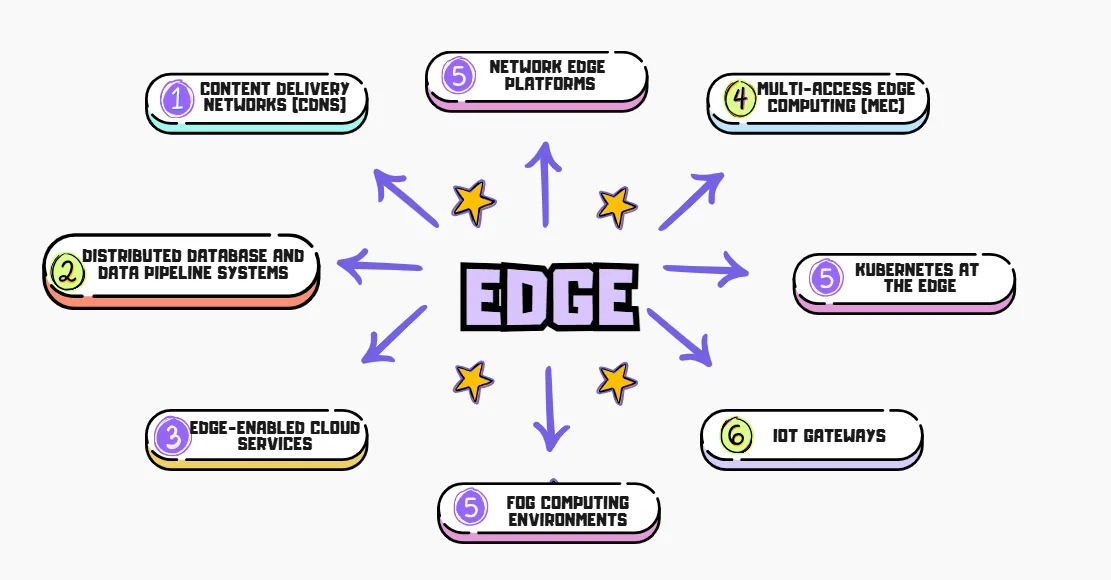
- Fog Computing Environments: Fog computing extends cloud capabilities to the edge, enabling local data processing and storage. Observability in fog computing ensures the health and performance of distributed edge nodes, tracks data movement across the network, and identifies network bottlenecks or failures that could disrupt real-time applications.
- IoT Gateways: IoT gateways serve as intermediaries between IoT devices and cloud or edge platforms, aggregating and processing data. Observability at the edge tracks device health, data flow, and potential failures at the gateway level, ensuring reliable device connectivity and data integrity across large IoT networks.
- Kubernetes at the Edge: Kubernetes at the edge manages containerized applications across distributed edge nodes. Observability tools monitor the health of containers, services, and clusters, ensuring optimal performance, scalability, and quick recovery in case of failures across edge deployments.
- Edge-Enabled Cloud Services: Edge-enabled cloud services extend traditional cloud computing closer to the edge, providing localized processing. Observability tools track resource utilization, application performance, and the interaction between edge nodes and the cloud, ensuring seamless operation and minimal latency in hybrid cloud-edge environments.
- Distributed Database and Data Pipeline Systems: Distributed databases and data pipelines handle large-scale real-time data processing across edge locations. Observability ensures data consistency, availability, and performance by monitoring replication status, pipeline health, and the flow of data from edge devices to processing systems.
- Content Delivery Nodes (CDN): Observing content delivery at the edge helps ensure seamless, low-latency content access for end-users, particularly in video streaming and web applications, where user experience relies on fast load times.
- Network Edge Platforms: Network edge platforms manage services and applications at the network's edge, including SD-WAN and 5G technologies. Observability tools monitor network traffic, connectivity health, and security, ensuring low-latency communication, optimal resource allocation, and protection against potential threats in real-time applications.
- Multi-Access Edge Computing (MEC): MEC brings computation and storage closer to the end-user, often leveraging 5G networks. Edge observability in MEC involves monitoring the performance of edge nodes, network slices, and real-time applications, ensuring low-latency and high-quality service for critical applications like autonomous vehicles and smart cities.
Traditional v/s Edge Observability
Traditional observability focuses on centralized systems monitoring, whereas edge observability extends this to decentralized environments, ensuring insights closer to the source.
A comparison of traditional observability versus edge observability is shown in the table below.
| Factors | Traditional Observability | Edge Observability |
|---|---|---|
| Proximity | Traditional observability relies on collecting and analyzing data in a centralized system, typically located far from where the data is generated | Edge observability deals with devices, sensors, and servers situated near data sources. This proximity allows for faster response times and reduced bandwidth needs, as data processing happens closer to the source. |
| Data Volume | In traditional observability, more data relative to edge observability is sent to a central location for comprehensive analysis, such as detailed logs, high-frequency metrics, and full-trace data from all devices, often without filtering or aggregation | In edge observability, much of the data processing is done locally, sending only critical or aggregated information such as anomaly alerts, summary statistics, and trend insights back to the central system to reduce bandwidth and storage requirements |
| Network Dependency | Traditional observability relies on stable connections to transmit data to central servers. | Edge observability often functions independently of central network connections, which is critical in cases of intermittent connectivity. |
| Latency | Traditional observability can introduce latency, as data has to be transmitted over a network before analysis. | Edge observability reduces latency by processing data close to its source, ideal for applications requiring near-instantaneous insights (e.g., real-time industrial automation). |
Core Components of Edge Observability
Edge observability involves monitoring and analyzing performance data from distributed edge environments. These environments require a different approach to tracking system health, user interactions, and the flow of requests, as edge devices are often remote and have limited resources. Let's break down the core components:
1. Distributed Tracing
Distributed tracing allows you to track the journey of a request as it moves through various services, including those at the edge. At the edge, each service or device (like IoT sensors, mobile network servers, or POS systems) processes a portion of the data. Tracing helps to understand the end-to-end flow and time taken across each stage.
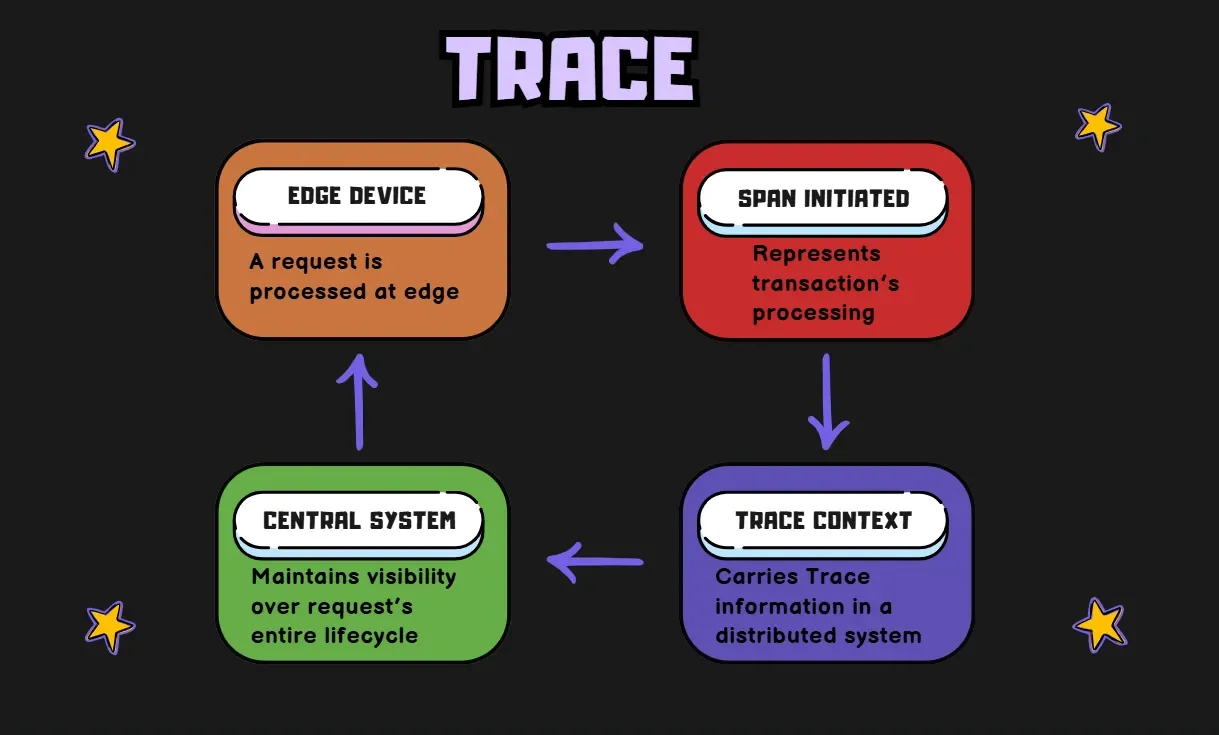
Let’s see how we can propagate trace context in a distributed system through the following code snippet:
# Example trace context propagation
@tracer.start_span('edge_transaction')
def process_at_edge():
    # Process data locally
    edge_result = local_processing()

    # Forward trace context
    context = tracer.get_current_span().context
    send_to_central(edge_result, context)
When a request is processed at the edge, a span (@tracer.start_span('edge_transaction')) is started to represent the transaction's processing. This trace context is then forwarded to the central system to maintain visibility over the request's entire lifecycle.
In the above code snippet,
local_processing()refers to the data handling done on the edge device, whilesend_to_central()propagates the trace context to the central system, ensuring end-to-end visibility from edge to cloud.
2. Metrics Collection
Metrics collection at the edge is crucial for measuring performance and resource usage locally, without sending large amounts of data back to the central system. Metrics such as CPU usage, memory consumption, and request latency help in understanding how each edge device is performing.
# Example edge metrics configuration
metrics:
  collection:
    interval: 10s
    edge_points:
      - cpu_usage
      - memory_usage
      - request_latency
    aggregation: local
The YAML configuration sets a collection interval (10s) for key metrics such as cpu_usage, memory_usage, and request_latency, with local aggregation to prevent network overload and provide timely insights at the edge. Aggregation helps reduce network overload by combining data before sending, minimizing the volume of transmitted information while still providing timely insights at the edge.
In this setup, the edge device gathers metrics every 10 seconds, performing aggregation locally to reduce network load and optimize edge resource use. This approach is especially valuable in bandwidth-constrained environments.
3. Log Management
Log management at the edge involves capturing detailed logs of events, errors, or transactions that happen on edge devices. Logs are essential for troubleshooting and understanding system behaviors at the local level, especially when devices are remote or experience network issues.
The Python example configures a logger to handle local storage, log compression, error-level thresholds, and retention.
# Example edge logging
logger.config({
    'local_storage': True,
    'compression': True,
    'forward_threshold': 'ERROR',
    'retention_days': 7
})
In this example,
local_storage: True enables logs to be stored directly on the device, reducing the need for continuous network communication.
compression: True saves storage by compressing log files.
forward_threshold: 'ERROR' ensures that only error-level logs are sent to the central system, highlighting critical issues.
retention_days: 7 sets the local log retention period to seven days before deletion.
Why Edge Observability Matters
Edge observability provides critical benefits:
- Faster Response: It allows data to be processed and monitored locally at the network's edge (close to data source), which means there’s minimal latency. Since it reduces the time data needs to travel to and from a central server, edge observability supports immediate actions and critical decision-making in time-sensitive scenarios
- Cost Reduction: Edge devices can process data locally, reducing expensive data transfers to the cloud, especially for high-bandwidth tasks like video streaming and IoT applications.
- Enhanced Performance: By processing data locally, edge devices reduce the load on central infrastructure, ensuring smoother operation even with limited connectivity.
- Optimized Bandwidth Usage: Observability reduces unnecessary data transmission by processing and filtering data locally, ensuring only essential insights are sent to the central system, which helps optimize bandwidth, especially in remote or limited connectivity environments.
- Enhanced Data Privacy and Security: By keeping sensitive data at the edge and only sending necessary information to central systems, observability reduces the risk of data exposure and enhances security, ensuring compliance with privacy regulations.
- Scalability Across Distributed Environments: Observability enables scalable monitoring in distributed environments by processing data locally at the edge, allowing systems to grow without overloading centralized infrastructure.
Challenges in Edge Environments
Edge environments present unique monitoring challenges such as:
| Challenges | Descriptions | Sub-Issues | Details |
|---|---|---|---|
| Network Issues | It's tough to keep a steady connection in remote areas, which can cause delays and bandwidth problems. | Intermittent Connectivity | Edge environments frequently experience inconsistent network connectivity, disrupting the flow of observability data back to central systems for analysis, making it harder to get a complete picture of performance. |
| Variable Latency | Due to varying distances from central systems and fluctuations in network quality, latency can impact real-time data collection and timely response. | ||
| Limited Bandwidth | Edge environments often operate with constrained bandwidth, which can limit the amount of data transferred to centralized systems and impact overall data quality. | ||
| Data Management | Managing all that data from different devices can be tricky, especially when it comes to keeping it organized and accessible. | High Volume of Telemetry Data | Edge applications generate large volumes of telemetry data across numerous sites, complicating data aggregation, storage, and analysis in central monitoring solutions. |
| Storage Constraints | Many edge devices have limited storage capacity, making it challenging to store extensive telemetry data locally without frequent offloading. | ||
| Data Synchronization Needs | Synchronizing data from distributed devices to ensure consistency is challenging, especially when network issues or connectivity constraints are frequent. | ||
| Heterogeneous Infrastructure | Edge environments typically involve diverse devices and platforms, making it difficult to track dependencies, normalize data, and monitor performance consistently across different systems. | ||
| Security | Keeping everything secure at the edge is a real challenge, especially with limited resources and higher risks of cyberattacks. | Distributed Attack Surface | With a broader and more dispersed infrastructure, edge environments present a larger attack surface, making them more vulnerable to security threats. |
| Local Data Protection | Sensitive data may be processed and stored on-site, requiring strict security measures to prevent unauthorized access and ensure compliance. | ||
| Access Control Across Locations | Managing access to devices and data across multiple locations is complex, especially with the need to secure credentials and maintain compliance with security standards. | ||
| User-Reported Issues | User-reported issues refer to the common problems or complaints that customers or users share about a product or service, highlighting areas that need improvement or fixing. | Delayed Detection | Often, issues are detected by end users rather than monitoring tools, resulting in delayed acknowledgment and response, which can negatively impact application performance and user experience. |
| Reactive Monitoring | Depending on user reports as the primary source of issue detection can hinder proactive monitoring efforts, delaying troubleshooting and resolution. |
Implementing Edge Observability
Implementing edge observability involves setting up the necessary infrastructure, defining key performance indicators, and establishing monitoring protocols to ensure visibility into the health and performance of distributed edge environments.
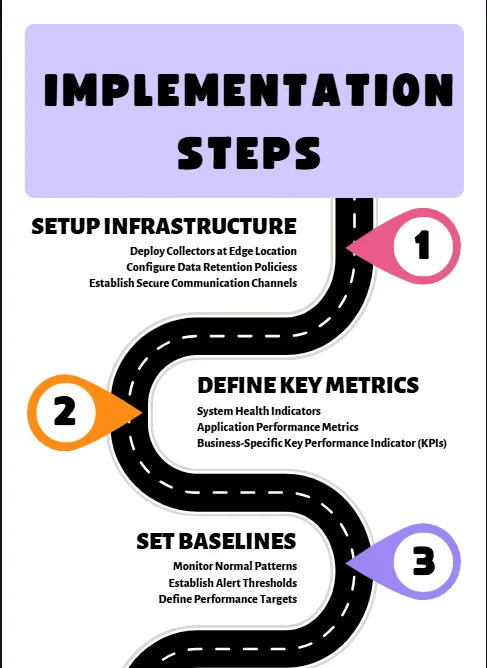
The following steps are crucial for successfully adopting edge observability:
1. Setup Infrastructure
This first step focuses on establishing the fundamental architecture for monitoring at the edge.
- Deploy Collectors at Edge Locations: Edge collectors are lightweight agents or services deployed on edge devices to capture telemetry data. After gathering data locally, these collectors either send it to a central system or process it on-site, depending on the needs. For example, you could deploy a collector on each edge node to monitor CPU and memory usage, log specific events, and trace requests as they flow through the edge system.
- Configure Data Retention Policies: Given the limited storage capacity of edge devices, data retention policies are important to ensure that only relevant data is stored locally for the appropriate amount of time. It's crucial to determine how long data should be kept (e.g., logs from the past 7 days) before it is either archived or deleted.
- Establish Secure Communication Channels: Secure protocols (e.g., TLS) should transmit data between edge devices and central systems to protect sensitive data like logs and metrics from unauthorized access. Encrypted channels can also be used to prevent data breaches by safeguarding traces and logs sent to the central observability system
2. Define Key Metrics
Once the infrastructure is set up, you need to define which metrics will be monitored at the edge to ensure the system's health and performance.
- System Health Indicators: These metrics give your insight into the overall health of edge devices. This includes CPU and memory usage, disk space, and network availability. Monitoring these metrics helps detect potential issues before they affect system performance. A high CPU usage rate may signal that a device is overloaded and may need additional resources or optimization.
- Application Performance Metrics: For edge applications, you'll want to monitor things like response time, error rates, and throughput. These metrics help you assess how well edge applications are performing under load and if they are meeting user expectations. If an IoT sensor application is reporting unusually high response times, this could indicate that there’s a bottleneck in the data processing pipeline.
- Business-Specific Key Performance Indicator (KPIs): Depending on the use case, edge observability might also include tracking business-specific metrics like transaction volume, user engagement, or uptime for critical services. These KPIs can help ensure that edge systems are delivering value and meeting organizational objectives. For an example, in a retail environment, KPIs could include transaction success rates or customer wait times, which directly impact business performance.
3. Set Baselines
Establishing baselines for what is considered "normal" helps to identify anomalies and performance degradation early on.
- Monitor Normal Patterns: By tracking historical data for a period, you can establish baseline patterns for the metrics you've defined. This helps you recognize what typical performance looks like for each edge device, application, or service. To take an example, if you monitor memory usage over the course of a week, you may find that most devices consume 50% of their memory. This gives you a baseline for comparison in case of spikes.
- Establish Alert Thresholds: Once baselines are defined, it’s crucial to set up alerting mechanisms. Alerts should trigger when metric values deviate significantly from the baseline, such as CPU usage consistently exceeding 90%). Setting up thresholds based on normal patterns will help you catch issues early and minimize downtime.
- Define Performance Targets: To ensure optimal performance, it's important to set performance targets that align with your business objectives. These targets can be based on things like:
- Response Time: The time it takes for a system to respond to a request (e.g., requests should be processed in under 100ms).
- Uptime: The percentage of time a system is operational and available (e.g., 99.9% availability).
- Resource Utilization: The amount of system resources, such as CPU or memory, being used (e.g., CPU usage should stay below 75%). As an example, in a content delivery system, the target might be that content load times should be under 3 seconds for 95% of users.
Strategic Approaches for Effective Edge Monitoring
| Goal | Approach |
|---|---|
| Proactively detect issues before they impact end users to enhance response times and improve user experience. | Shift-Left Approach: This involves moving observability practices earlier in the development process, allowing for proactive issue detection rather than relying solely on post-deployment monitoring |
| Reduce unnecessary data collection to save bandwidth and lower processing costs. | Adaptive sampling: It means selectively collecting data rather than monitoring everything continuously. By analyzing traffic patterns, you can capture data only when certain thresholds are crossed or when unusual activity occurs. |
| Minimize latency and improve issue response times by reducing dependency on central systems. | Local Intelligence: Deploying localized monitoring solutions that can analyze data on-site reduces dependency on central systems and improves response times to issues |
| Align alerts with the unique and dynamic behaviors of edge environments to ensure accurate, actionable notifications. | Real-Time Alerting: Implementing systems that provide immediate alerts upon detecting anomalies ensures that teams can act swiftly to mitigate potential problems before they escalate |
| Ensure data continuity and integrity by safeguarding it during outages, allowing for seamless processing once connectivity is restored. | Establish Failover and Redundancy: In edge environments where network connectivity can be inconsistent, setting up failover mechanisms and local storage redundancy |
| Optimize monitoring resource usage to avoid impacting the performance of edge devices. | Optimize Resources: Choose lightweight monitoring solutions and limit monitoring frequency to minimize impact on edge devices' performance. |
Getting Started with SigNoz for Edge Monitoring
Implementing edge observability is crucial for maintaining the health and performance of distributed systems. SigNoz Cloud offers a streamlined approach to achieve this without the complexities of self-hosting.
Getting Started with SigNoz Cloud for Edge Monitoring
SigNoz Cloud provides a hassle-free setup, enabling you to focus on monitoring your edge applications effectively.
SigNoz Cloud is the easiest way to run SigNoz. Sign up for a free account and get 30 days of unlimited access to all features.
You can also install and self-host SigNoz yourself since it is open-source. With 24,000+ GitHub stars, open-source SigNoz is loved by developers. Find the instructions to self-host SigNoz.
- Sign Up for SigNoz Cloud
Create an Account: Visit the SigNoz Cloud sign-up page to register for a free trial, which offers 30 days of unlimited access to all features.
Access the Dashboard: Upon registration, log in to access the SigNoz Cloud dashboard, your centralized hub for monitoring and observability.
- Instrument Your Edge Applications with OpenTelemetry
To monitor your edge applications, integrate OpenTelemetry to collect telemetry data.
- Integrate OpenTelemetry SDKs: Incorporate the appropriate OpenTelemetry SDKs into your edge applications based on the programming languages in use.
- Configure Exporters: Set up the OpenTelemetry exporters in your edge applications to send telemetry data to the SigNoz backend.
Here are some popular language-specific OpenTelemetry instrumentation guides to help you get started:
- Configure Data Transmission
Ensure secure and efficient data flow from your edge devices to SigNoz Cloud.
- Set Up the OpenTelemetry Collector: Deploy the OpenTelemetry Collector to receive, process, and export telemetry data from your edge applications to SigNoz Cloud.
- Implement Secure Communication: Use secure protocols to transmit data, safeguarding it against unauthorized access.
- Optimize Data Transfer: Configure data compression and set appropriate retry policies to handle intermittent connectivity, ensuring reliable data transmission.
- Visualize and Analyze Edge Telemetry in SigNoz Cloud
Leverage SigNoz Cloud's features to gain insights into your edge environments.
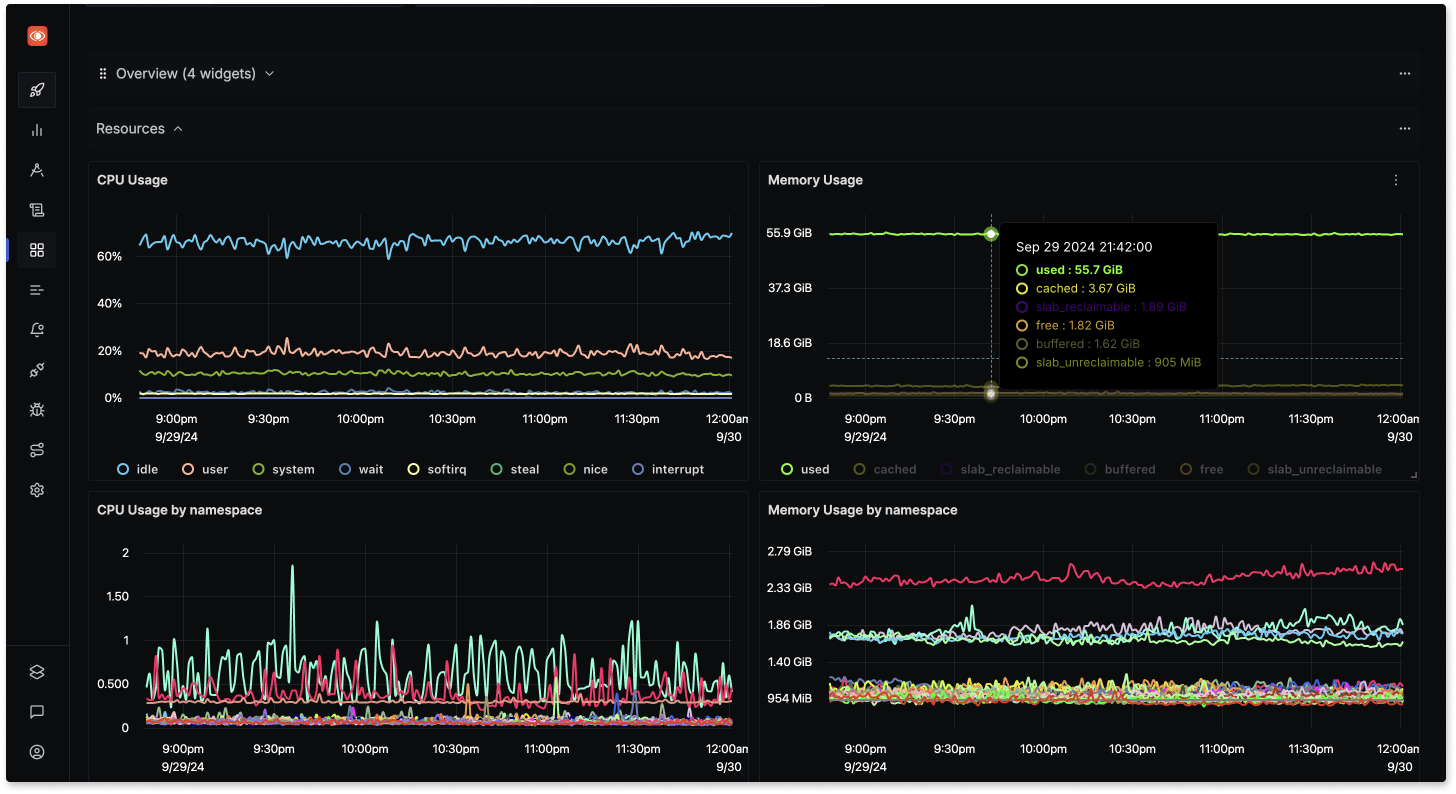
- Create Custom Dashboards: Utilize SigNoz's dashboarding capabilities to visualize metrics, traces, and logs from your edge applications, enabling real-time monitoring of performance and health.
- Set Up Alerts: Configure alerts in SigNoz to notify your team of any anomalies or performance issues detected in your edge environments.
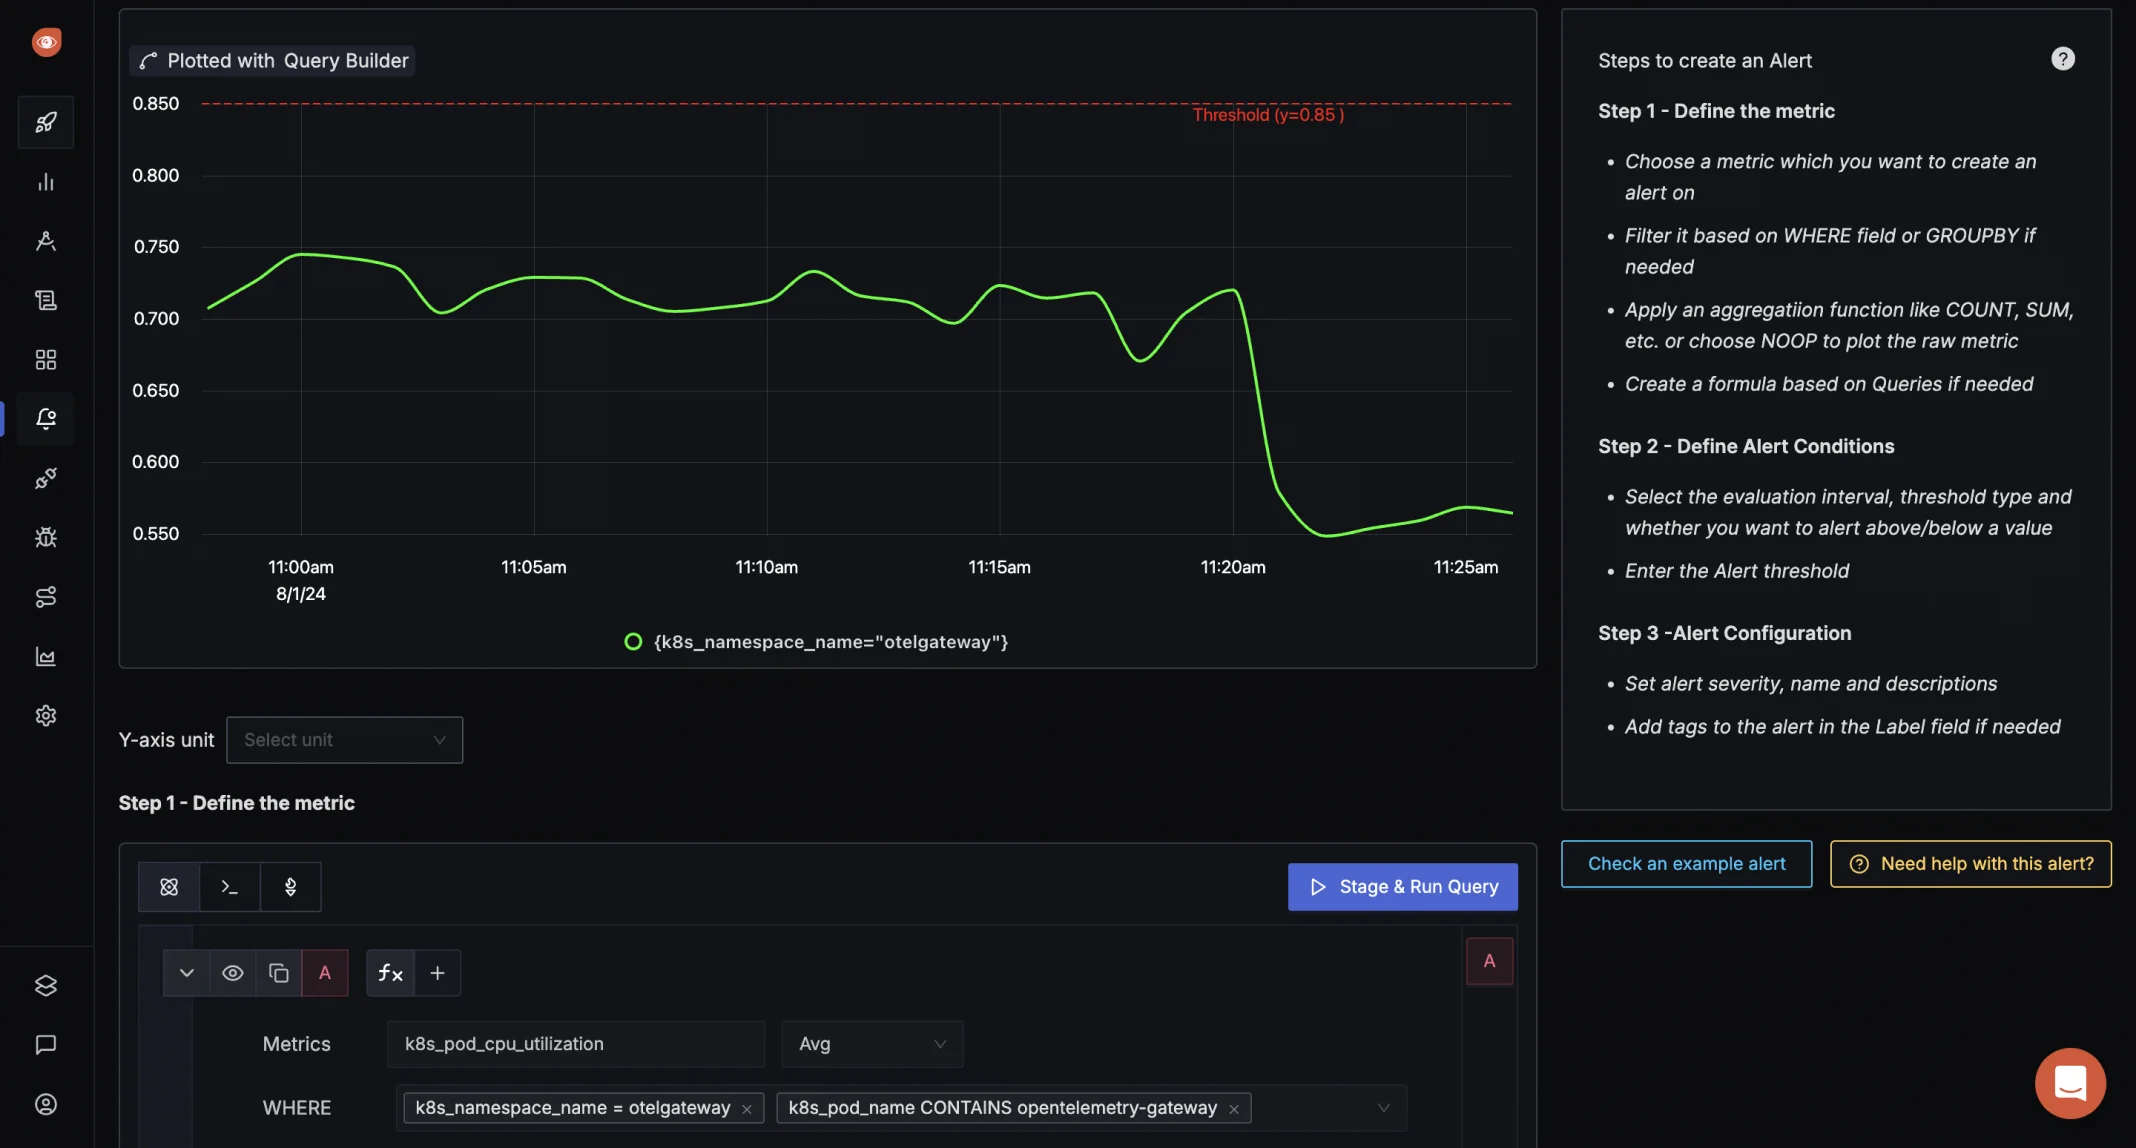
By following these steps, you can effectively monitor and observe your edge applications using SigNoz Cloud, gaining comprehensive visibility into your edge deployments and facilitating proactive issue detection and resolution.
For more detailed guidance, refer to the official SigNoz documentation and resources.
Key Takeaways
- Edge observability extends monitoring to distributed locations, providing real-time insights into remote devices and environments that are otherwise hard to access or manage centrally.
- Implementation requires balanced data collection strategies, ensuring that data is processed locally at the edge while only critical or aggregated information is sent to the central system to avoid bandwidth overload.
- Real-time monitoring enables quick issue resolution, allowing teams to detect and respond to performance issues or failures instantly, minimizing downtime and ensuring continuous operations.
- Proper tooling automates complex monitoring tasks, using advanced software to streamline data collection, anomaly detection, and alerting, which reduces manual effort and enhances overall system efficiency.
FAQs
What's the difference between edge observability and traditional monitoring?
Edge observability focuses on distributed locations and local processing, while traditional monitoring centralizes data collection and analysis.
How do you handle data storage in edge observability?
Use local storage with compression and selective forwarding based on importance and available bandwidth.
What metrics should I monitor in edge computing?
Monitor system metrics (CPU, memory, network), application metrics (latency, errors), and business KPIs specific to your edge use case.
How does edge observability impact system performance?
Proper implementation has minimal impact through efficient sampling and local processing, while providing crucial insights for optimization.
