How to Filter Prometheus Metrics by Value - A Guide
Prometheus, a powerful open-source monitoring system, collects and stores time series data as metrics. While label-based filtering is common, there are scenarios where filtering by metric value becomes crucial for precise analysis. This guide explores the ins and outs of filtering Prometheus results by metric value, providing you with the knowledge to enhance your monitoring capabilities.
Understanding Prometheus Metrics and Filtering Basics
Prometheus is a powerful monitoring and alerting toolkit used to collect metrics about your system. Prometheus metrics represent numerical measurements of various aspects of your system's state over time. Each metric comprises three key components:
Metric Name: This identifies what is being measured. For example,
http_requests_totaltracks the total number of HTTP requests made to your application.Labels: Labels are key-value pairs that provide additional context about the metric. They help categorize and filter metrics based on specific attributes. For example:
method="GET": Indicates the HTTP method used.status="200": Represents the HTTP response status code.
Metric Value: This is the actual numerical value associated with the metric. For instance, in the example below,
1234is the metric value. It indicates that 1,234 HTTP GET requests resulted in a 200 (OK) status code.http_requests_total{method="GET", status="200"} 1234
Common Filtering Techniques in Prometheus
Filtering in Prometheus allows you to refine your queries to focus on specific metrics of interest. Traditionally, Prometheus filtering emphasizes labels. Here’s an overview of some of the most common filtering techniques in Prometheus:
- Label-Based Filtering: Labels in Prometheus are key-value pairs attached to metrics that provide additional context. They help categorize and filter metrics for granular insights. Label-based filtering allows you to narrow down your query by specifying the labels and their values.
Example:
http_requests_total{method="GET"}
This query will return all metrics for HTTP requests that used the GET method. You can filter further by adding more labels, such as:
http_requests_total{method="GET", status="200"}
Here, the query filters HTTP GET requests that returned a 200 status code, allowing more detailed tracking of successful requests.
- Regex Filtering: Sometimes, you may need to filter multiple label values at once. Prometheus supports regular expressions (regex) for flexible filtering of label values. This technique is particularly useful when querying for multiple matching values.
Example:
http_requests_total{method=~"GET|POST"}
This query filters metrics for both GET and POST methods, making it easier to aggregate or compare requests for these HTTP methods.
- Range Vector Filtering: Prometheus allows you to filter metrics over a specific time range. A range vector query retrieves metric data points within a defined time window, making it easier to analyze historical data or detect trends.
Example:
http_requests_total[5m]
This query retrieves the count of HTTP requests within the last 5 minutes. You can apply additional filters to focus on specific requests within this time window.
- Aggregation and Grouping: Aggregation functions like
sum,avg,min,max, andrateallow you to filter and aggregate metrics for analysis. By combining these functions with filters, you can gain valuable insights into high-level system behavior or detect anomalies in specific parts of the system.
Example:
sum(rate(http_requests_total[5m])) by (method)
This query aggregates the rate of HTTP requests over the last 5 minutes, grouped by the method label. It provides a summary of how different HTTP methods perform over time.
Importance of Filtering by Metric Value for Advanced Monitoring
Filtering by metric value plays a significant role in advanced monitoring, enabling users to focus on key performance indicators (KPIs) and abnormal system behavior. By setting thresholds for metrics, you can quickly detect when certain values exceed or fall below acceptable limits.
For example:
- Detecting High CPU Usage: Filtering CPU metrics to only display values above a certain percentage helps identify when a system is under heavy load, triggering alerts before the issue escalates.
- Monitoring Request Latency: By filtering for request latency metrics that exceed a set threshold, you can detect performance bottlenecks and ensure that application responsiveness remains optimal.
This form of filtering is especially important when working with large-scale systems, where hundreds or thousands of metrics are being generated. It allows administrators to cut through the noise and focus on the most critical aspects of system performance. Additionally, filtering can improve dashboard readability and make alerting more efficient by ensuring that only actionable data is presented.
Why Filter Prometheus Results by Metric Value?
In modern monitoring, traditional label-based filtering can overwhelm users with data. Value-based filtering focuses on actual metric values, enabling precise analysis and actionable insights. It allows you to set specific thresholds and trigger alerts based on real-time data, such as detecting requests over 500ms or high CPU usage. This approach is crucial for effectively addressing performance issues, particularly for limitations of label-based filtering.
Limitations of Label-Based Filtering
While label-based filtering is effective for segmenting metrics, it has some limitations:
- Inability to Filter by Value: You cannot filter based on the actual metric values. For example, if you want to analyze only those HTTP GET requests that resulted in a certain status code or those exceeding a specific count, label-based filtering alone cannot achieve this.
- Advanced Analysis: For performance analysis and alerting based on thresholds, value-based filtering becomes essential. This means you need to combine your understanding of metrics with the ability to filter based on numerical values.
Benefits of Value-Based Filtering for Performance Analysis
Filtering Prometheus results by metric value is a powerful feature that enhances your ability to analyze and monitor system performance. Unlike traditional label-based filtering, which primarily focuses on metadata, value-based filtering allows for a deeper and more dynamic approach to querying metrics. Here’s why this capability is essential for effective monitoring:
Precise Thresholds
Value-based filtering enables you to set precise thresholds for your metrics. This is crucial for performance monitoring, as it allows you to quickly identify metrics that exceed specific limits. For instance, if you're monitoring JVM memory usage and want to be alerted when it exceeds 10 MB, you can use a query like this:
jvm_memory_used_bytes > 100000002. Dynamic Analysis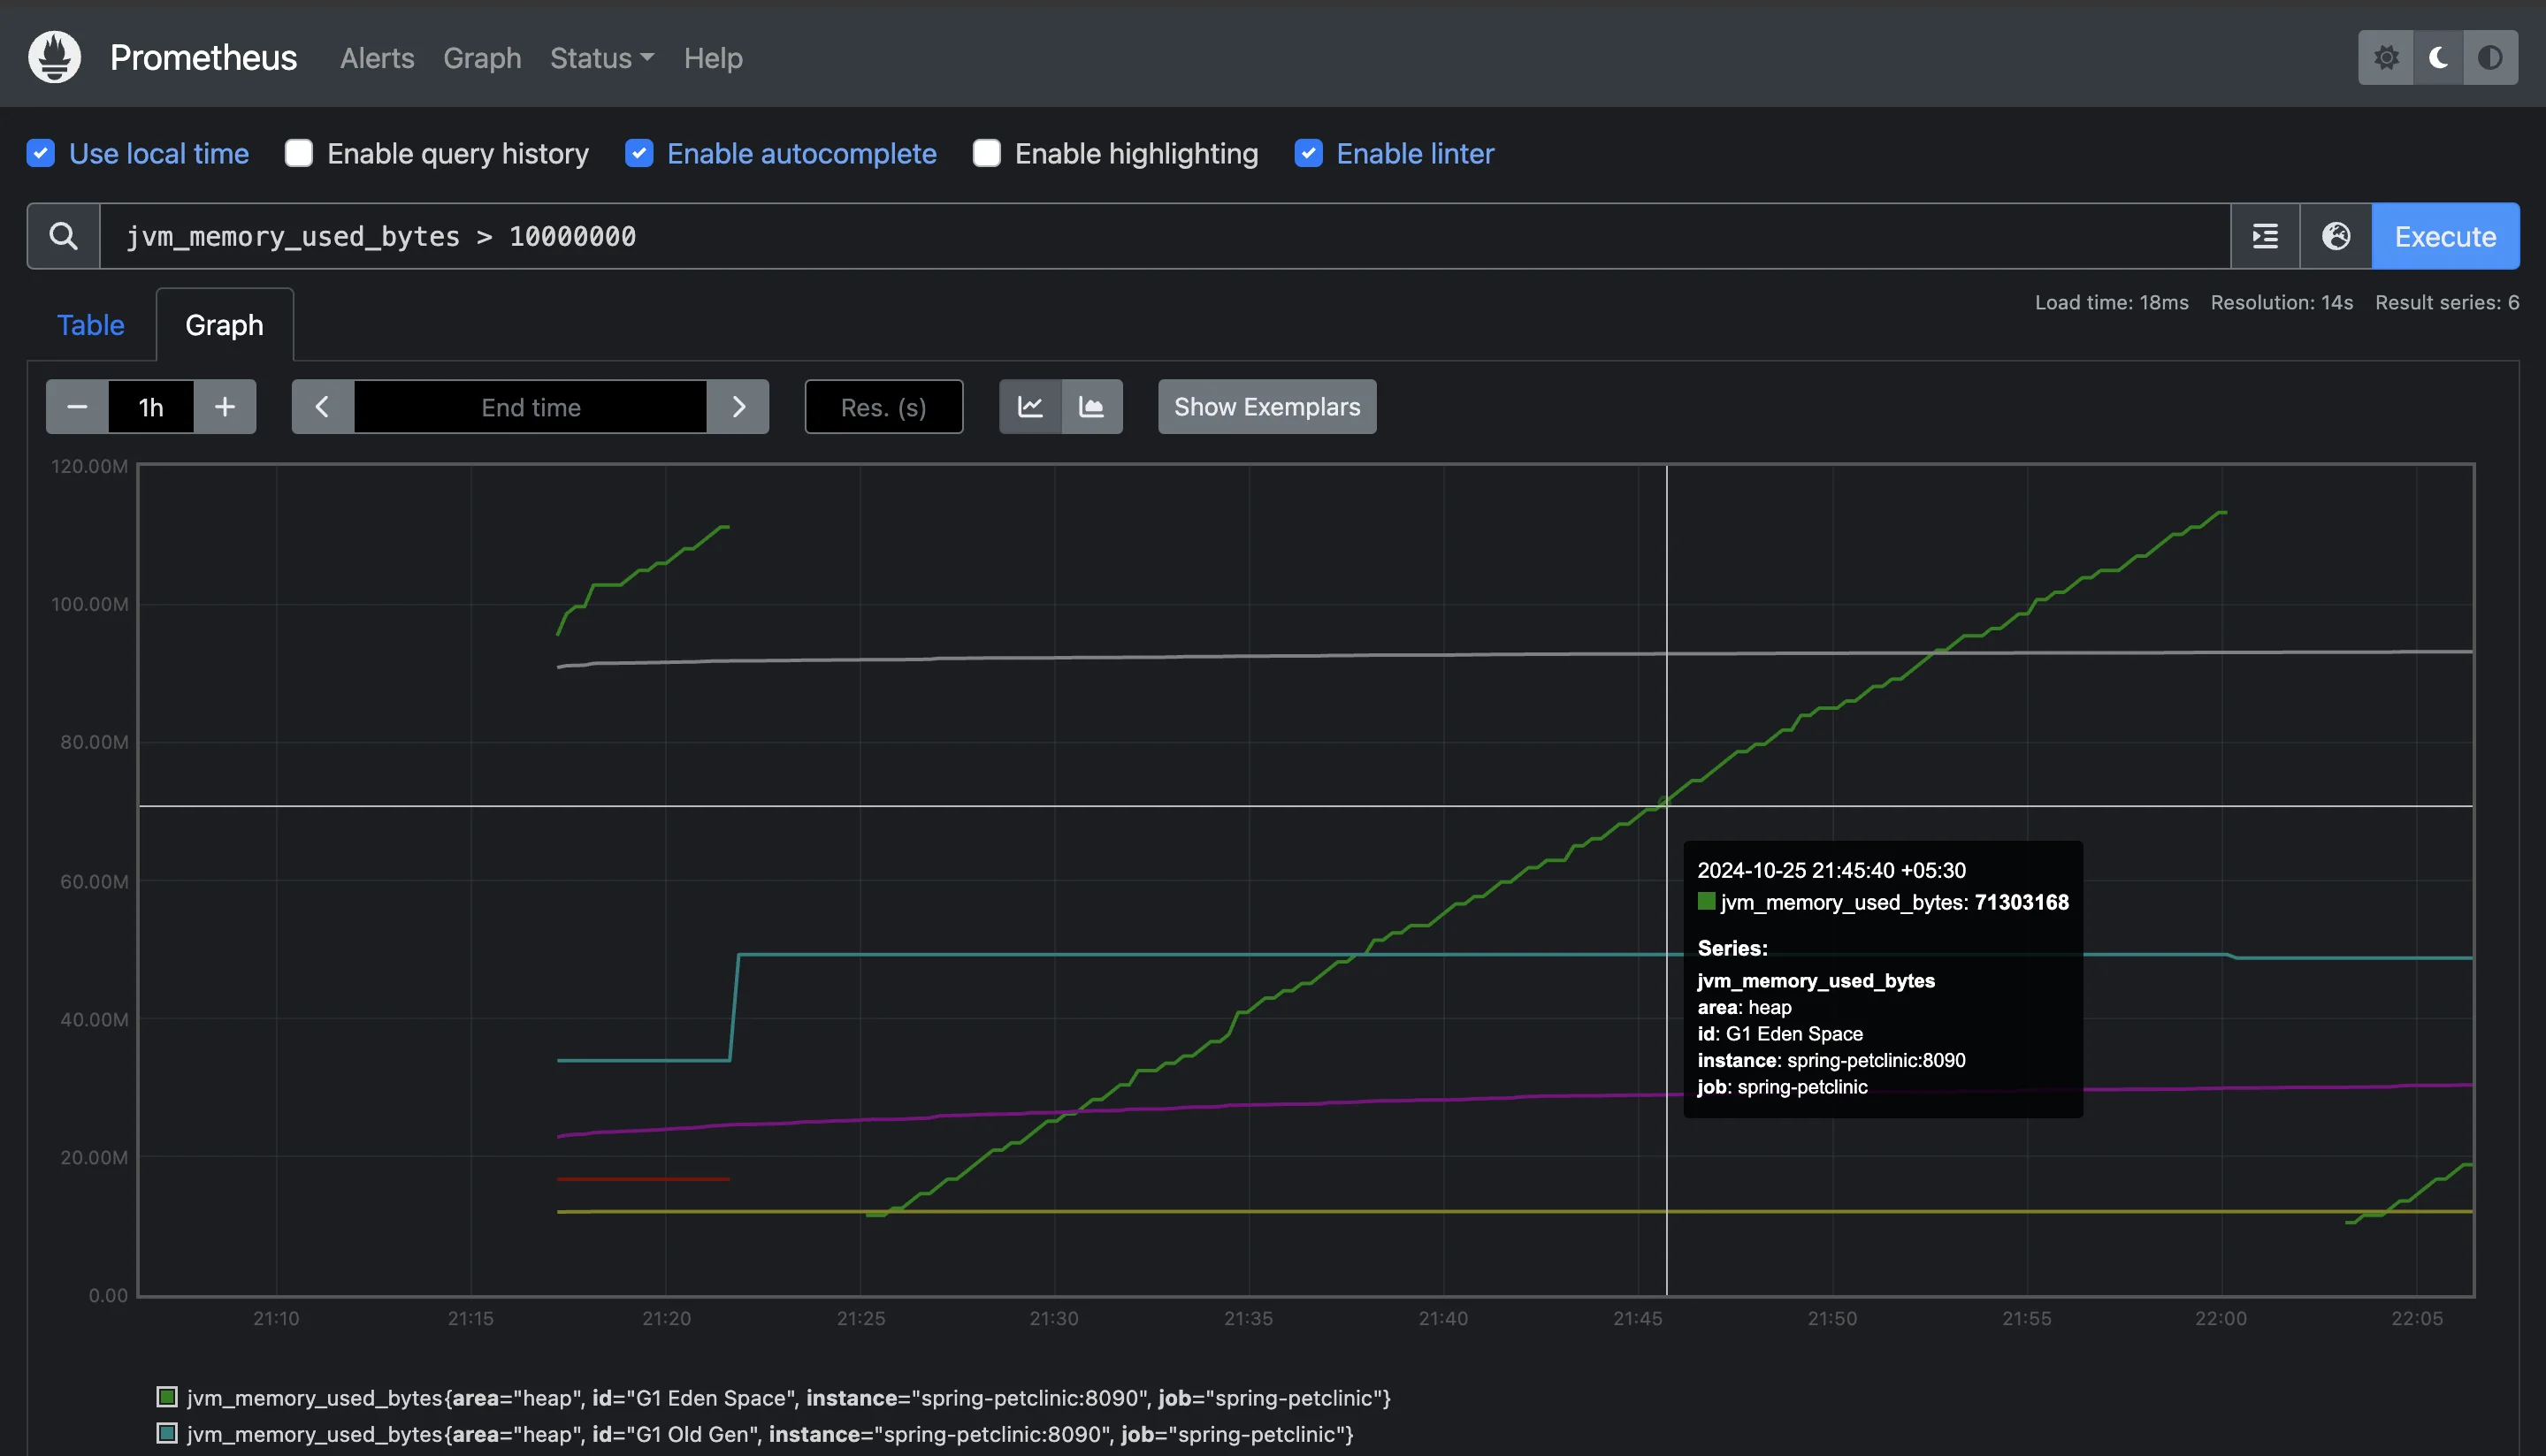
Adapt your queries to reflect changing system behaviors without modifying label structures. For example, if you want to monitor the JVM memory usage and focus on instances where the committed memory exceeds 50 MB, you can use:
jvm_memory_committed_bytes > 50 * 1024 * 10243. Complex Conditions
Value-based filtering allows you to create sophisticated queries that combine multiple conditions. This capability is particularly useful for analyzing several metrics simultaneously. For example, you might want to identify instances where both the live threads and CPU usage are above certain thresholds:
jvm_threads_live_threads > 20 and system_cpu_usage > 0.04This query provides a comprehensive view of resource utilization, allowing you to pinpoint potential issues that could affect system performance. However, if the values do not meet the conditions during the time of the query, it may return an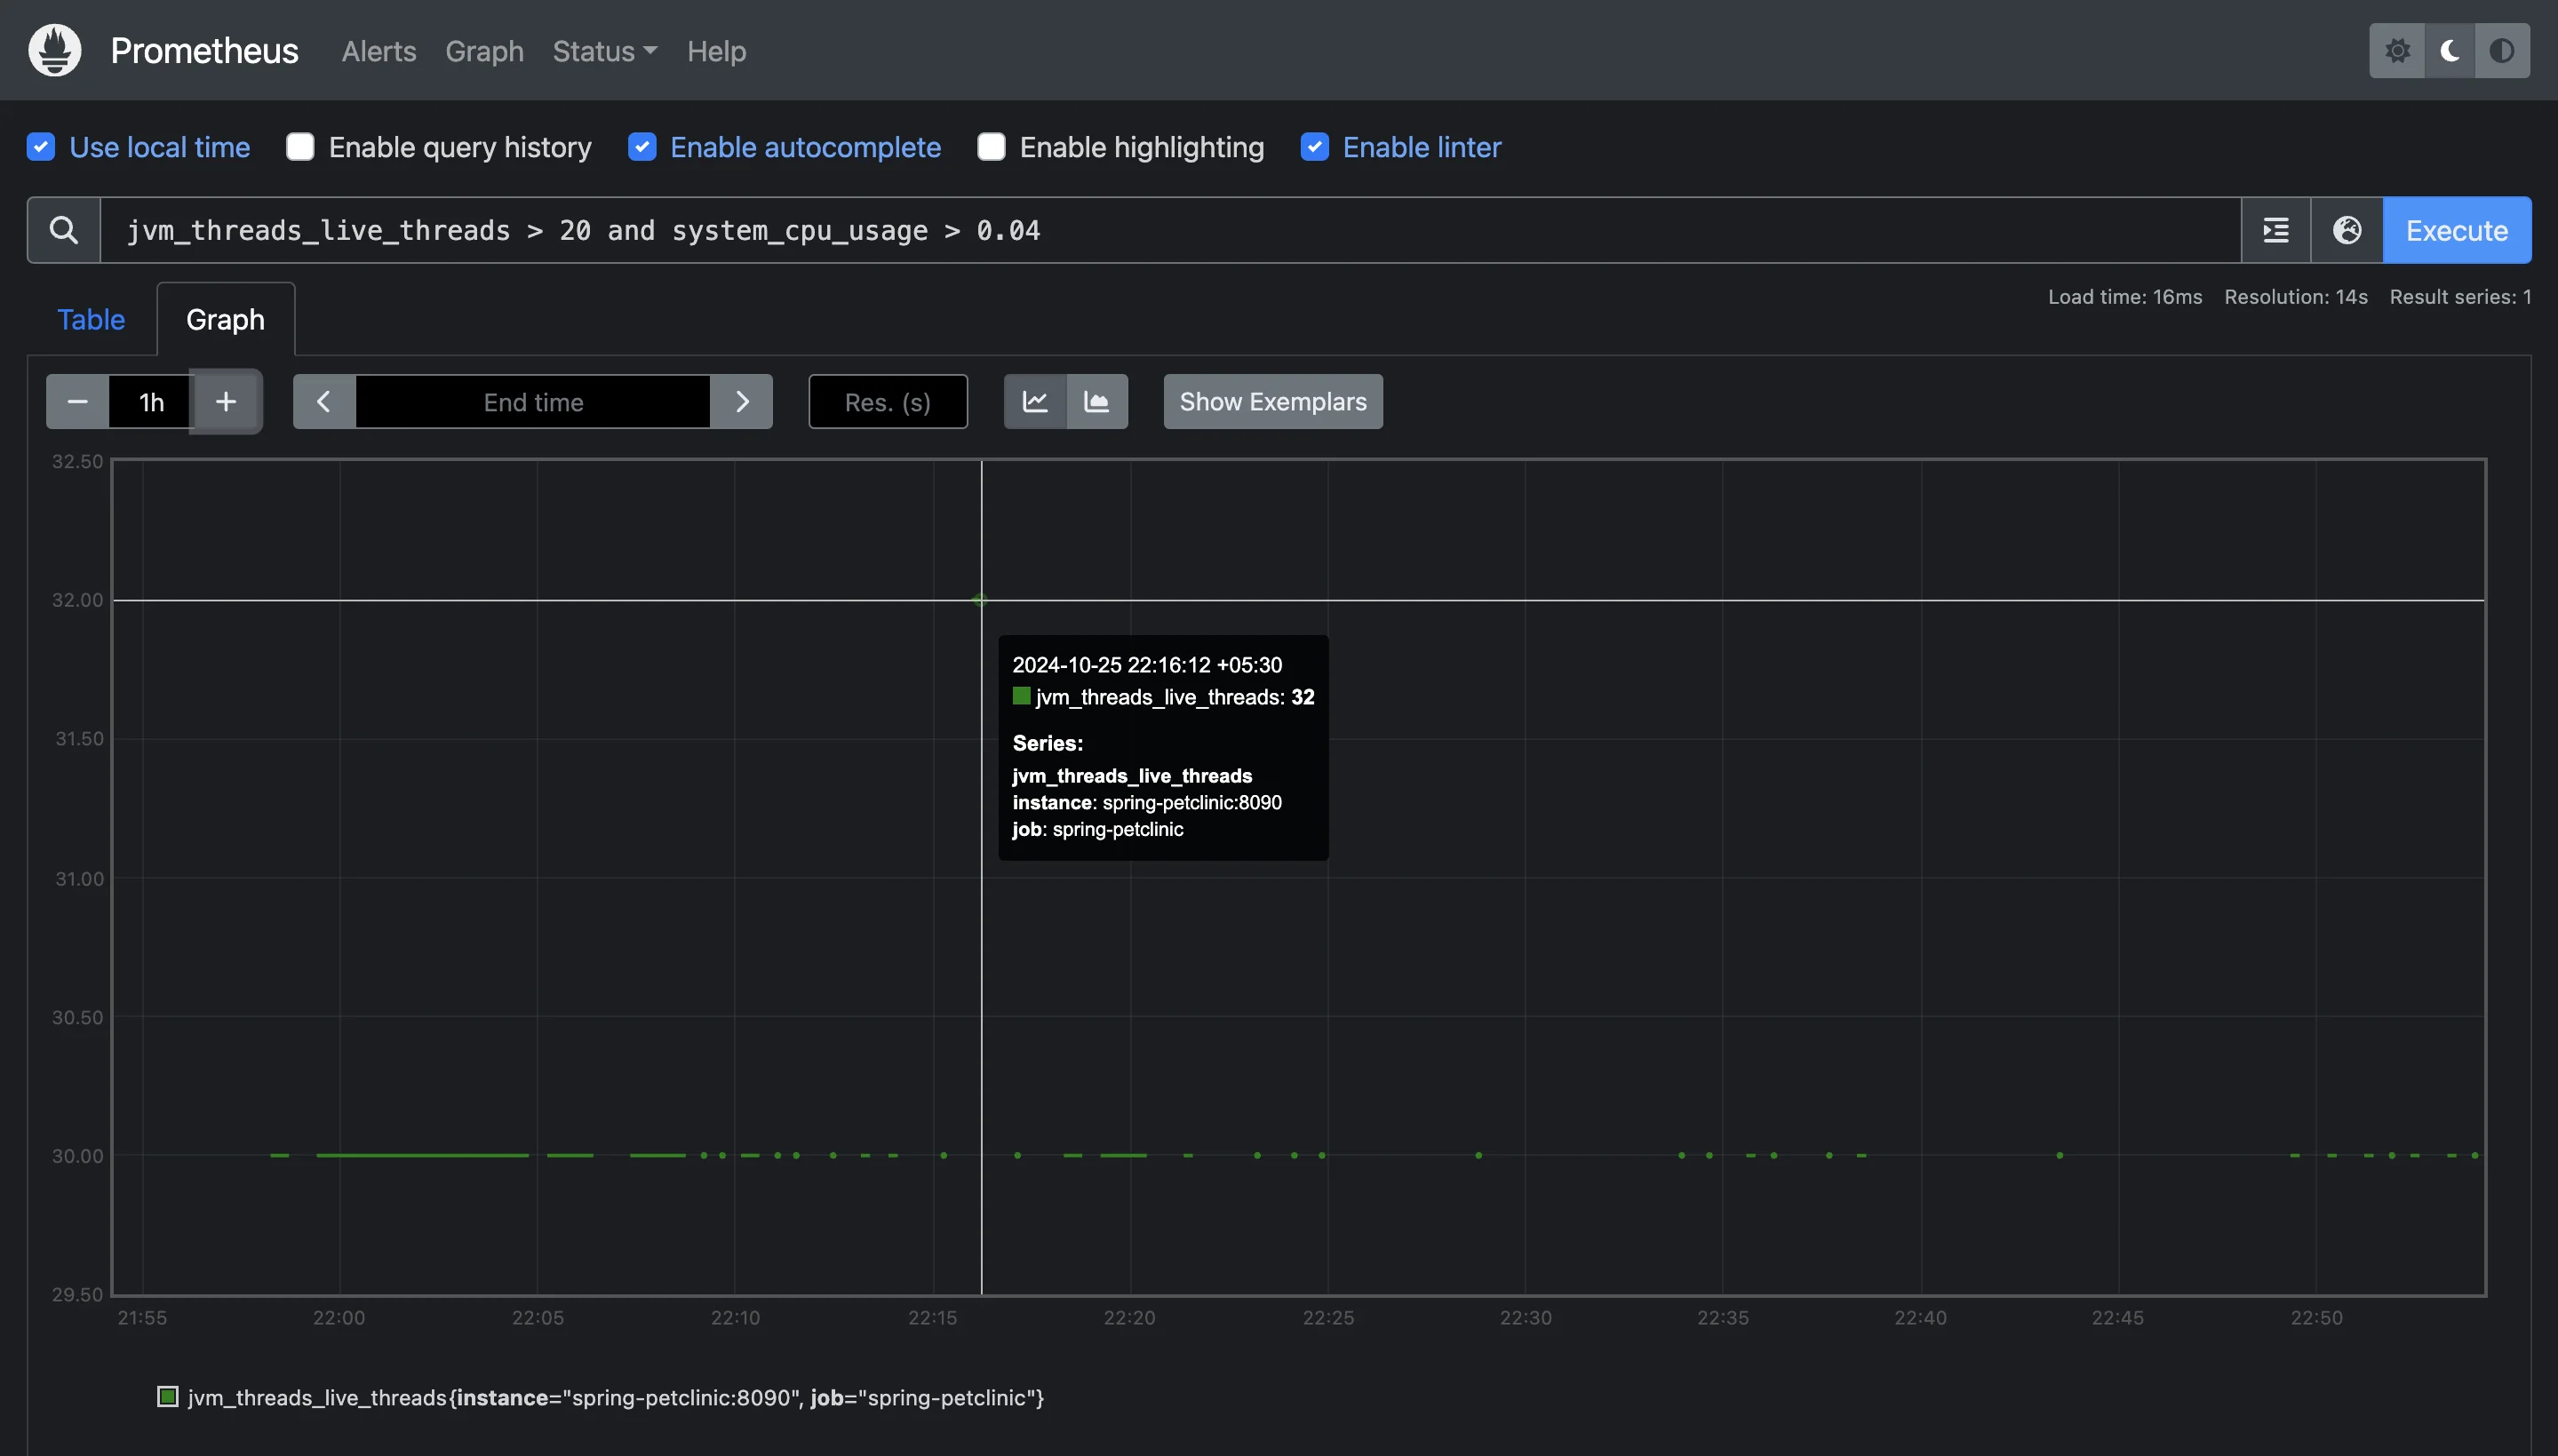
Empty Query result.Efficient Alerting
Setting up alerts based on actual metric values rather than predefined label categories leads to more effective monitoring. By using value-based conditions, you can ensure that alerts are triggered only when specific performance thresholds are breached. For example, to alert when the number of HTTP 500 errors exceeds a certain count within a defined time frame, you could use:
increase(jvm_gc_pause_seconds_count[5m]) >= 0This alert will only activate if there are more than 10 HTTP 500 errors in the last 5 minutes, allowing for a focused response to real issues.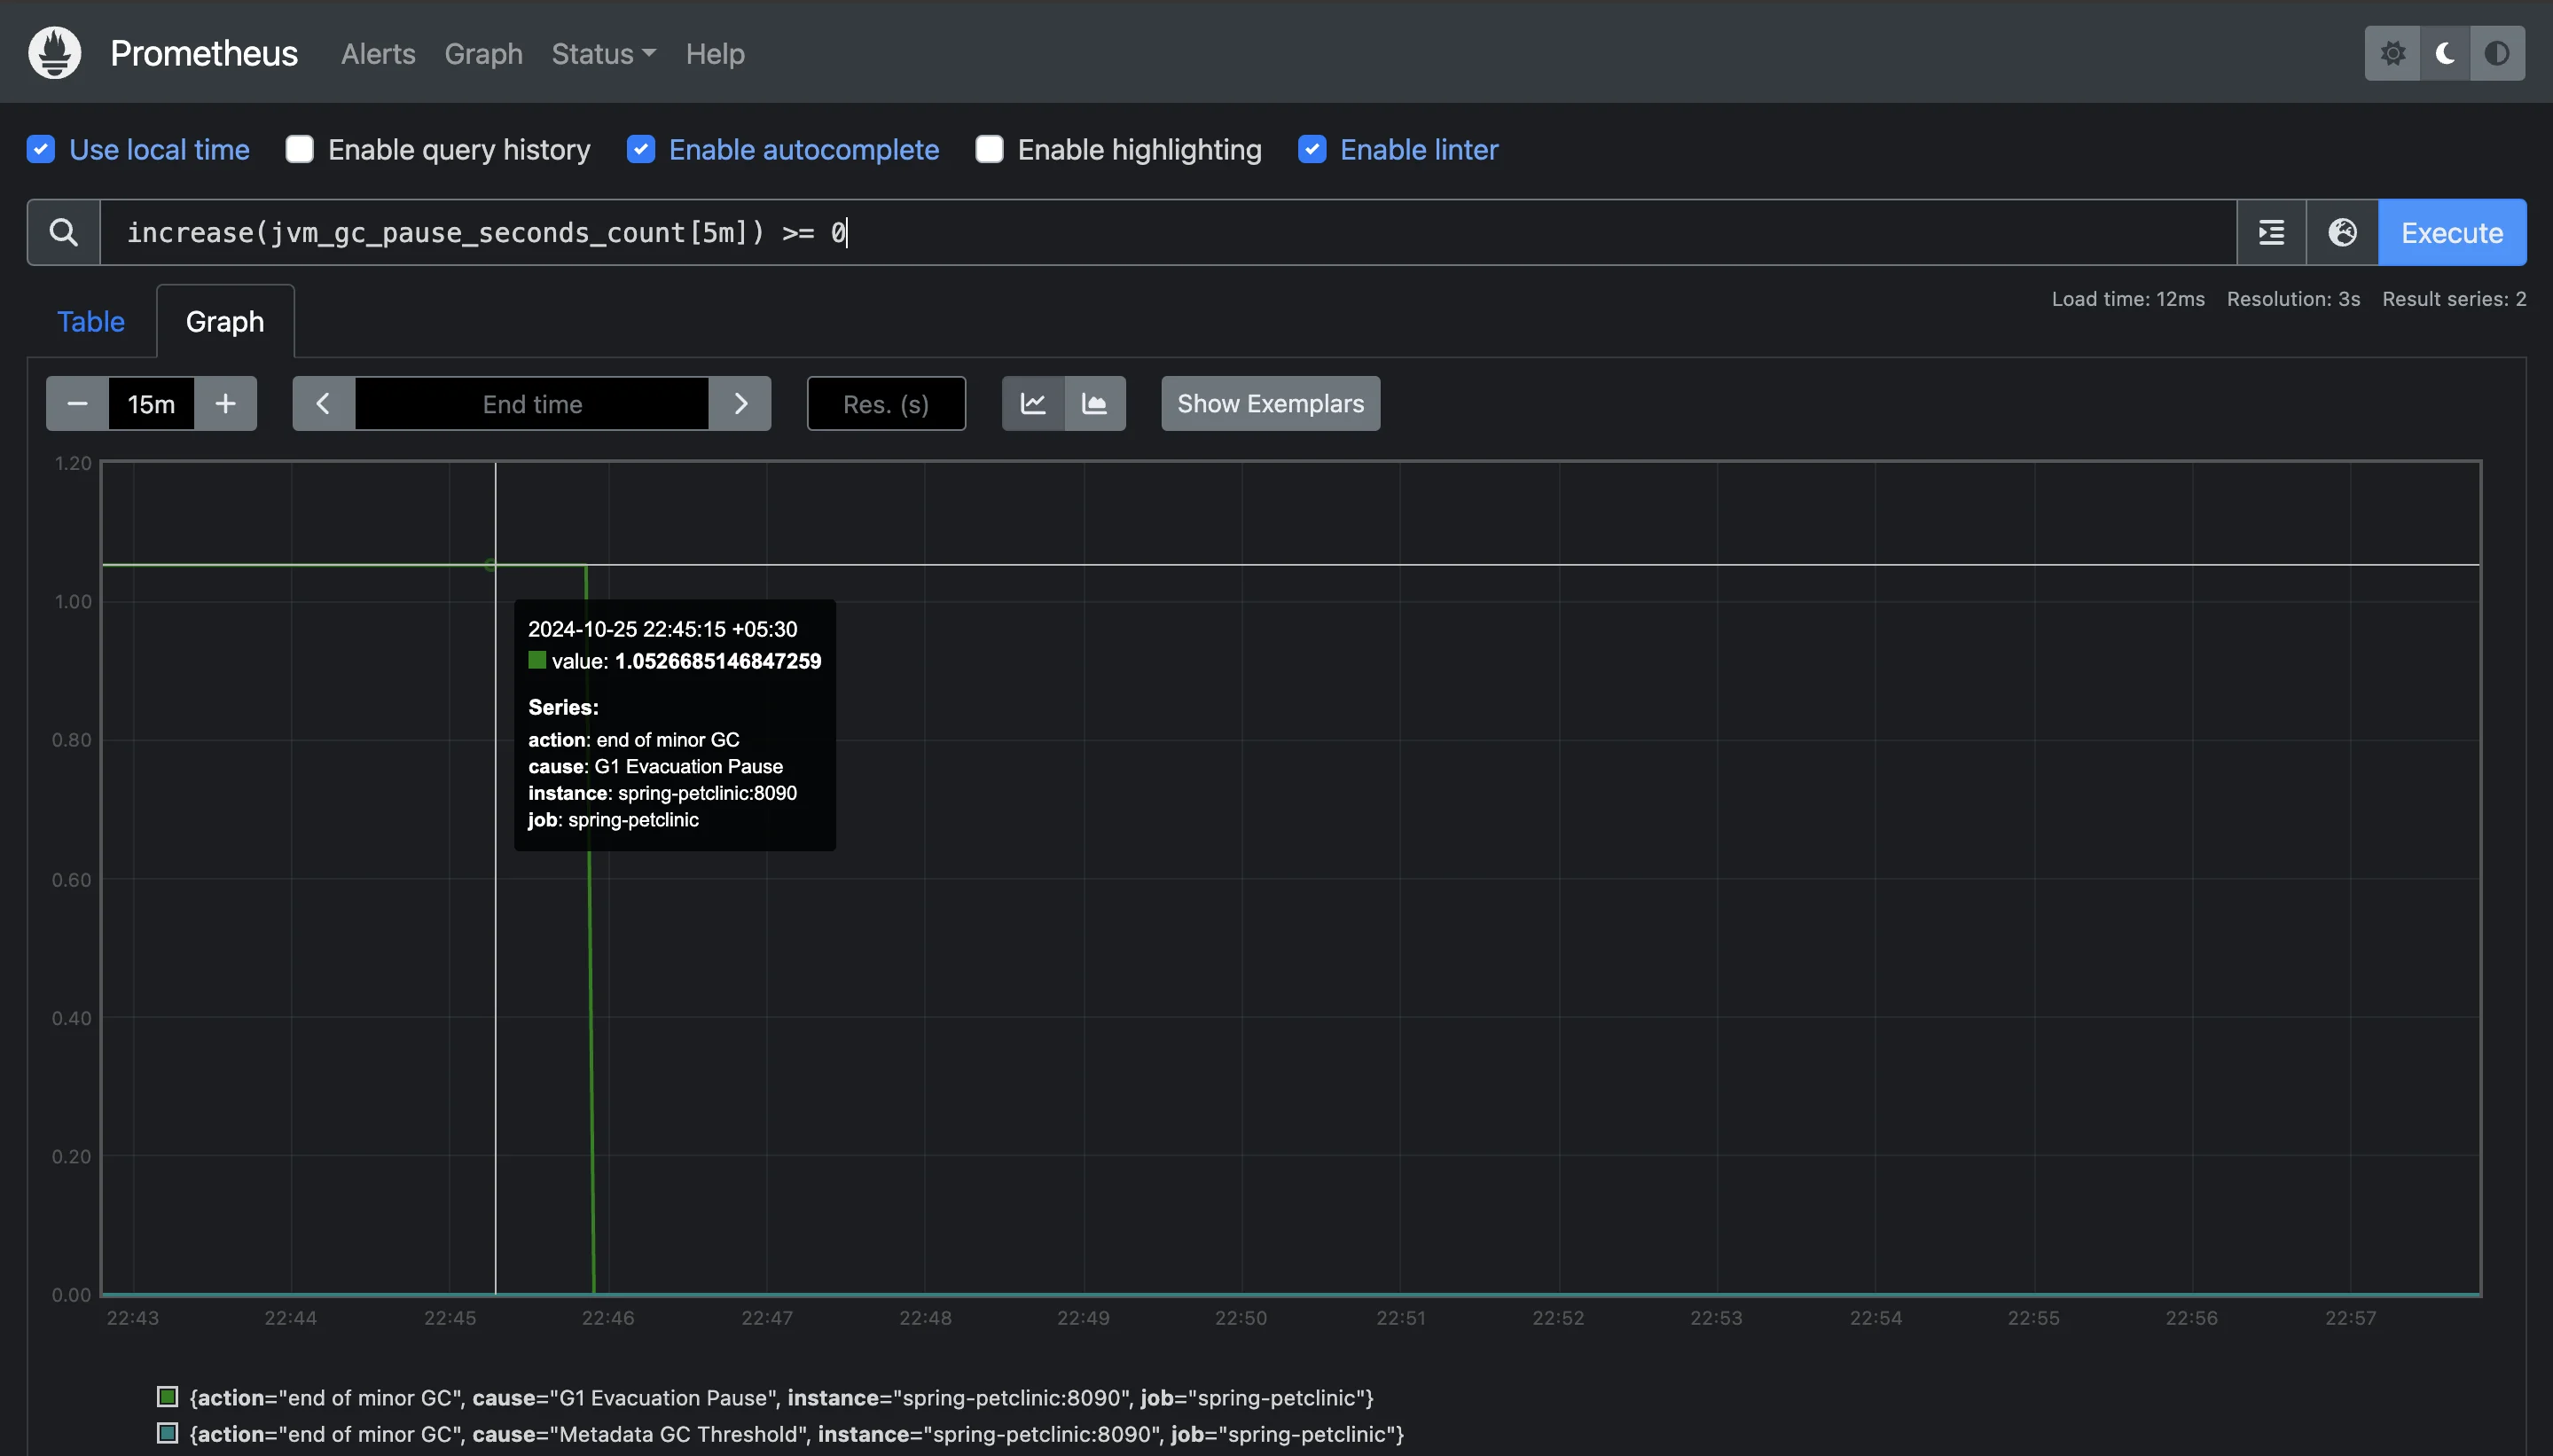
Monitoring CPU Usage
Consider a scenario where you need to identify all servers with CPU usage above 13%. Label-based filtering can't achieve this directly, but value-based filtering makes it straightforward:
system_cpu_usage > 0.13This query directly retrieves all instances where CPU utilization exceeds 80%, providing immediate insights into servers that may require scaling or optimization.
Comparison Between Label-Based and Value-Based Filtering
Understanding the differences between label-based and value-based filtering can help you choose the right approach for your monitoring needs:
- Focus:
- Label-Based Filtering: Primarily focuses on metadata (labels) associated with metrics. It's useful for grouping and segmenting data based on predefined categories.
- Value-Based Filtering: Concentrates on the actual numerical values of metrics, allowing for more nuanced analysis and dynamic querying based on real-time data.
- Query Complexity:
- Label-Based Filtering: Often limited to straightforward queries that rely on labels, which may not capture complex performance scenarios.
- Value-Based Filtering: Enables complex queries that combine multiple conditions, providing a deeper understanding of system performance.
- Alerting Efficiency:
- Label-Based Filtering: Alerts may be based on label categories, which can lead to false positives if not carefully defined.
- Value-Based Filtering: Triggers alerts based on specific metric values, reducing false positives and enhancing the effectiveness of monitoring.
Step-by-Step Guide: Filtering Prometheus Results by Metric Value
To filter Prometheus results by metric value, use PromQL (Prometheus Query Language) with comparison operators. Here's how:
Start with a Basic Metric Query
To begin, you’ll need to identify the metric you want to query. For example, if you want to monitor CPU utilization, you can use the following basic metric query:
node_cpu_utilizationAdd a Comparison Operator to Filter by Value
To filter the results by a specific value, use comparison operators like
>,<,=, etc. For instance, if you're interested in CPU utilization that exceeds 80%, you can modify the query as follows:node_cpu_utilization > 0.8This query returns only the instances where the CPU utilization is greater than 80%, helping you focus on high-utilization scenarios.
Combine with Label Filters for More Precise Results
Prometheus metrics come with labels, which provide additional context (e.g., job names, instance details). You can use these labels to further refine your query. For example, if you want to filter the CPU utilization of only your
webserverjob, you can add a label filter like this:node_cpu_utilization{job="webserver"} > 0.8This query will return CPU utilization exceeding 80%, but only for instances running in the
webserverjob.Use Logical Operators for Complex Conditions
To build more complex queries, you can combine multiple conditions using logical operators like
and,or, andunless. For example, if you want to monitor both high CPU and memory utilization, you can combine the two conditions as follows:node_cpu_utilization > 0.8 and node_memory_utilization > 0.7This query finds instances where both the CPU utilization is greater than 80% and the memory utilization is greater than 70%, helping you pinpoint systems under high load.
Best Practices for Writing Efficient Value-Based Queries
Writing efficient value-based queries in Prometheus is crucial for maximizing performance analysis and ensuring your monitoring system provides accurate and actionable insights. Here are some best practices to consider:
Use Appropriate Operators
Choose the right comparison operators to accurately reflect the conditions you want to monitor. Prometheus supports various operators, including:
- Greater than (
>): To find instances where a metric exceeds a certain value. - Less than (
<): To identify when a metric falls below a defined threshold. - Equality (
==): To filter metrics that match a specific value. - Inequality (
!=): To exclude metrics that match certain values. Using the correct operator ensures your queries return relevant results while minimizing unnecessary data retrieval.
- Greater than (
Leverage Time Ranges
Use time ranges effectively in your queries to focus on relevant periods. Prometheus allows you to specify time intervals, such as using functions like
rate()orincrease()to analyze changes over time. For example, if you want to monitor HTTP request rates, you can use:rate(http_requests_total[5m])This approach provides insights into trends and anomalies in metric values over the specified time range, helping you make informed decisions.
Filter with Labels
Combine value-based filtering with label selectors to refine your queries. While value-based filtering focuses on metric values, incorporating labels can help narrow down the results to specific instances or categories. For example:
http_requests_total{status="500"} > 10This query retrieves only those HTTP requests with a 500 status code that exceed a count of 10, making it easier to identify problematic areas in your application.
Minimize Result Cardinality
Be mindful of result cardinality when writing queries. High cardinality can lead to performance issues, as Prometheus needs to process a larger number of series. To minimize cardinality:
- Avoid using too many label dimensions in queries.
- Use value-based filtering to limit the number of time series returned. For instance:
cpu_usage > 0.8This approach retrieves only the instances where CPU usage exceeds 80%, reducing the number of series processed.
Utilize Functions Wisely
Take advantage of Prometheus functions to enhance your queries. Functions like
avg(),sum(), orcount()can help aggregate metrics effectively, providing a clearer picture of system performance. For example:avg(jvm_memory_used_bytes{area="heap"}) > 50 * 1024 * 1024This query calculates the average heap memory used across all instances, allowing you to monitor memory utilization trends without querying each instance individually.
Test Queries for Performance
Before deploying your queries in a production environment, test them to assess their performance. Use Prometheus's built-in tools to analyze query execution times and optimize as necessary. Pay attention to the time complexity and ensure that your queries return results efficiently, especially during peak usage.
By following these best practices, you can write efficient value-based queries that enhance your performance analysis capabilities in Prometheus, leading to improved monitoring, quicker issue resolution, and ultimately, a more reliable system.
Advanced Techniques for Value-Based Filtering
To effectively monitor your systems and applications in Prometheus, applying advanced techniques for value-based filtering can significantly enhance your query capabilities. Below are some of the key techniques you can utilize:
Using Functions like
avg(),sum(), andrate()with Value Filters Leveraging Prometheus' built-in functions allows for more sophisticated analysis of your metrics. You can apply aggregate functions to summarize and assess performance over time.- Average Request Duration:
avg(rate(http_request_duration_seconds[5m])) > 0.1This query identifies services where the average request duration exceeds 100 milliseconds over the last 5 minutes. It helps to pinpoint slow services that may affect user experience.
- Sum of CPU Utilization:
sum by (instance) (node_cpu_utilization) > 0.8This query calculates the total CPU utilization across all cores for each instance, filtering for instances where the total exceeds 80%. This helps in identifying heavily loaded systems.
Combining Label and Value Filters for Precise Results: Combining label filters with value filters allows you to refine your queries and target specific instances or jobs more effectively.
node_cpu_utilization{instance="server1"} > 0.8In this example, the query returns CPU utilization metrics for
server1that exceed 80%. This approach ensures that your monitoring efforts focus on the right targets without unnecessary noise from other instances.Handling Time Series with Multiple Samples in Value Filtering: Prometheus metrics often contain multiple samples over time, making it essential to use functions that consider historical data when filtering.
avg_over_time(node_cpu_utilization[5m]) > 0.75This query calculates the average CPU utilization over the past 5 minutes, returning instances where the average exceeds 75%. This helps smooth out fluctuations and provides a clearer picture of resource usage.
Troubleshooting Common Issues in Value-Based Filtering When using value-based filtering, you may encounter common challenges that can affect the accuracy of your queries.
- No Results: If your query returns no results, double-check that the metric name and labels match correctly. Also, ensure your value conditions aren't too restrictive.
- Unexpected Results: If the results seem off, verify that you're using the correct aggregation functions. For example, if summing values, confirm that you’re summing the right labels.
Practical Examples of Value-Based Filtering in Prometheus
Let's explore some real-world scenarios where value-based filtering shines:
Filtering High CPU Usage Metrics:
To identify instances where CPU utilization exceeds 80%, use the following query:
node_cpu_utilization > 80This helps in monitoring and addressing performance bottlenecks in your applications.
Identifying Slow HTTP Requests:
To track HTTP requests that take longer than 5 seconds, you can use:
http_request_duration_seconds > 5This query helps in pinpointing slow requests that may affect user experience.
High Memory Usage Detection:
To monitor Java applications, you can filter by memory usage to catch potential memory leaks or performance degradation. The following query identifies instances where non-heap memory usage in the Metaspace area exceeds 1 byte:
jvm_memory_used_bytes{area="nonheap", id="Metaspace", instance="host.docker.internal:8090", job="spring-petclinic-job"} > 1This query finds services where the 95th percentile of request durations exceeds 1 second.
Disk Space Alerts:
To monitor disk space usage, use this query to alert when any filesystem is more than 90% full:
(node_filesystem_avail_bytes / node_filesystem_size_bytes) * 100 < 10This alerts you when any filesystem is more than 90% full.
Unusual Network Traffic:
To detect instances receiving more than 1 MB/s of network traffic, use:
rate(node_network_receive_bytes_total[5m]) > 1e6This detects instances receiving more than 1 MB/s of network traffic.
Optimizing Prometheus Queries with Value-Based Filters
While value-based filters in Prometheus offer significant analytical capabilities, they can also impact query performance if not managed properly. Here are some optimization tips to ensure your queries run efficiently:
- Use Time Ranges Judiciously: When formulating your queries, limit the time range to only what is necessary. Narrowing the time frame helps reduce the amount of data Prometheus needs to process, leading to faster query execution. For instance, instead of querying for data over an entire month, consider specifying a range of a few hours or days if that suffices for your analysis.
- Leverage Label Pre-Filtering: Combine label filters with value-based filters to narrow down the dataset before applying more complex queries. By first filtering with labels, you can significantly reduce the volume of data that the subsequent value-based filtering needs to process. This method enhances performance by minimizing the data set size upfront.
- Avoid Unnecessary Precision: In some cases, the exact precision of values may not be essential for your analysis. When it is acceptable, consider rounding values or simplifying comparisons. This approach can help to streamline your queries and reduce the computational load on Prometheus.
- Use Subqueries sparingly: Subqueries enable complex inquiries by nesting questions within others, but they may be resource-intensive, particularly when working with huge datasets. Use subqueries only when absolutely necessary, and examine alternatives that may get identical results without adding complexity or costs.
By following these optimization strategies, you can enhance the performance of your Prometheus queries with value-based filters. This not only improves response times but also ensures that you derive actionable insights without placing undue strain on your monitoring system.
Integrating Value-Based Filtering with Grafana Dashboards
Grafana, a popular visualization tool for Prometheus, supports value-based filtering in dashboards:
Design Your Dashboard Layout: Start by outlining the layout of your dashboard. Identify the key metrics you want to visualize, such as CPU usage, memory consumption, or request latency. A well-organized layout enhances readability and makes it easier to spot trends.
2. Add Panels for Key Metrics: Use Grafana panels to display different metrics. Each panel can represent a specific value-based query. For instance, a panel showing high CPU usage might use the query: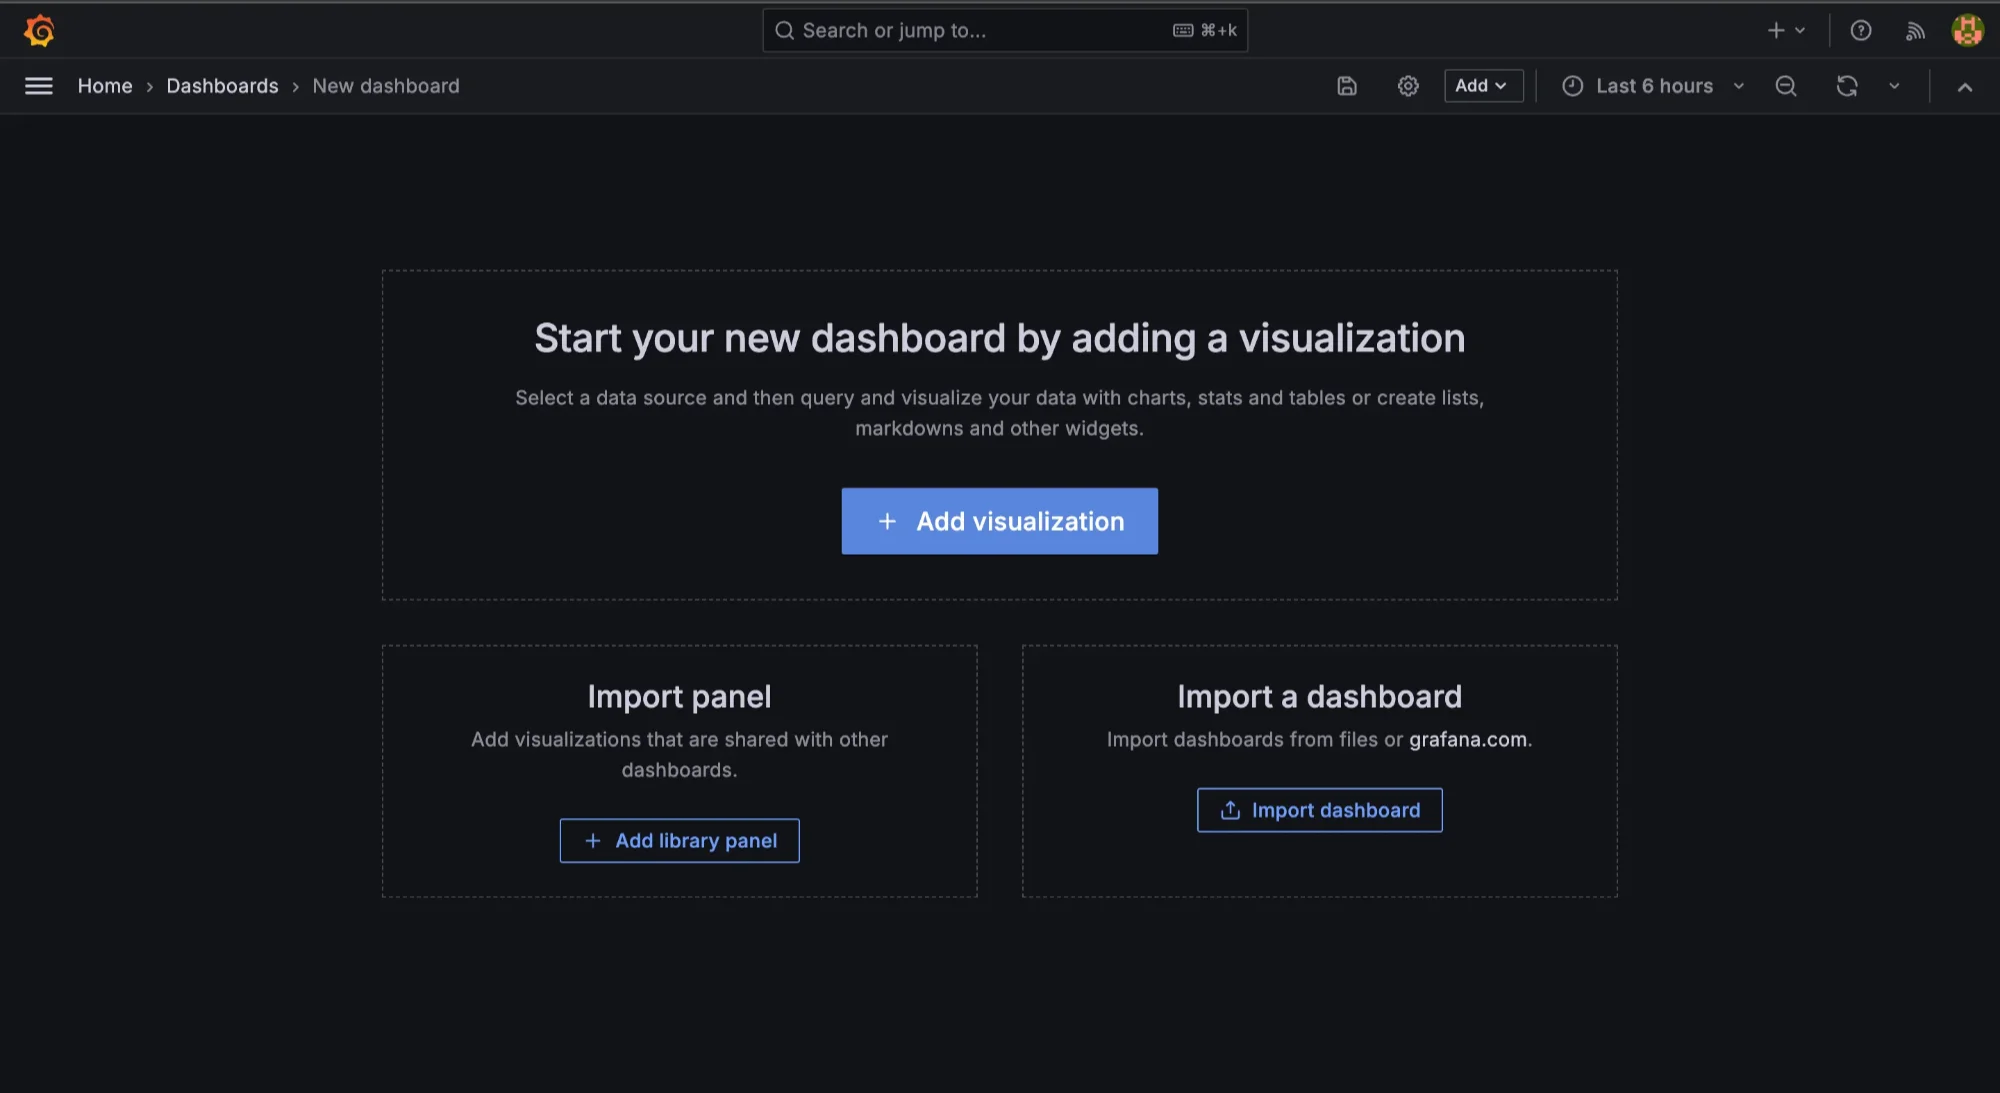
process_cpu_usage > 0.002By displaying these metrics side-by-side, you can quickly assess the overall system health.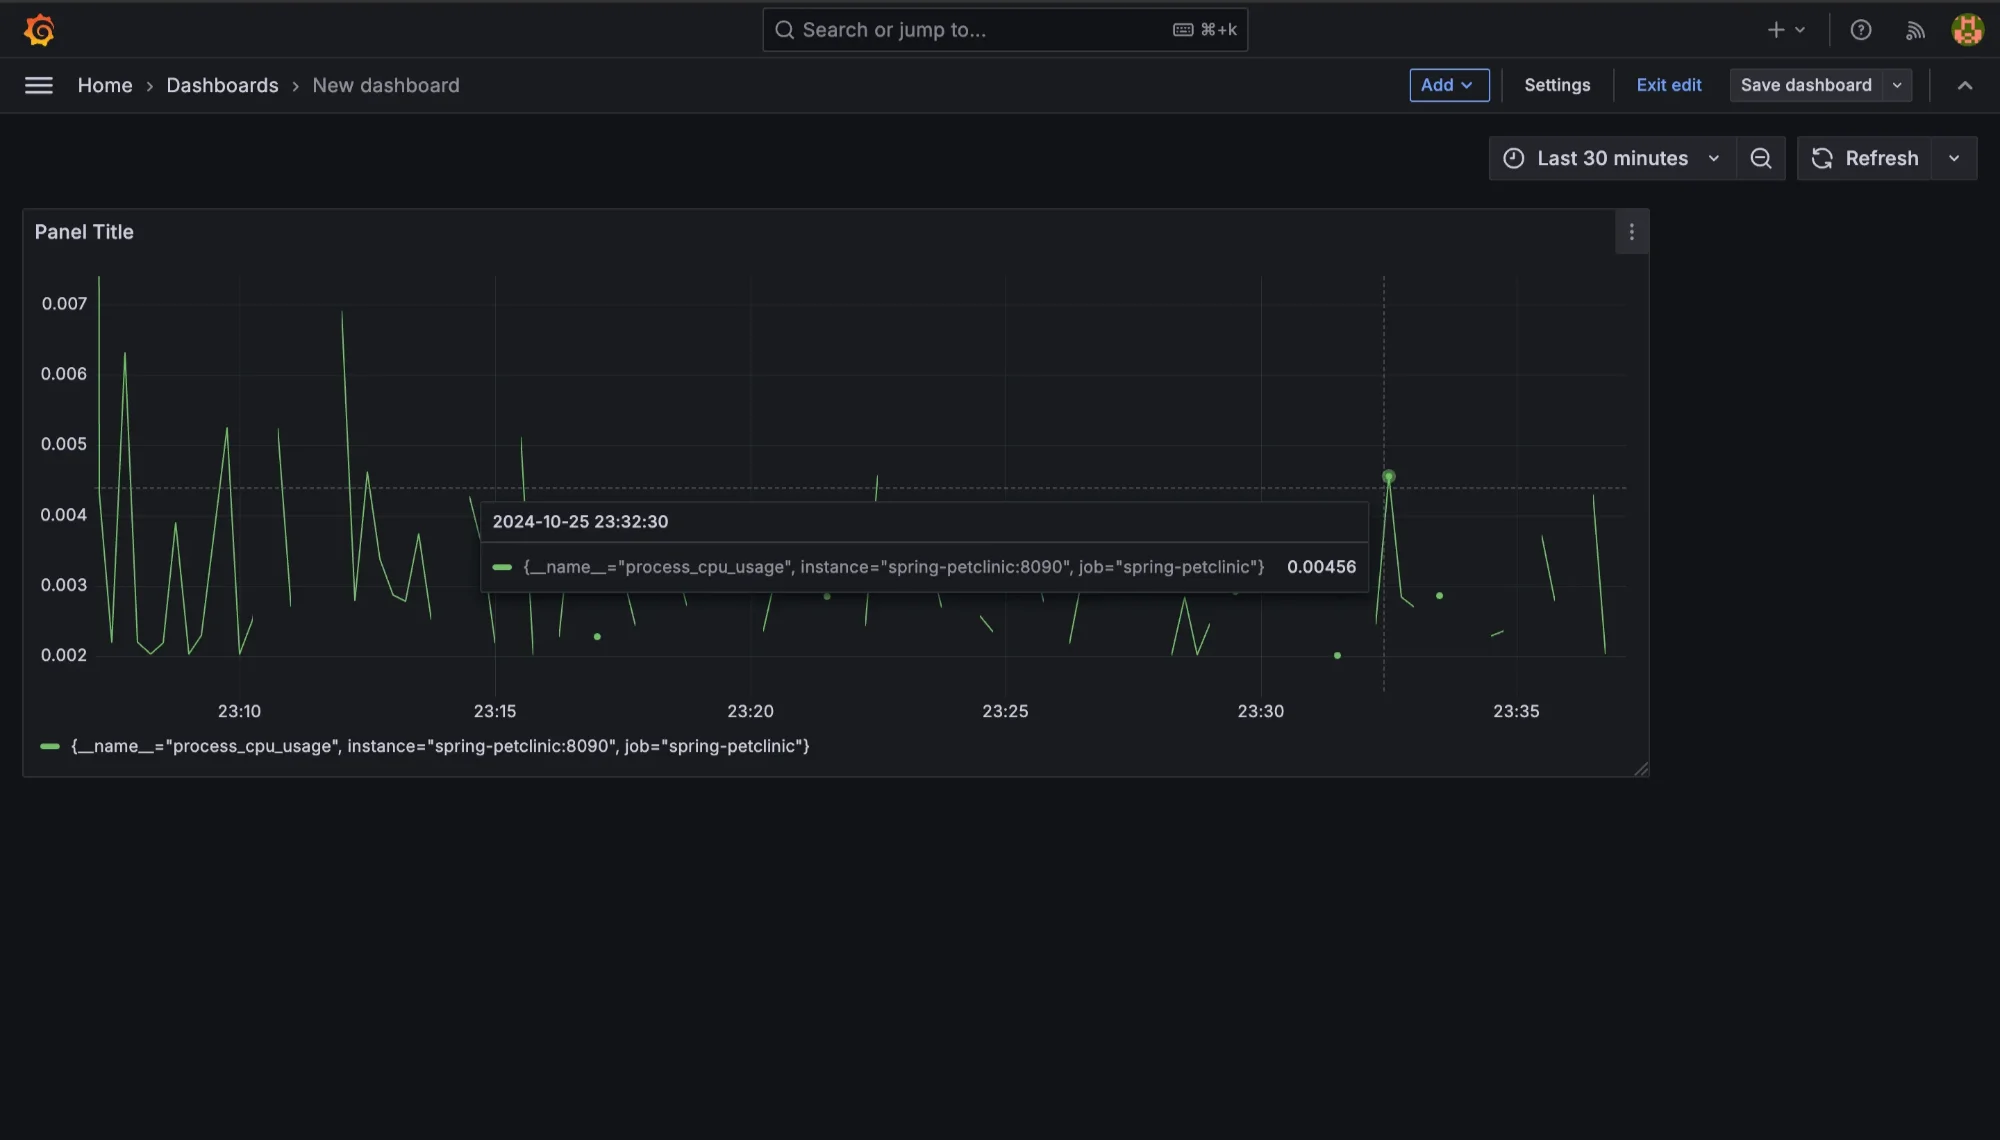
Utilize Graphs and Alerts: Choose appropriate visualization types for your metrics. Use time-series graphs for metrics that change over time, such as CPU and memory utilization. Set up alerts for any value-based filters you define. For example, configure alerts for CPU utilization exceeding a certain threshold, ensuring your team can respond proactively.
4. Interactive Controls: Grafana allows for interactive controls, such as sliders or dropdown menus, to adjust filter values dynamically. This interactivity enables users to tweak thresholds on the fly, facilitating real-time analysis without needing to modify queries manually.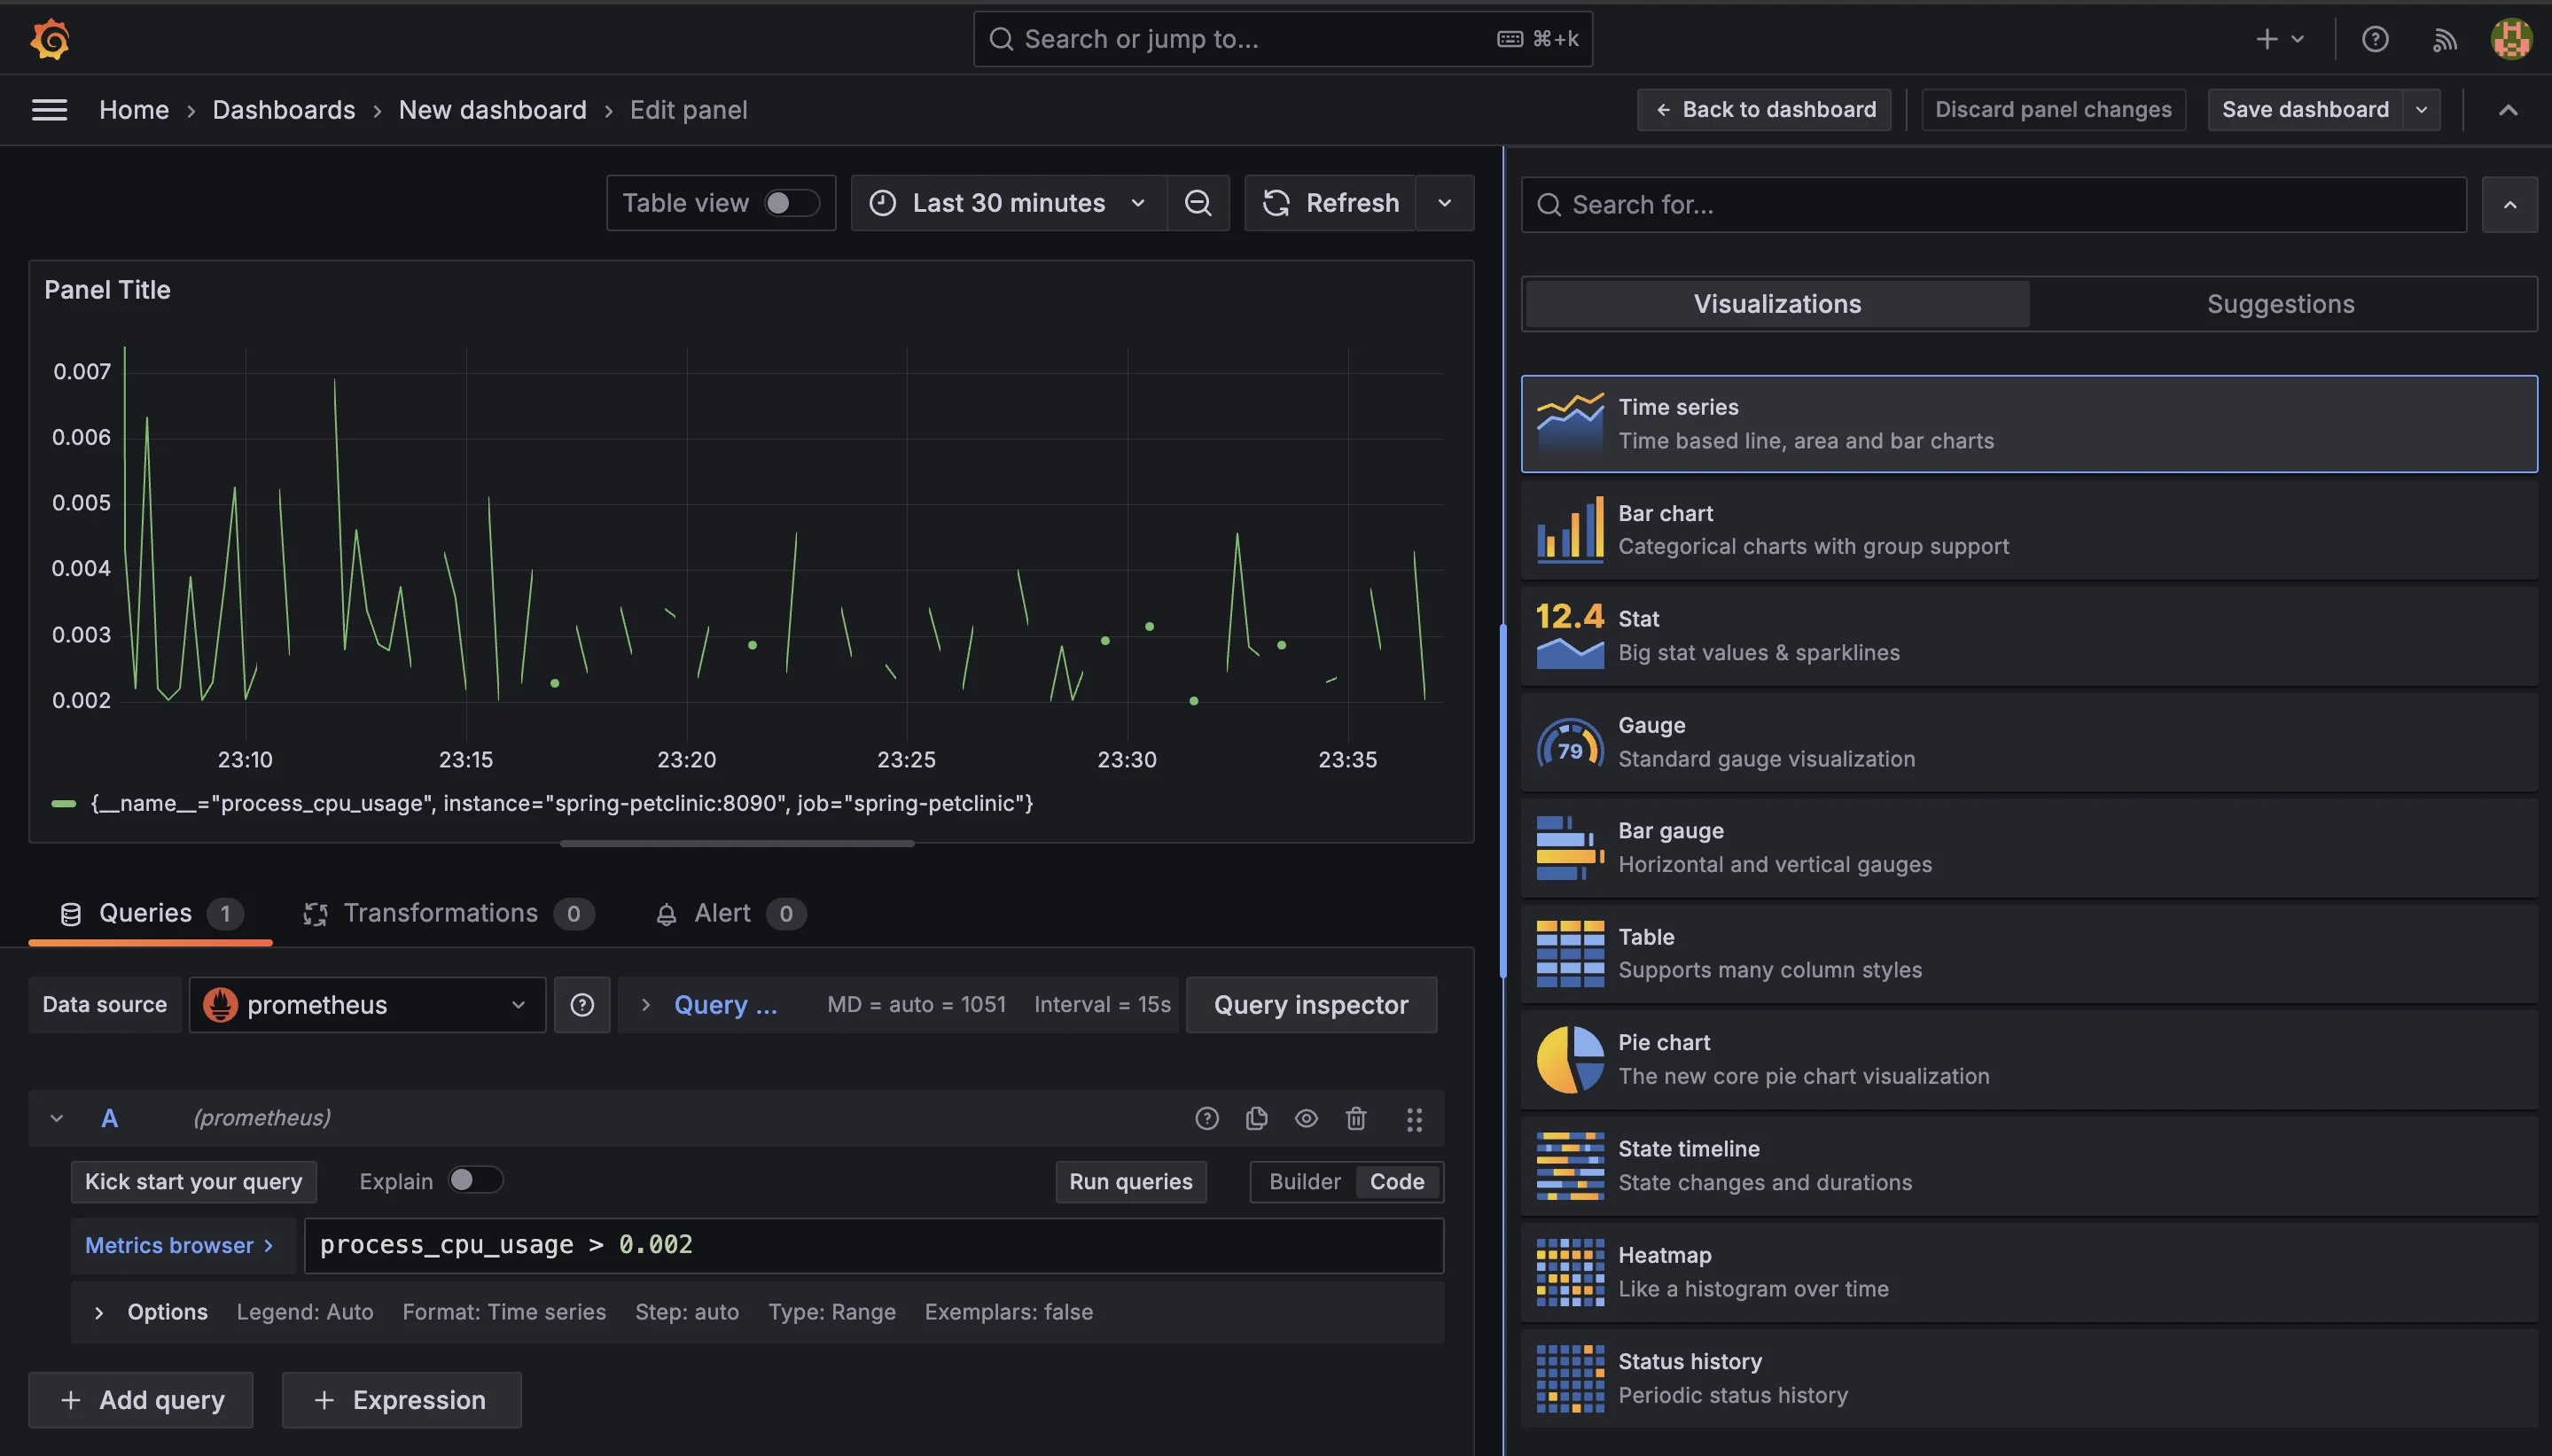
Using Template Variables for Flexible Value Thresholds
Defining Template Variables: Create template variables in Grafana to make your dashboards more dynamic. For instance, you can define a variable for CPU thresholds:
$cpu_thresholdThis variable allows users to input a custom threshold for CPU utilization directly from the dashboard.
Integrating Variables into Queries: Modify your queries to incorporate these template variables. For example:
node_cpu_utilization > $cpu_thresholdThis integration provides flexibility, allowing users to experiment with different threshold values without editing the query itself.
Dynamic Dropdowns: You can also create dropdown menus for users to select from predefined values. For instance, you might allow users to choose between different services or regions, making it easier to tailor the dashboard to their specific needs.
Best Practices for Visualizing Value-Filtered Metrics
- Choose the Right Visualization Type: Selecting the appropriate visualization type is crucial. For metrics that vary over time, time-series graphs work best. For categorical data, consider using bar charts. The right choice helps convey the data's story effectively.
- Color Coding for Clarity: Utilize color coding to indicate performance states. For example, use green for healthy metrics, yellow for warning states, and red for critical alerts. This visual differentiation allows users to quickly identify areas requiring attention.
- Annotations for Context: Use annotations in Grafana to mark important events or changes in your system. This provides context for spikes or drops in metrics, helping users understand the underlying reasons for changes.
- Limit Panel Clutter: Avoid overcrowding your dashboard with too many panels. Focus on key metrics that provide actionable insights. A clean, well-organized dashboard helps users quickly identify performance issues without feeling overwhelmed.
Troubleshooting Common Grafana-Prometheus Integration Issues
- Data Source Configuration: Ensure that your Prometheus data source is correctly configured in Grafana. Check the URL, access permissions, and authentication settings to prevent connection issues.
- Query Errors: If queries return unexpected results or errors, verify the syntax and logic of your PromQL queries. Using the Prometheus expression browser can help you test queries before implementing them in Grafana.
- Performance Optimization: If dashboards load slowly, consider optimizing your queries. High cardinality or complex queries can slow down performance. Limit the data points retrieved and use aggregation functions wisely to enhance performance.
- Alerts Not Triggering: If alerts aren’t firing as expected, check the alert rules and conditions. Ensure that thresholds are set correctly and that the alerting mechanism (like email or Slack notifications) is properly configured.
Enhancing Observability with SigNoz
To effectively monitor your applications and systems, leveraging an advanced observability platform like SigNoz can elevate your monitoring strategy. SigNoz is an open-source observability tool that provides end-to-end monitoring, troubleshooting, and alerting capabilities across your entire application stack.
Built on OpenTelemetry—the emerging industry standard for telemetry data—SigNoz integrates seamlessly with your existing Prometheus and Grafana setup. This unified observability solution enhances your ability to monitor HTTP requests per minute alongside deep traces, giving you a comprehensive view of your application's performance. SigNoz complements this setup by offering additional monitoring features:
- User-Friendly Interface: Easily build complex queries without in-depth PromQL knowledge, making insights accessible for all skill levels.
- Advanced Filtering & Aggregations: Perform detailed analysis using functions for averages, sums, and rate calculations to optimize performance insights.
- Comprehensive Insights: Gain a unified view of system health by correlating metrics, traces, and logs, simplifying issue diagnosis and enhancing system understanding.
To enhance your observability with SigNoz, you can follow the OpenTelemetry Collector Prometheus Receiver guide for seamless integration with Prometheus metrics.
SigNoz Cloud is the easiest way to run SigNoz. Sign up for a free account and get 30 days of unlimited access to all features.
You can also install and self-host SigNoz yourself since it is open-source. With 24,000+ GitHub stars, open-source SigNoz is loved by developers. Find the instructions to self-host SigNoz.
Key Takeaways
- Value-Based Filtering: Prometheus allows you to analyze metrics using value-based filtering, which provides insights that go beyond traditional label-based queries. This capability enables you to identify metrics based on specific numerical values, facilitating precise performance analysis.
- PromQL Flexibility: The Prometheus Query Language (PromQL) provides a wide range of comparison and logical operators, allowing you to write sophisticated queries that assess several criteria at the same time. This adaptability is essential for extensive examination of system performance.
- Combining Filters: For optimal query performance and accuracy, you can combine both label and value filters in your queries. This approach helps you refine your results, ensuring you capture only the most relevant metrics for your monitoring needs.
- Advanced Techniques: Techniques such as subqueries and vector matching further enhance your filtering capabilities. These advanced methods enable you to perform more sophisticated analyses, allowing for better insights into the relationships between different metrics.
- Utilizing Visualization Tools: Tools like Grafana and SigNoz integrate seamlessly with Prometheus, simplifying the implementation of value-based filtering in your monitoring workflows. These platforms provide visual representations of your data, making it easier to interpret and respond to insights.
- By mastering value-based filtering in Prometheus, you unlock a new level of insight into your system's performance. Whether you are using native Prometheus queries or leveraging advanced platforms like SigNoz, these techniques empower you to develop more effective, precise, and actionable monitoring solutions. This mastery can lead to improved system reliability, enhanced performance, and proactive incident management.
FAQs
What's the difference between filtering by label and filtering by metric value in Prometheus?
Filtering by label allows you to select time series based on their metadata (labels), which categorize the data (like service name, instance, or environment). In contrast, filtering by metric value focuses on the actual numerical values of the metrics, enabling you to perform threshold-based analysis. Label filtering is effective for grouping and segmenting data, while value filtering allows for dynamic queries that assess the performance or health of metrics against specific criteria.
How can I combine multiple value-based filters in a single Prometheus query?
You can combine multiple value-based filters using logical operators such as and, or, and unless. For example:
node_cpu_utilization > 0.8 and node_memory_utilization > 0.7
This query identifies instances that are experiencing both high CPU and high memory usage, allowing you to monitor performance more comprehensively.
Are there any performance considerations when using complex value-based filters?
Yes, complex value-based filters can consume more resources than simpler label filters. To optimize performance:
- Use label pre-filtering when possible to narrow down the data set first.
- Limit the time ranges in your queries to reduce the amount of data processed.
- Avoid unnecessary high-precision comparisons, as they can increase computational load.
- Employ aggregation functions to condense the data set before applying value filters, making the queries more efficient.
Can I use value-based filtering with PromQL functions like rate() or increase()?
Absolutely! You can apply value-based filters to the results of PromQL functions. For instance:
rate(http_requests_total[5m]) > 100
This query identifies services that are handling more than 100 requests per second over the last 5 minutes, allowing you to focus on high-traffic services and potential performance issues.
