How to Count Specific Log Messages in Grafana Loki
In today's complex software ecosystems, effective log management is crucial for maintaining system health and troubleshooting issues. Grafana Loki, a powerful log aggregation system, offers robust capabilities for analyzing and quantifying log data. This article provides a comprehensive guide on how to count specific log messages in Grafana Loki, enabling you to gain valuable insights from your log data and enhance your observability practices.
Understanding Grafana Loki and Log Counting
Grafana Loki is a scalable log aggregation tool. It’s optimized for efficiency, using labels to index log metadata instead of full-text indexing, keeping storage and query overhead low.
Log messages are timestamped records of events within your systems and applications. They provide crucial information for monitoring, troubleshooting, and maintaining the health of your infrastructure. Counting specific log messages allows you to quantify occurrences of particular events, errors, or patterns within your logs.
The challenge in counting specific log messages is efficiently querying and aggregating large volumes of log data. This is where Loki's query language, LogQL, comes into play. LogQL provides powerful tools for filtering, aggregating, and analyzing log data, enabling you to extract meaningful metrics from your logs.
Why Count Specific Log Messages?
Counting specific log messages offers several benefits for system administrators, developers, and DevOps teams:
- Error quantification: By counting error messages, you can track the frequency of specific issues and prioritize your troubleshooting efforts.
- Example: Suppose you're counting error messages related to "OutOfMemory" in your logs. If they spike after a new deployment, you can prioritize fixing memory leaks.
- Performance optimization: Identifying recurring patterns in log messages helps pinpoint areas for performance improvements.
- Example: By tracking logs for slow database queries, you notice frequent "query timeout" errors, indicating that you need to optimize your database indexes.
- Capacity planning: Tracking the volume of certain log messages over time aids in predicting resource needs and scaling decisions.
- Example: If you see a steady increase in "disk full" warnings over time, you can proactively add storage capacity before it impacts system performance.
- Security monitoring: Counting authentication failures or suspicious activity logs enhances your ability to detect and respond to security threats.
- Example: If you count failed login attempts and notice a surge of "invalid password" logs, you can quickly investigate potential brute-force attacks.
- Compliance reporting: Quantifying specific log events supports compliance requirements by providing concrete data on system activities.
- Example: To meet audit requirements, you might count all "user access" logs over a month to show that only authorized users accessed sensitive data.
Setting Up Grafana Loki for Log Counting
Before you can start counting log messages, you need to set up Grafana Loki and configure it to ingest your logs. Here's a brief guide to get you started:
Install Grafana Loki using Docker or your preferred deployment method. The quickest way is with Docker:
docker run -d --name=loki -p 3100:3100 grafana/loki:latestConfigure log sources to send data to Loki using a compatible agent like Promtail.
Add Loki as a data source in Grafana:
Navigate to Configuration > Data Sources in Grafana
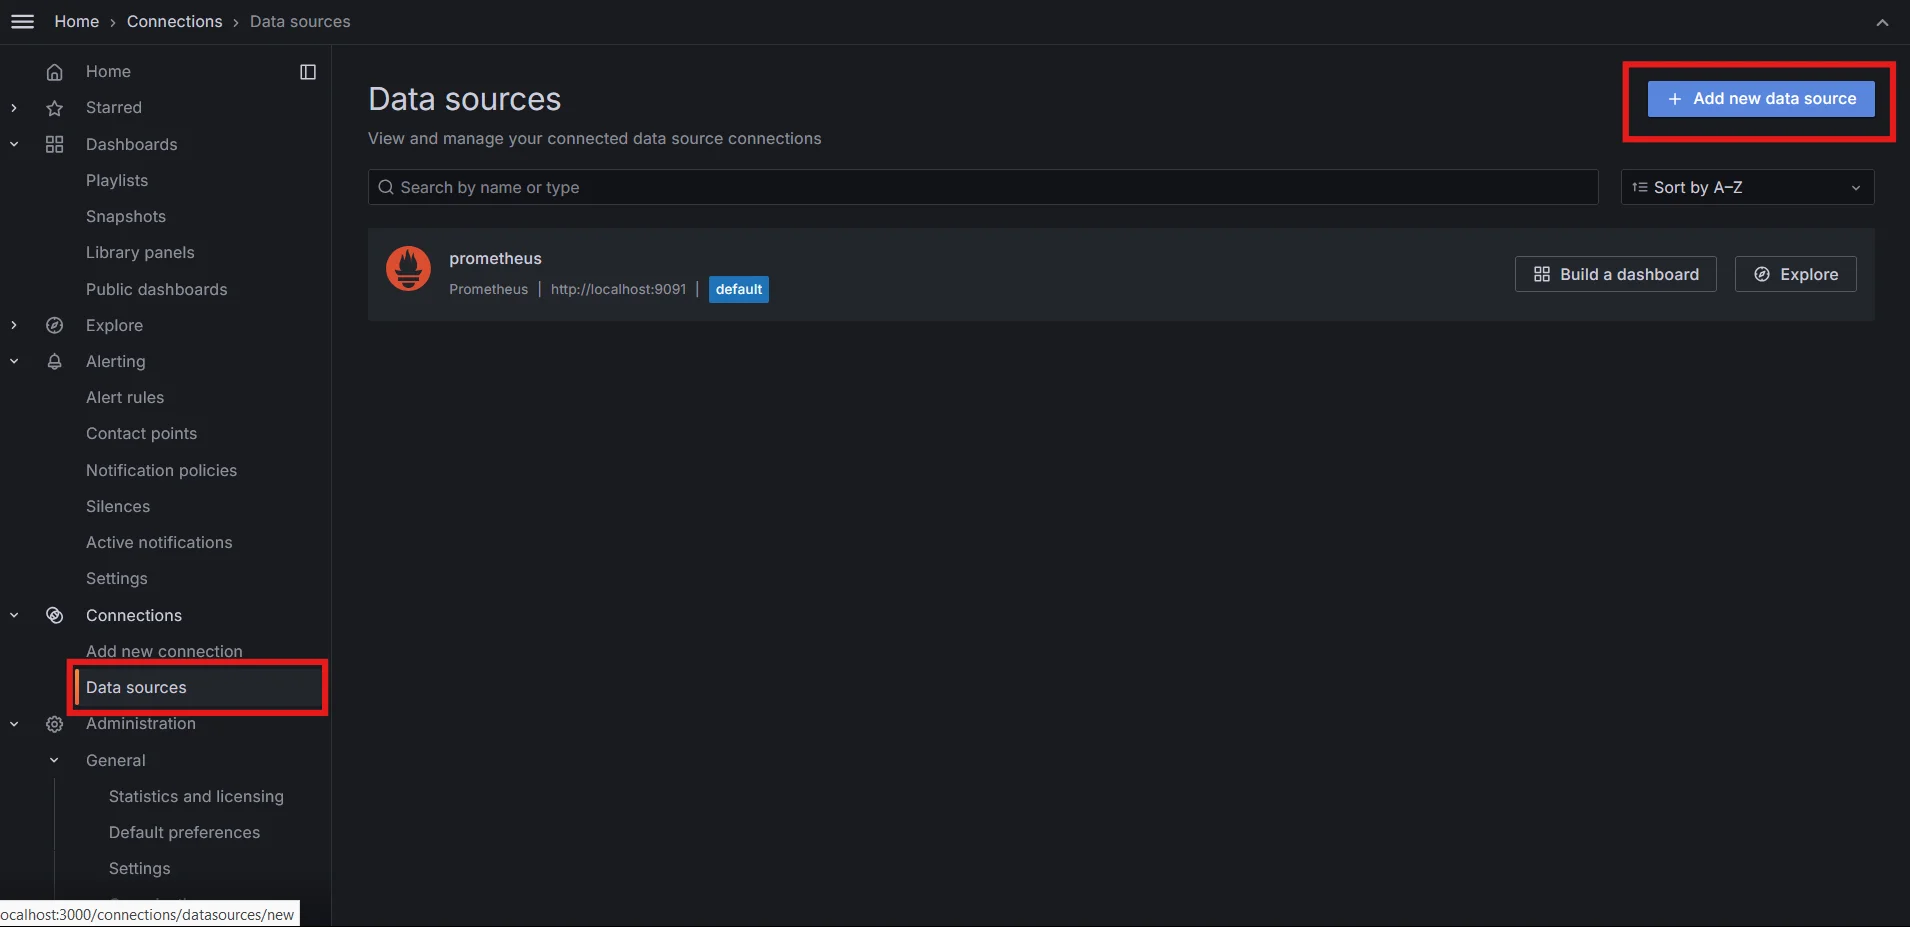
Data source in Grafana Click "Add data source" and select Loki
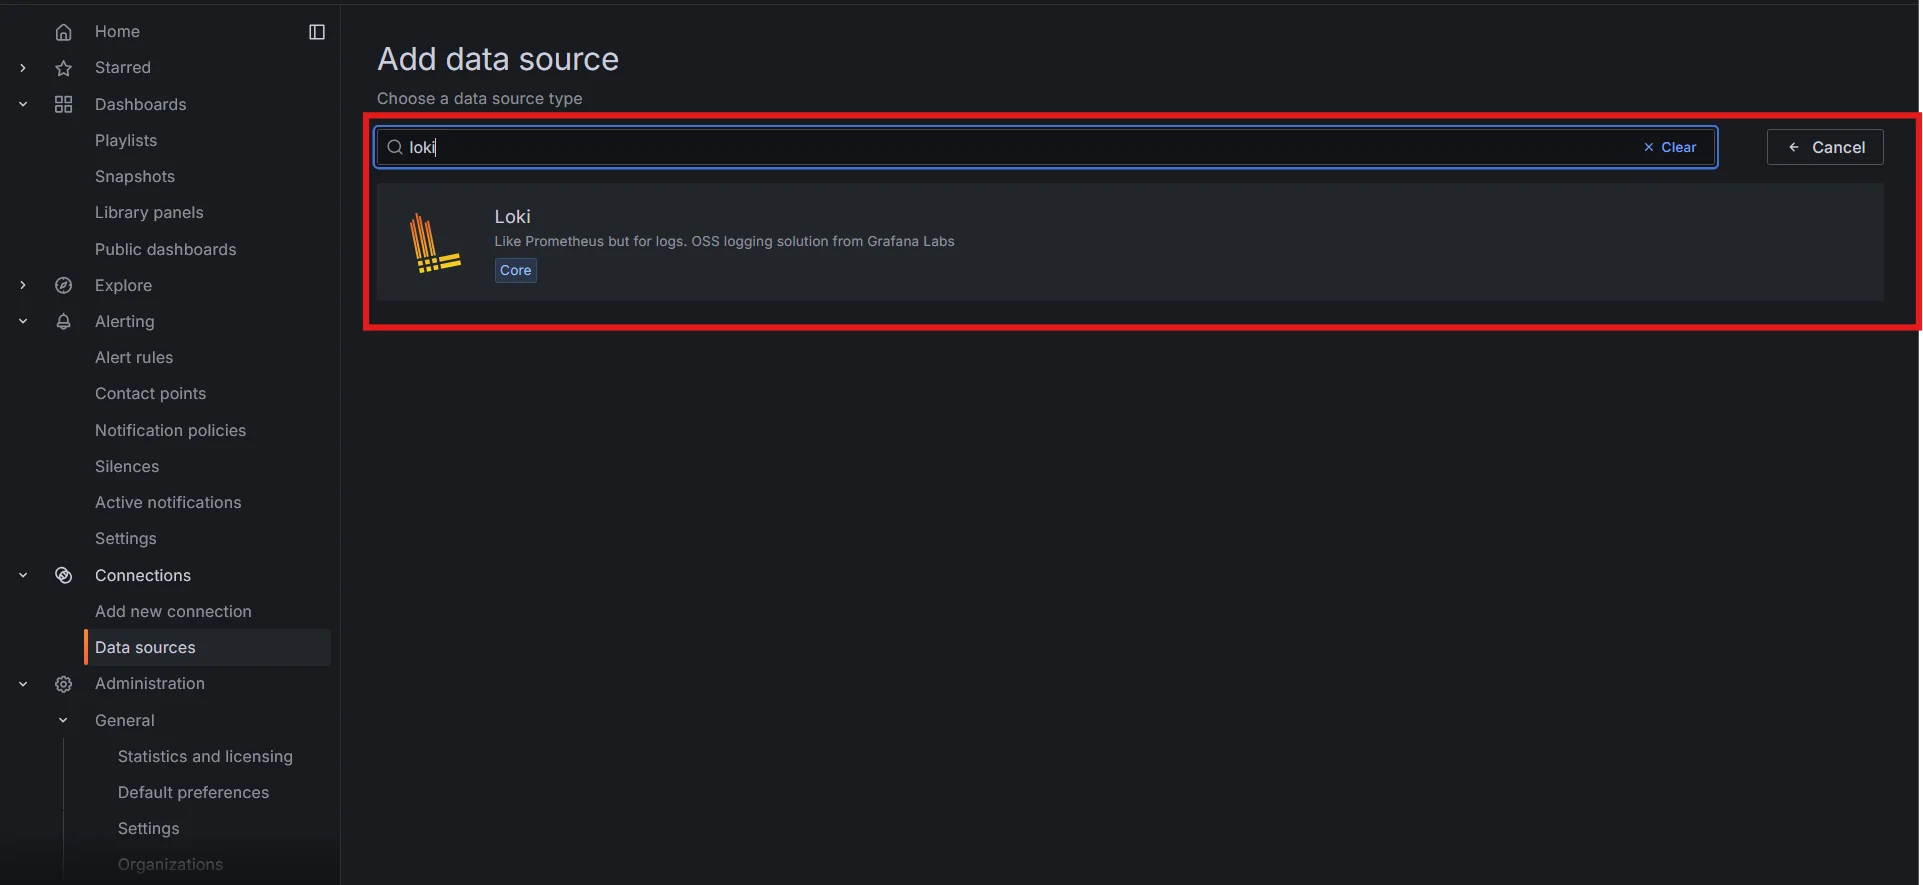
Adding Loki as data source in Grafana Enter the URL of your Loki instance and save the configuration
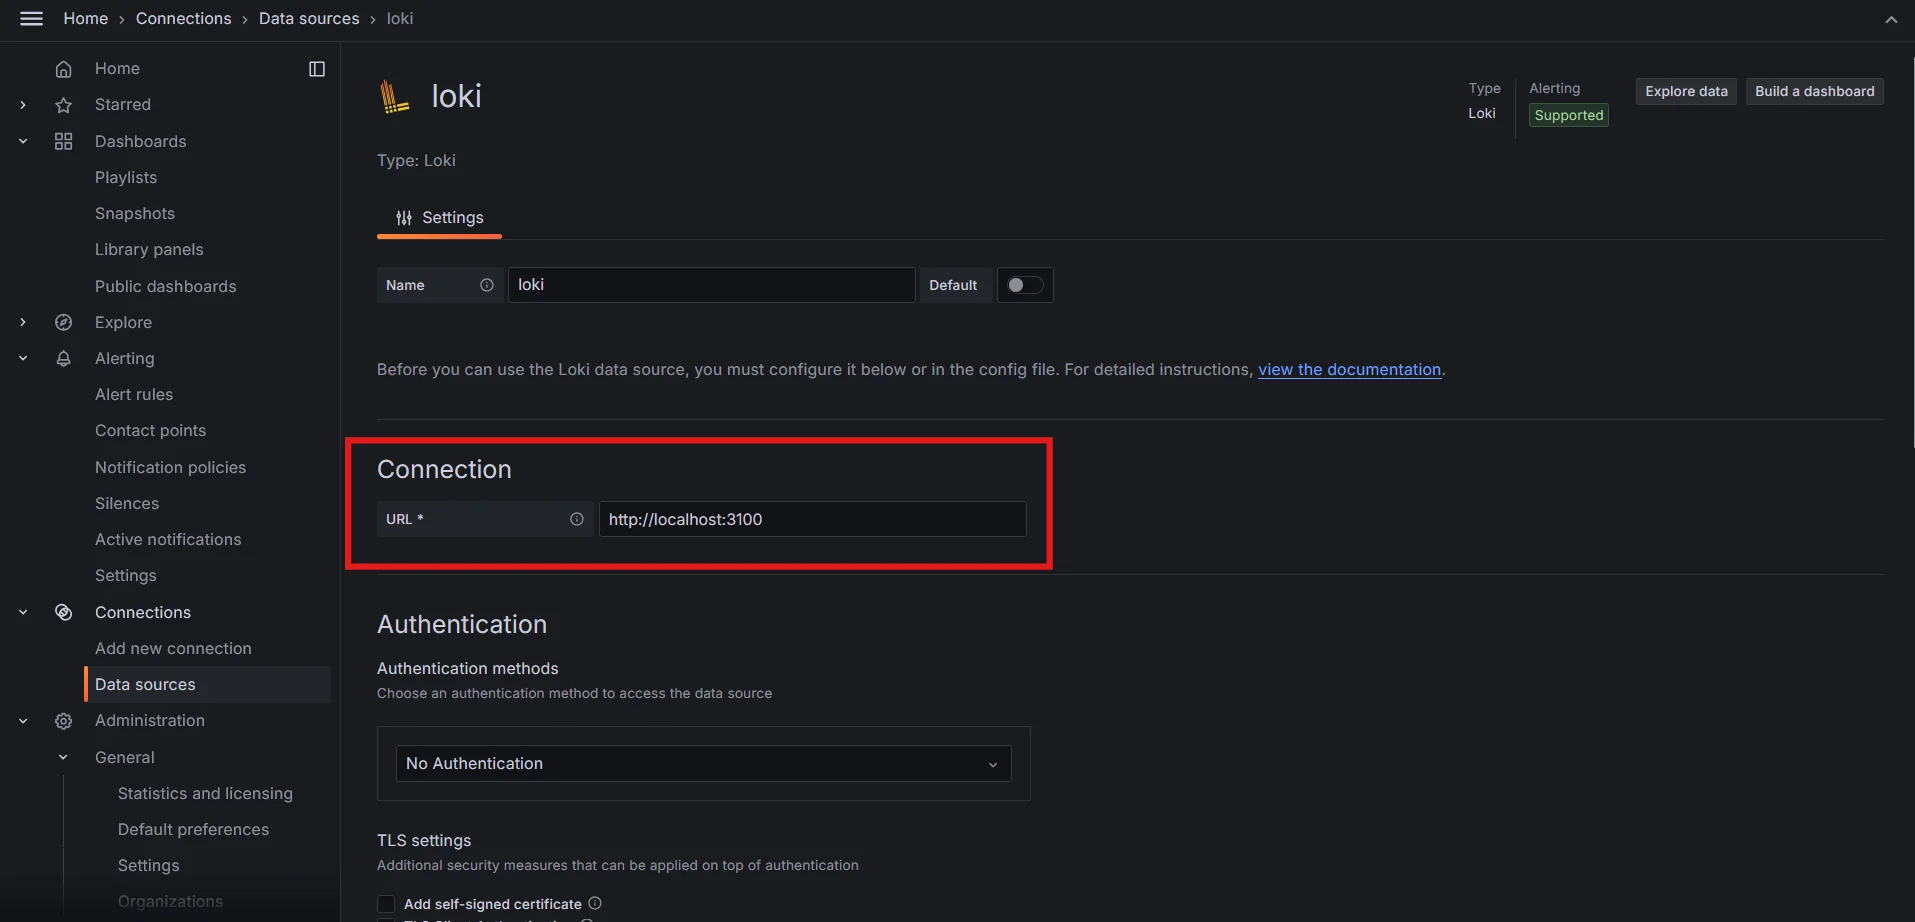
Specifying the Loki instance URL Save and test the data source
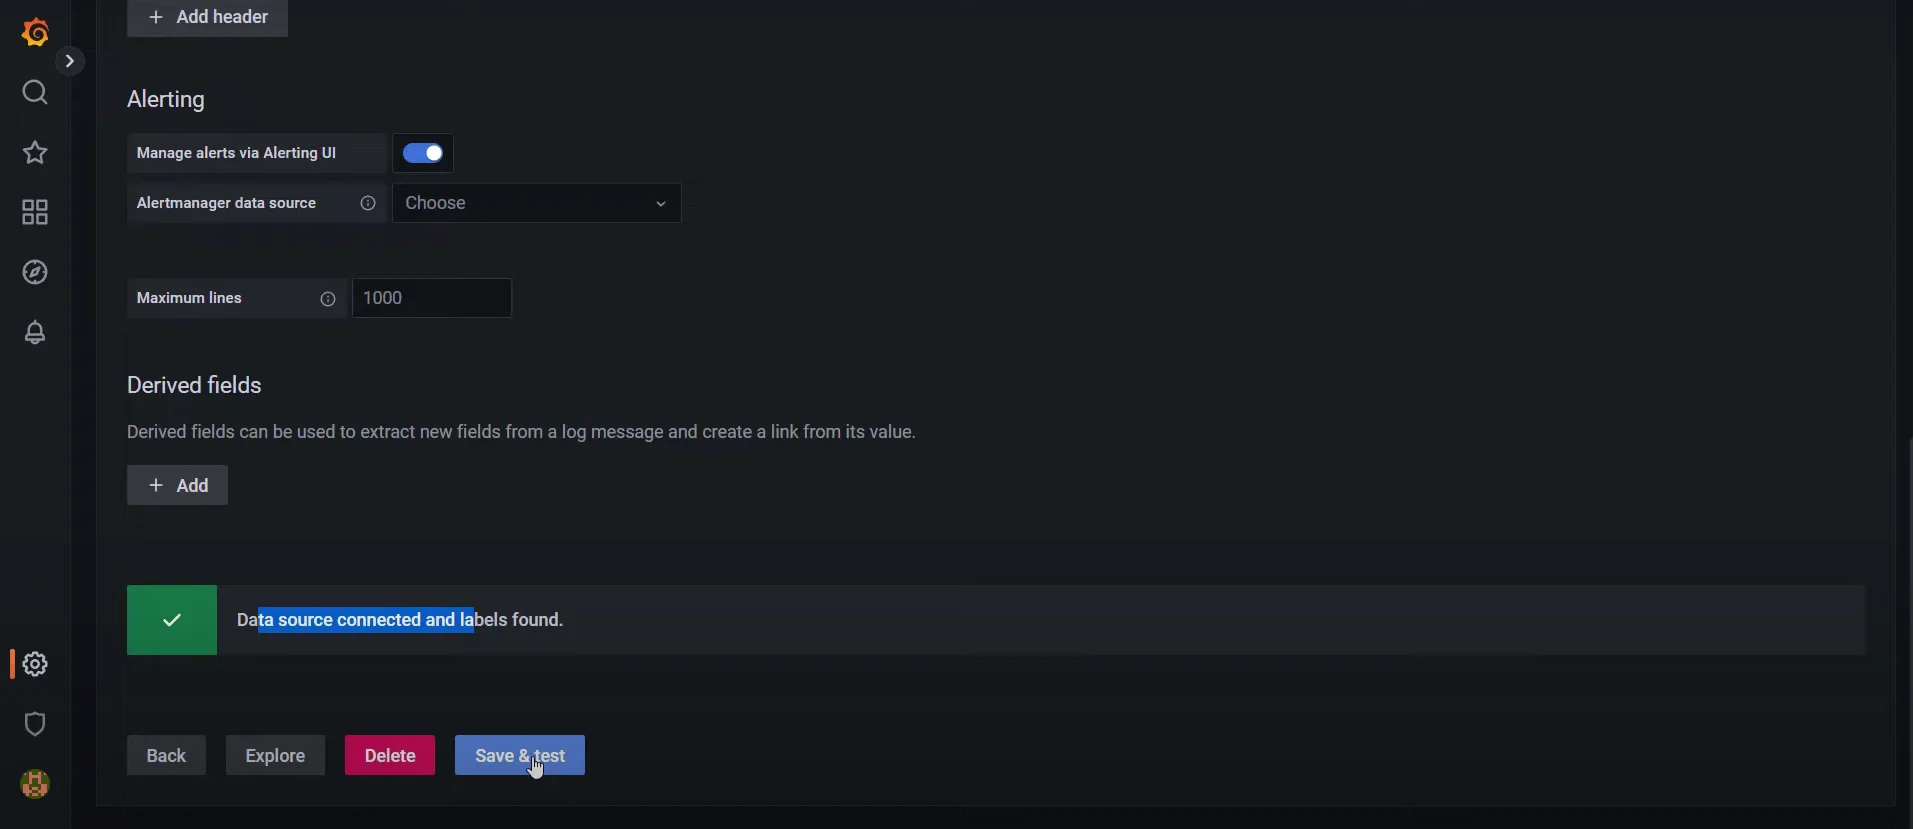
Testing Grafana Loki data source
Best practices for log ingestion and storage:
- Use meaningful labels to categorize your logs (e.g., application, environment, severity)
- Implement log retention policies to manage storage costs
- Consider using a chunk store like Amazon S3 or Google Cloud Storage for scalability
LogQL Basics for Counting Log Messages
LogQL, Loki's query language, is the key to effective log counting. Here's an introduction to its basic syntax and structure:
Log stream selectors: Log stream selectors specify which log streams you want to query. They are similar to label selectors in Prometheus. Here’s how they work:
{job="varlogs"}The query selects logs where the job label equals
varlogs.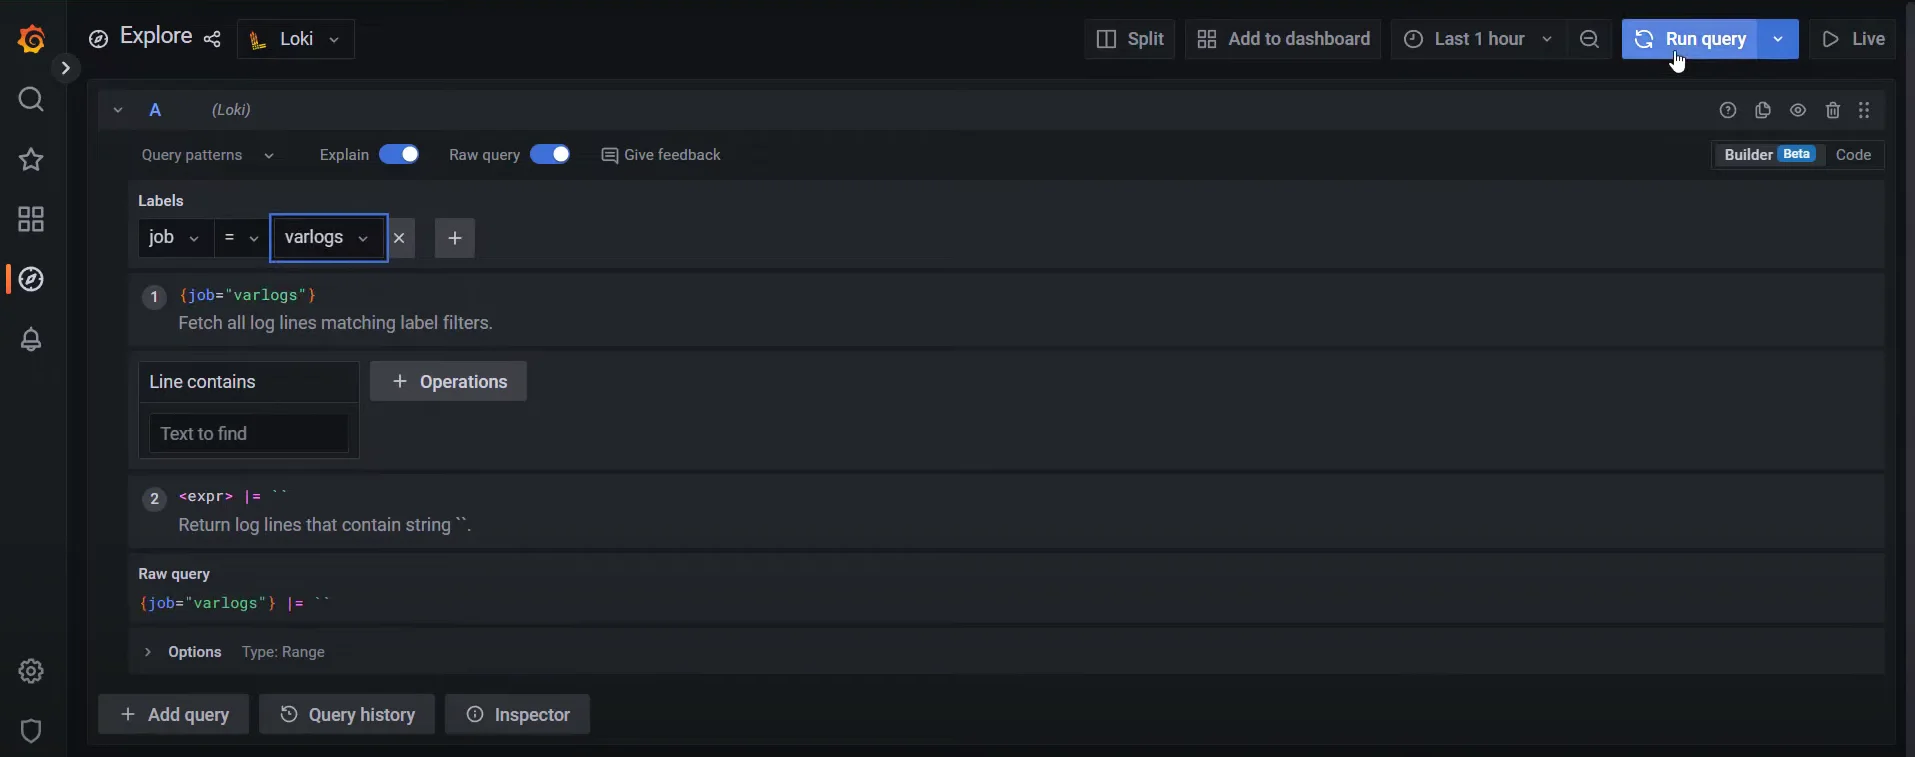
Log stream selectors Filters: Filters allow you to narrow down logs based on their content.
{job="varlogs"} |= "error"The query Filters logs to include only those containing the string error.
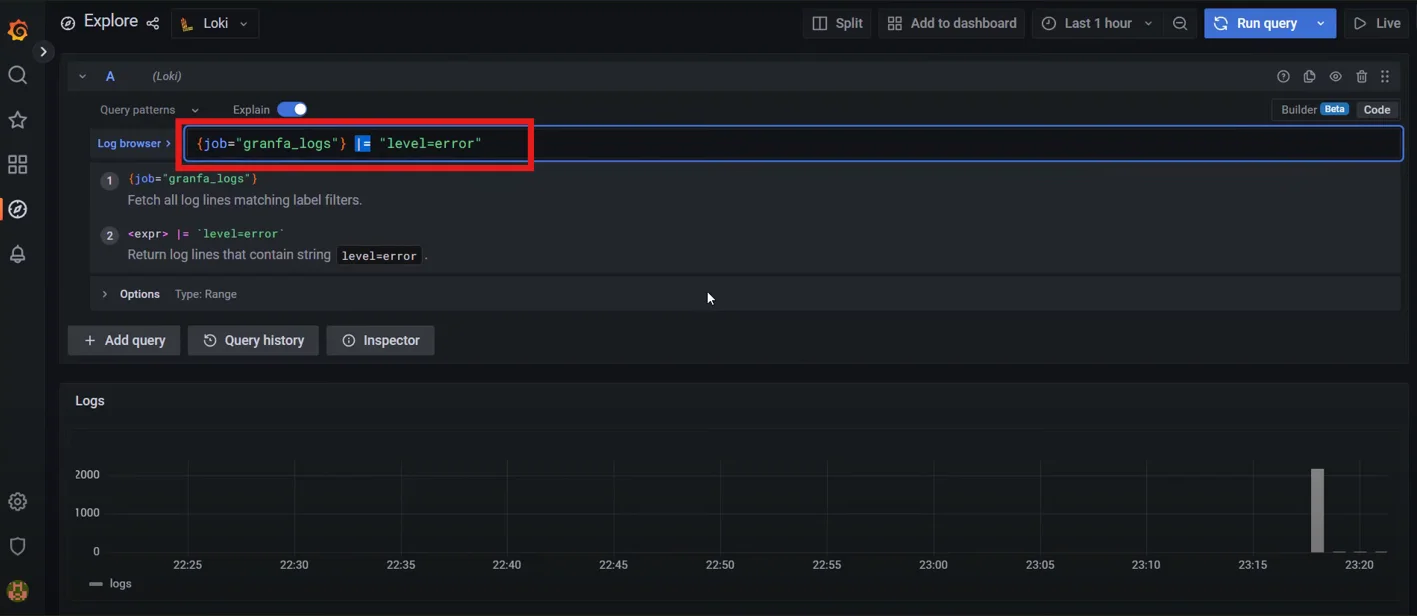
Filters in LogQL Aggregation functions: Use functions like
count_over_timeto aggregate log data:count_over_time({job="varlogs"}[1h])This query counts the entries in the
varlogsover the last hour.
Aggregate functions in LogQL
Advanced Techniques for Counting Specific Log Messages
To count specific log messages more effectively, you can employ these advanced techniques:
Regex patterns: Use regular expressions for flexible message matching:
count_over_time({app="myapp"} |~ "error.*timeout" [1h])
Regex patterns in LogQL Time-based aggregations: Group counts by time intervals:
sum by(minute) (count_over_time({app="myapp"} |= "error" [1m]))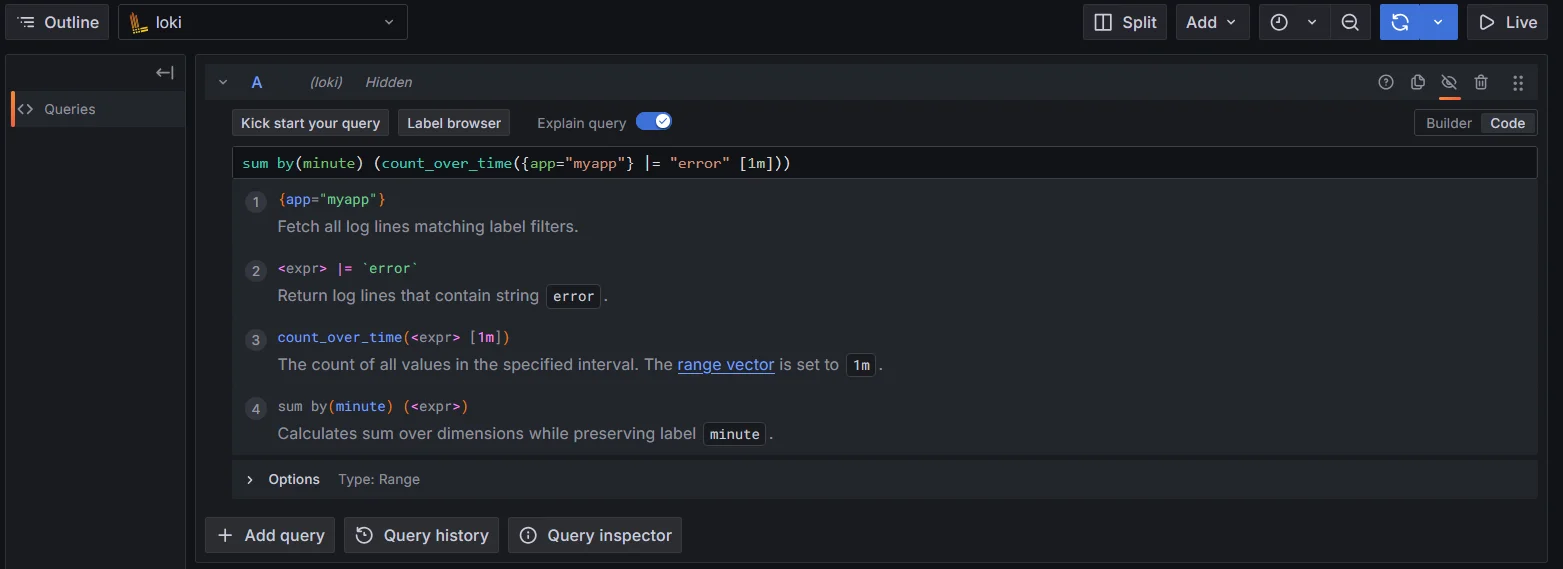
Time-based aggregations using Loki logQL Label matching: Leverage labels for precise counting:
sum by(status_code) (count_over_time({app="myapp", job="api"} [1h]))
Label matching in Loki LogQL Combining queries: Use logical operators to create complex scenarios:
sum(count_over_time({app="myapp"} |= "error" [1h])) or vector(0)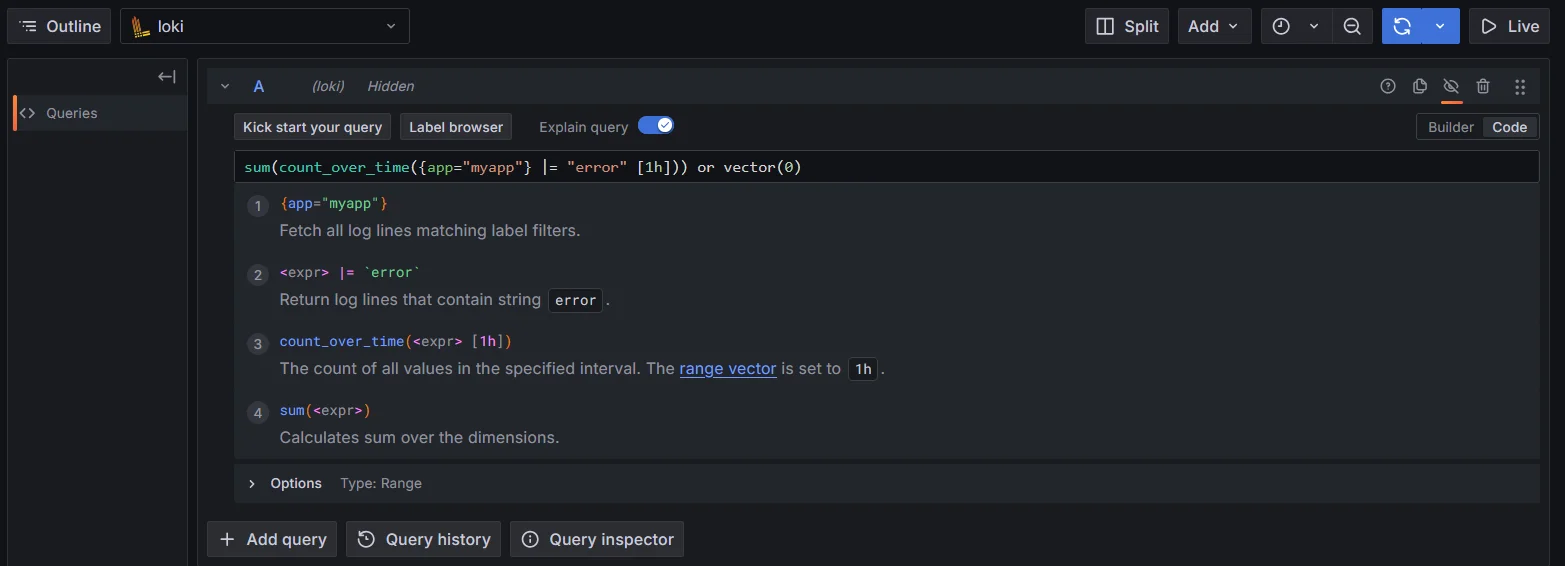
Combining queries in Loki LogQL
Creating Visualizations for Log Counts
Visualizing log counts effectively in Grafana allows you to gain insights into log data, identify trends, and monitor system performance. Here’s how you can leverage Grafana panels to create meaningful visualizations for log counts:
Using Grafana Panels to Display Log Count Metrics
Add a New Panel: Start by creating a Grafana dashboard and specifying
Lokias the data source.Query Configuration: Use Loki queries to fetch log counts. Adjust the query according to your log labels and desired time range. Update the query section.
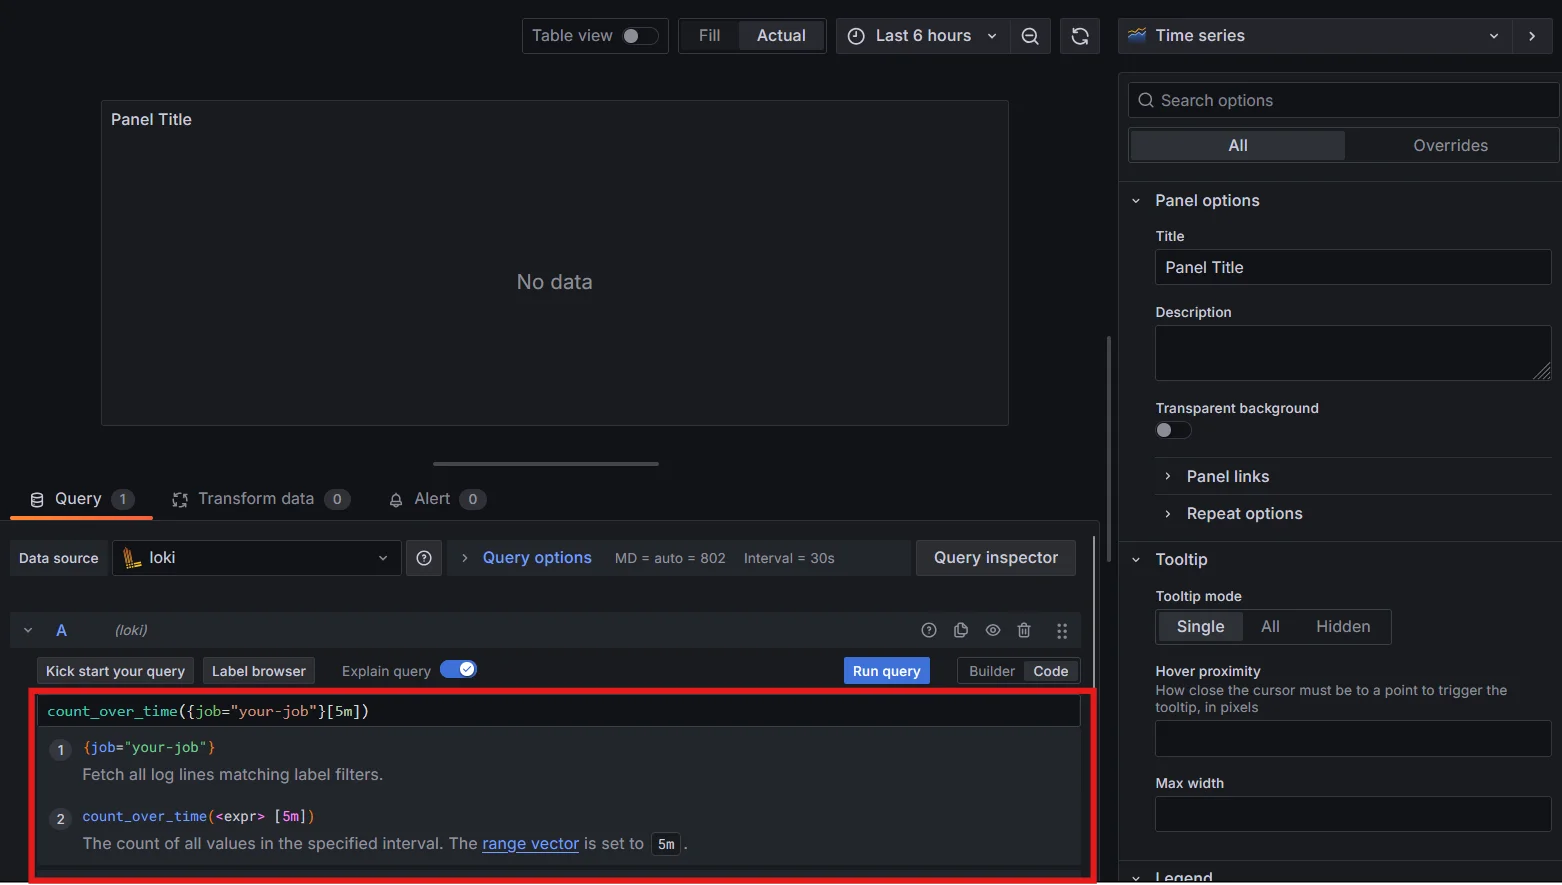
Query Configuration in Grafana Dashboard Choose Visualization Type: Select the appropriate visualization type from the panel options. For log counts, the "Time series" and "Stat" panels are commonly used.
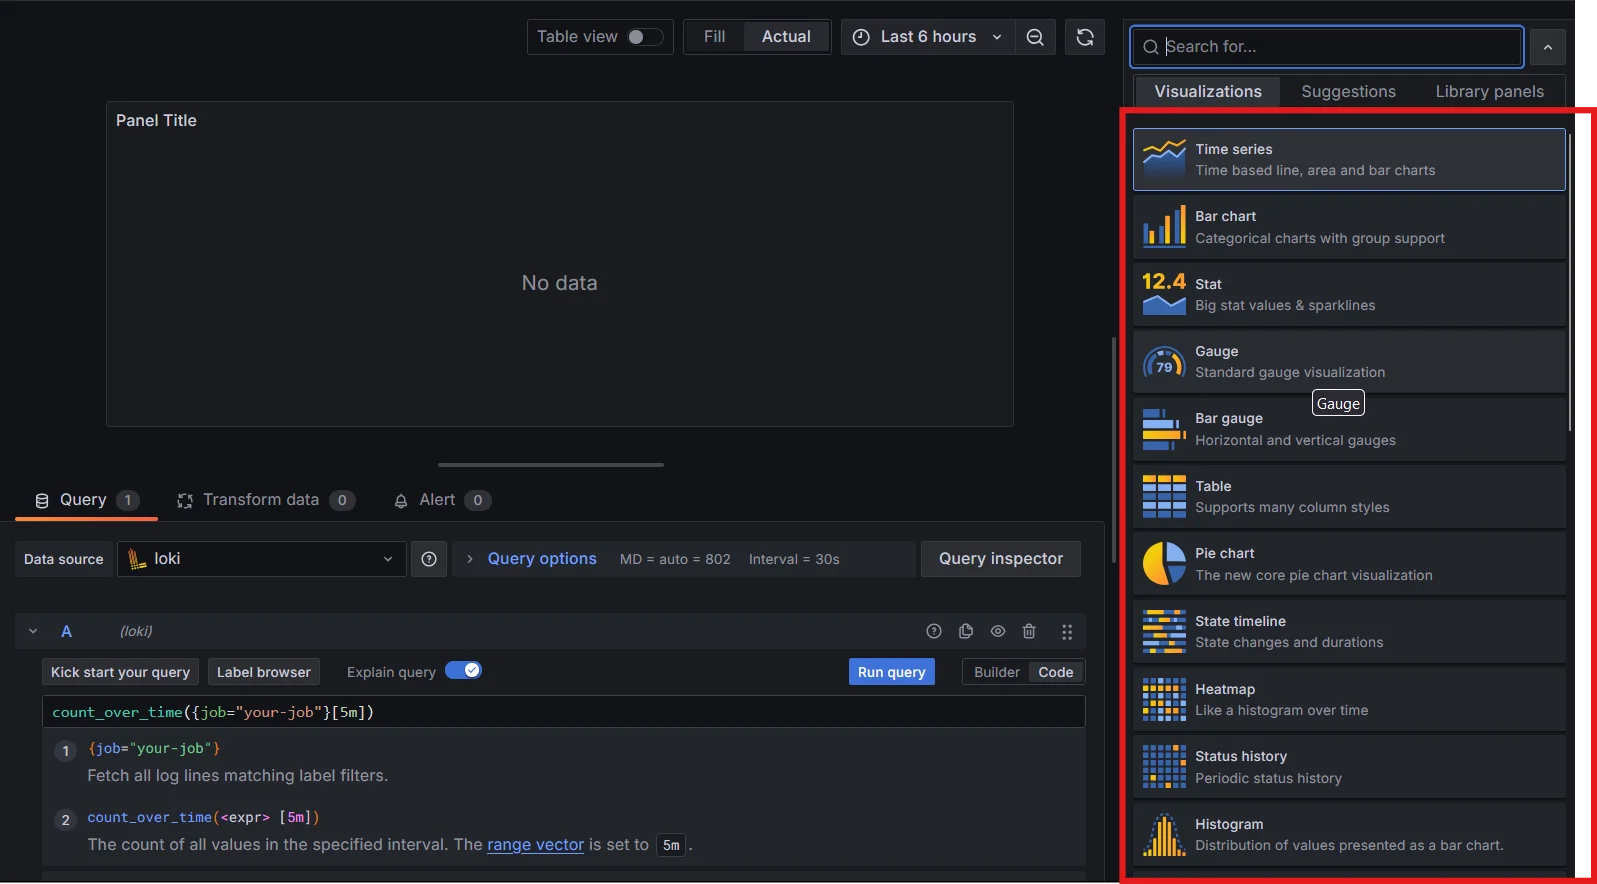
Choosing Visualization Type in Grafana Dashboard - For a quick overview of current log counts, use the "Gauge" or "Stat" panels. These are ideal for displaying single, summary metrics.
- Choose the "Time series" visualization to visualize log counts over time and detect trends.
Optimizing Log Counting Queries
To ensure efficient log counting, consider these optimization tips:
- Limit time ranges: Use shorter time ranges when possible to reduce data processed.
- Utilize caching: Enable query caching in Loki to improve performance for repeated queries.
- Implement efficient label strategies: Use labels judiciously to balance query flexibility and performance.
- Use efficient regex patterns: Avoid overly complex regular expressions that may slow down queries.
Automating Log Count Alerts
Set up automated alerts based on log counts to proactively monitor your systems:
Create an alert rule in Grafana:
- Navigate to Alerting > Alert rules
- Define a query that counts specific log messages
- Set appropriate thresholds and evaluation intervals
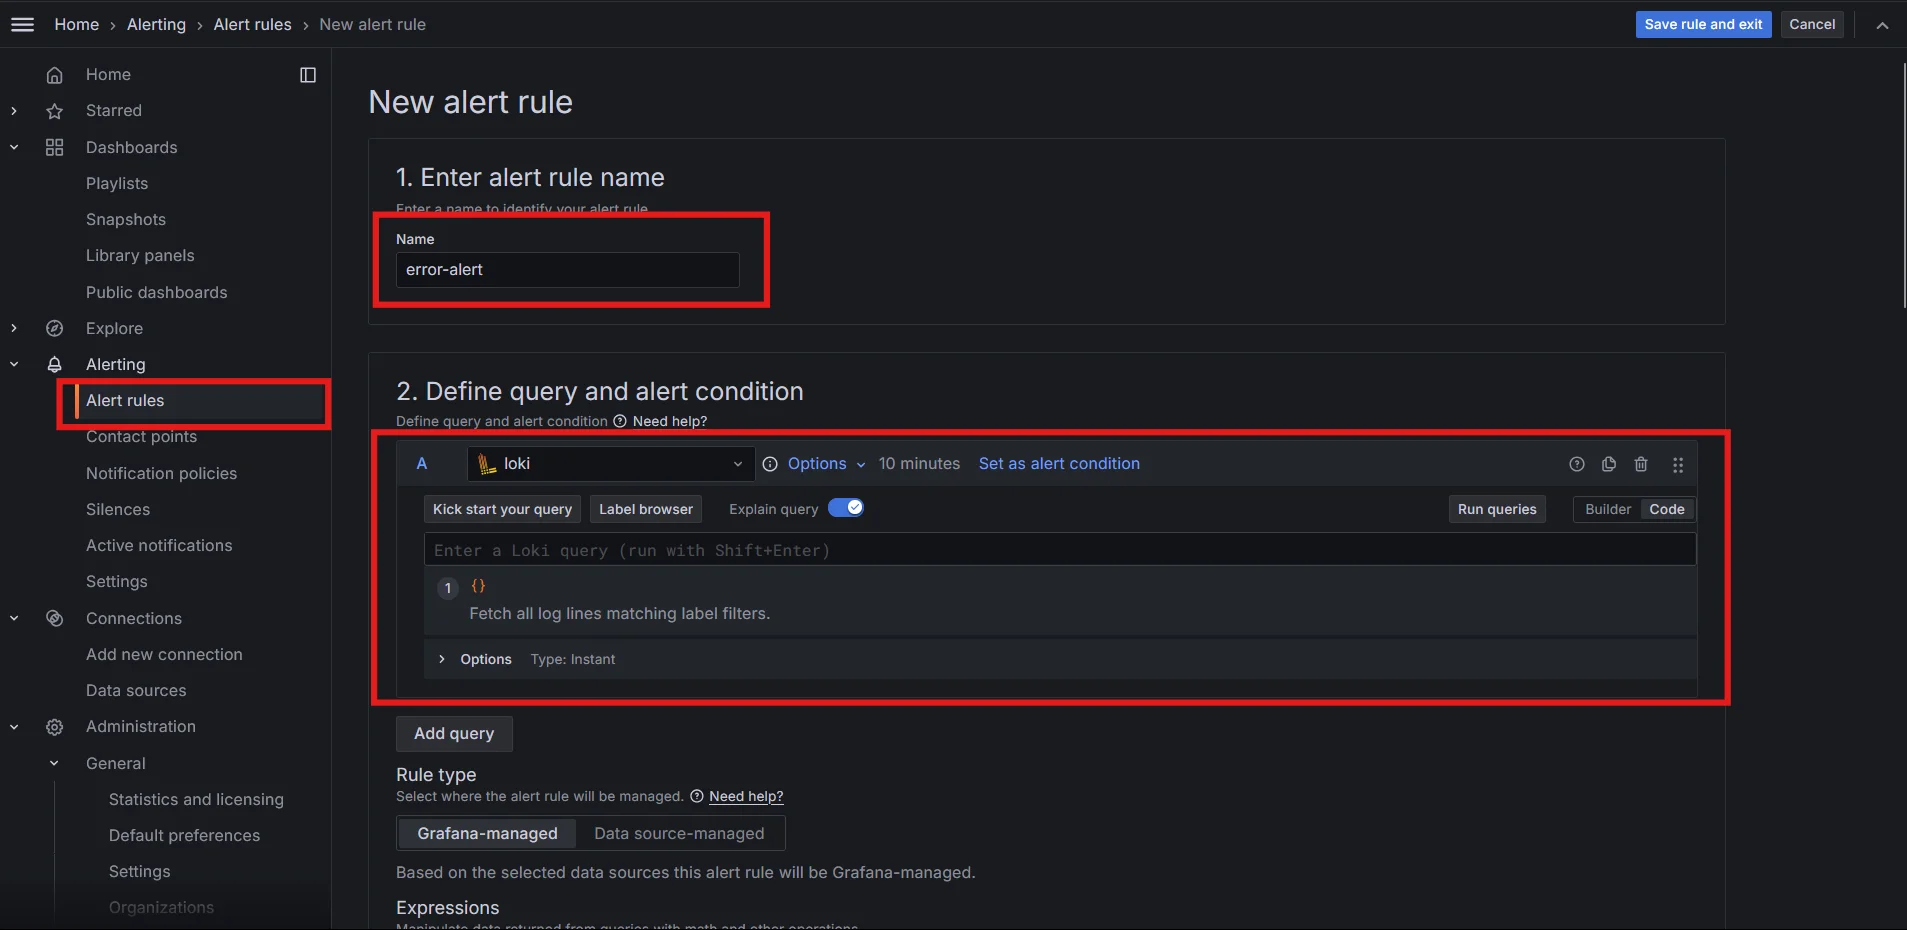
Creating alerts in Grafana Dashboard Configure notification channels: Set up email, Slack, or other integrations to receive alerts
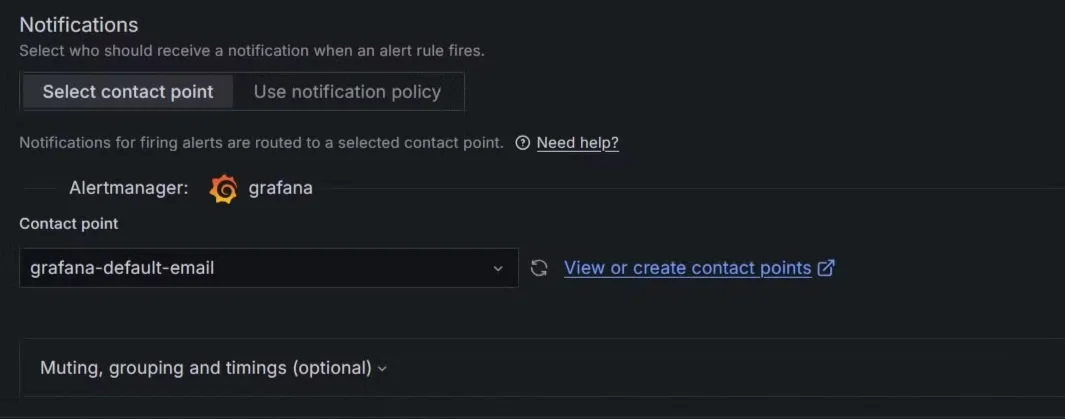
Configuring notification channels for alert in Grafana dashboard
Best practices for alert management:
- Group related alerts to reduce noise
- Implement escalation policies for critical issues
- Regularly review and refine alert rules to minimize false positives
Limitations of Loki in Log Counting
While Grafana Loki is an effective tool for log aggregation and querying, it has some limitations when it comes to advanced log analysis and scaling. For instance:
- Lack of Built-in Visualization: Loki relies on Grafana for visualizations, which means setting up dashboards and panels requires more effort and is somewhat fragmented.
- Limited Query Flexibility: Loki’s query language, LogQL, while powerful, can be restrictive when performing advanced analysis or combining logs with other observability data like traces and metrics.
- Scalability Concerns: In high-traffic environments with large-scale log volumes, Loki may struggle to maintain performance without significant tuning, leading to slower queries and increased resource usage.
- Limited Contextual Insights: Since Loki focuses primarily on log aggregation, it doesn't provide native integration with distributed tracing or metrics, making it harder to correlate logs with traces and metrics in complex, microservices-based systems.
Leveraging SigNoz for Enhanced Log Analysis
SigNoz solves many of these issues by offering a unified observability platform that seamlessly integrates logs, metrics, and traces in a single interface. It eliminates the need for multiple tools and provides a cohesive way to monitor, troubleshoot, and analyze logs alongside other observability data. Here’s how SigNoz helps:
Unified Platform: SigNoz combines logs, metrics, and traces in one place, offering better context and more holistic analysis. You can view logs, correlate them with traces, and analyze system performance without switching between tools.

SigNoz combines logs, metrics, and traces in one place. Built-In Visualizations: Unlike Loki, SigNoz offers native visualization capabilities for logs, metrics, and traces. This eliminates the need to use external tools like Grafana and simplifies the process of creating dashboards and reports.
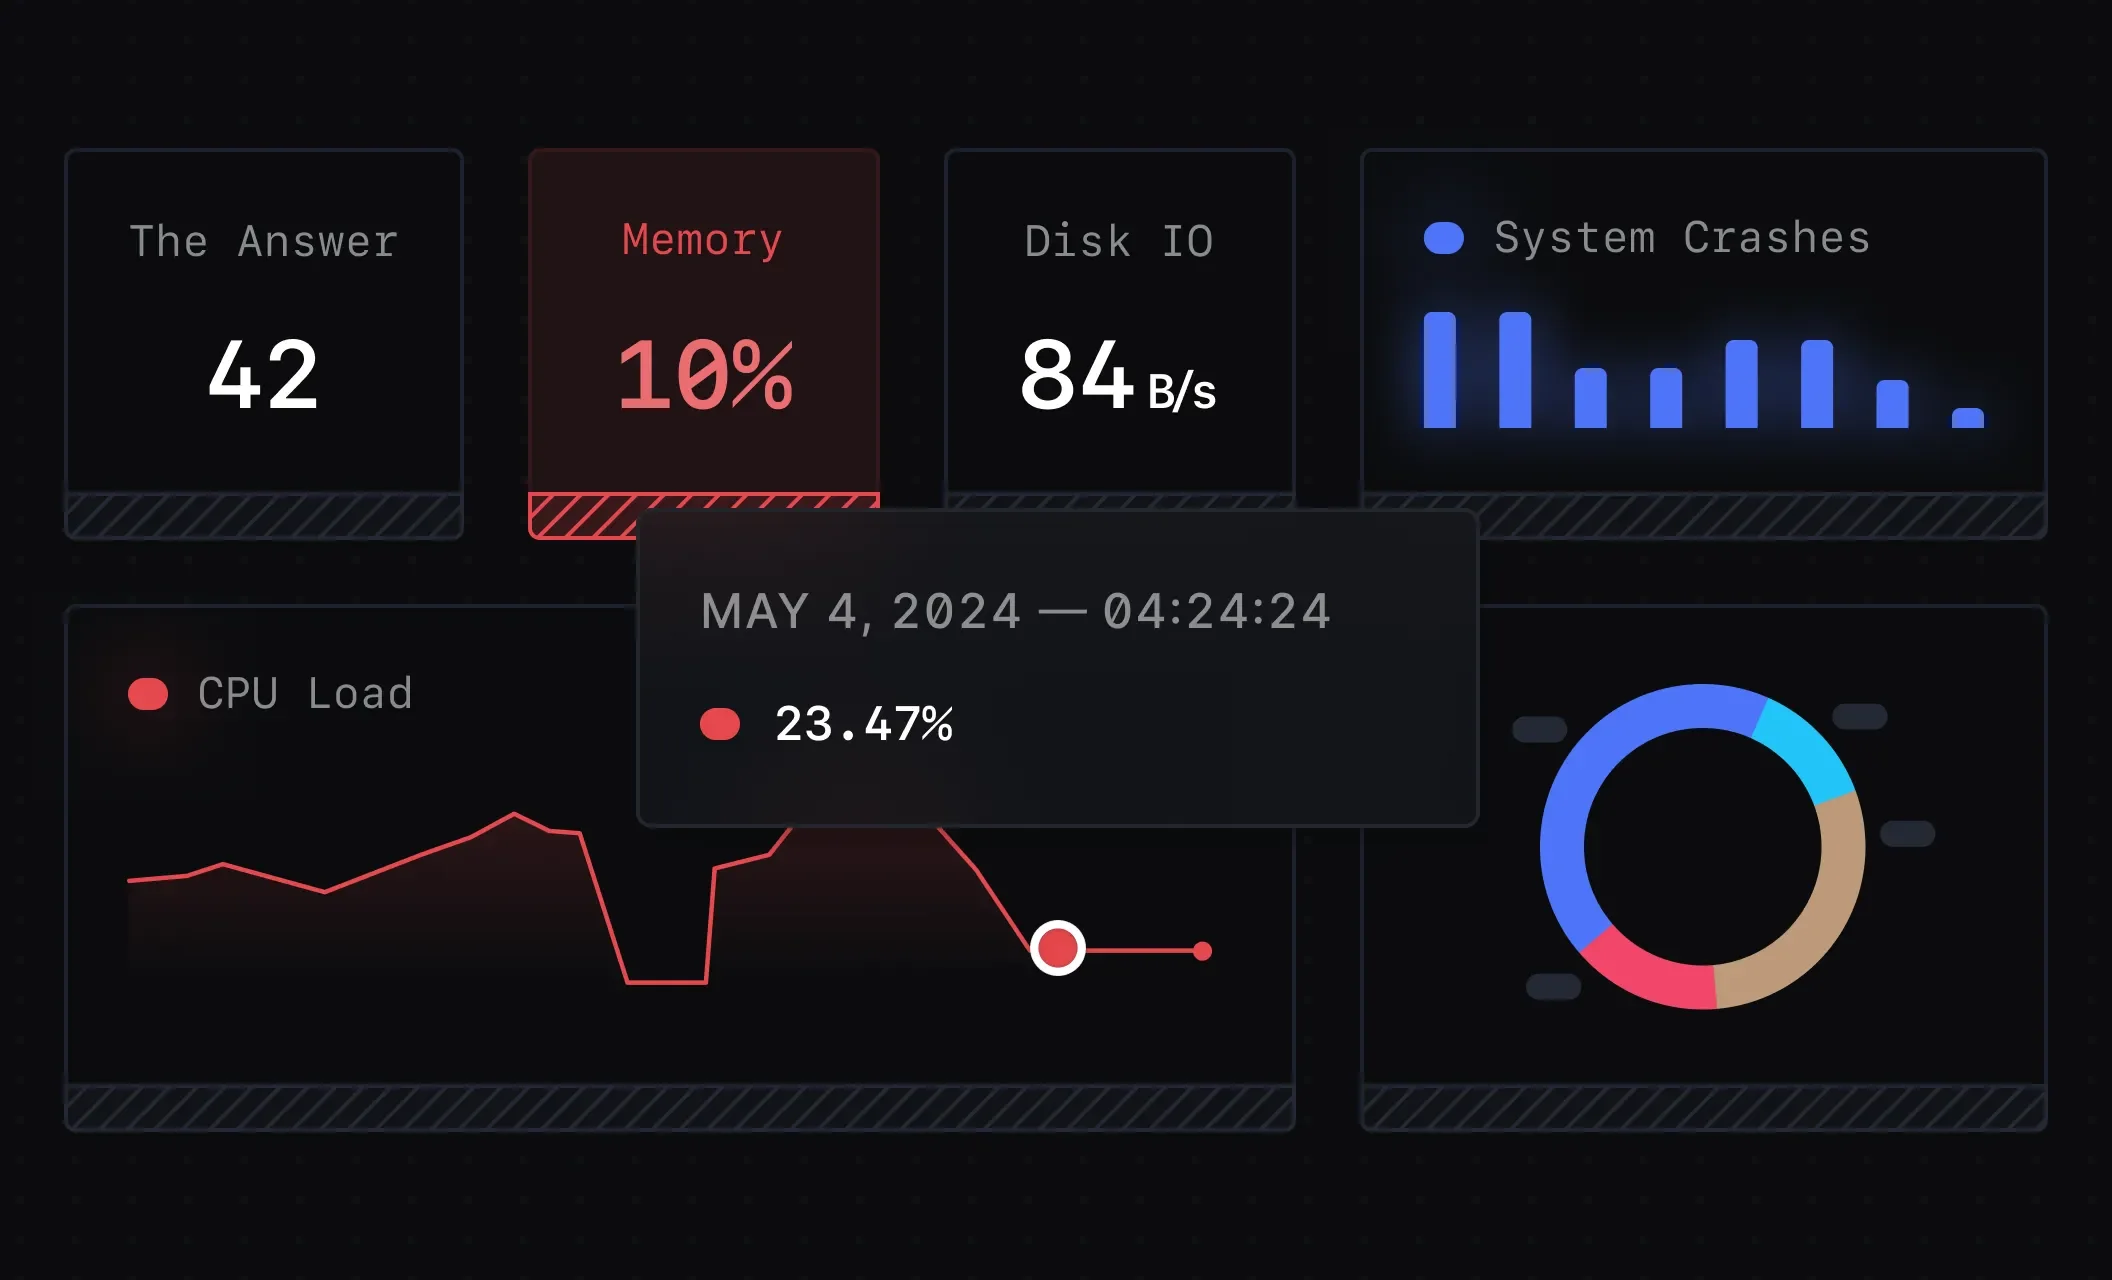
SigNoz offers native visualization capabilities for logs, metrics, and traces. Advanced Log Querying: SigNoz leverages OpenTelemetry, providing more powerful and flexible querying capabilities. Its query system allows deeper log analysis, including correlating logs with metrics and traces for root cause analysis.
Scalability: SigNoz is designed to handle high log volumes with better resource management, ensuring smoother performance even in large-scale environments. It also supports distributed setups for improved scalability.
SigNoz Cloud is the easiest way to run SigNoz. Sign up for a free account and get 30 days of unlimited access to all features.
You can also install and self-host SigNoz yourself since it is open-source. With 24,000+ GitHub stars, open-source SigNoz is loved by developers. Find the instructions to self-host SigNoz.
Key Takeaways
- Grafana Loki offers powerful tools for counting specific log messages, enabling you to gain valuable insights from your log data.
- LogQL is essential for crafting effective log-counting queries, providing flexibility in filtering and aggregating log data.
- Proper setup, optimization, and visualization techniques are crucial for efficient log analysis and deriving actionable insights.
- While Grafana Loki excels in log management, platforms like SigNoz provide comprehensive observability solutions that enhance your overall monitoring capabilities.
FAQs
What's the difference between Grafana Loki and traditional log management tools?
Grafana Loki uses a unique indexing approach that focuses on metadata rather than full-text indexing. This makes Loki more cost-effective and faster for large-scale log management compared to traditional tools. However, it may have limitations in full-text search capabilities.
Can Grafana Loki handle high-volume log ingestion for real-time counting?
Yes, Grafana Loki is designed to handle high-volume log ingestion. Its distributed architecture allows for horizontal scaling to accommodate increasing log volumes. However, real-time counting performance depends on factors such as query complexity and data volume.
How does log message counting impact system performance?
Log message counting typically has minimal impact on system performance when done efficiently. Loki's design optimizes for fast queries on recent data. However, complex queries over large time ranges may require more resources and potentially affect query performance.
Are there any limitations to counting specific log messages in Grafana Loki?
While Grafana Loki is powerful, it has some limitations:
- Complex regex queries may be slower compared to exact match filters
- Aggregations over very large datasets or long time ranges may require significant resources
- Loki prioritizes recent data, so queries on older logs might be slower
To overcome these limitations, optimize your queries, use efficient labeling strategies, and consider using SigNoz for more advanced log analysis capabilities.
