How to Sort Legends by Series Name in Prometheus and Grafana
In the world of data analysis, getting quick, clear insights is key. When your graphs are cluttered with disorganized legends, spotting trends or comparing time series becomes a headache. This guide will walk you through sorting legends in Prometheus and Grafana, improving your data visualization workflow. We’ll cover everything from built-in options to advanced PromQL techniques.
Understanding Legends in Prometheus and Grafana
Legends in data visualization serve as keys to interpreting the information displayed in graphs or charts. In the context of Prometheus and Grafana, legends are essential for decoding time series data. They provide context to the plotted lines, helping you distinguish between different metrics or dimensions of your data.
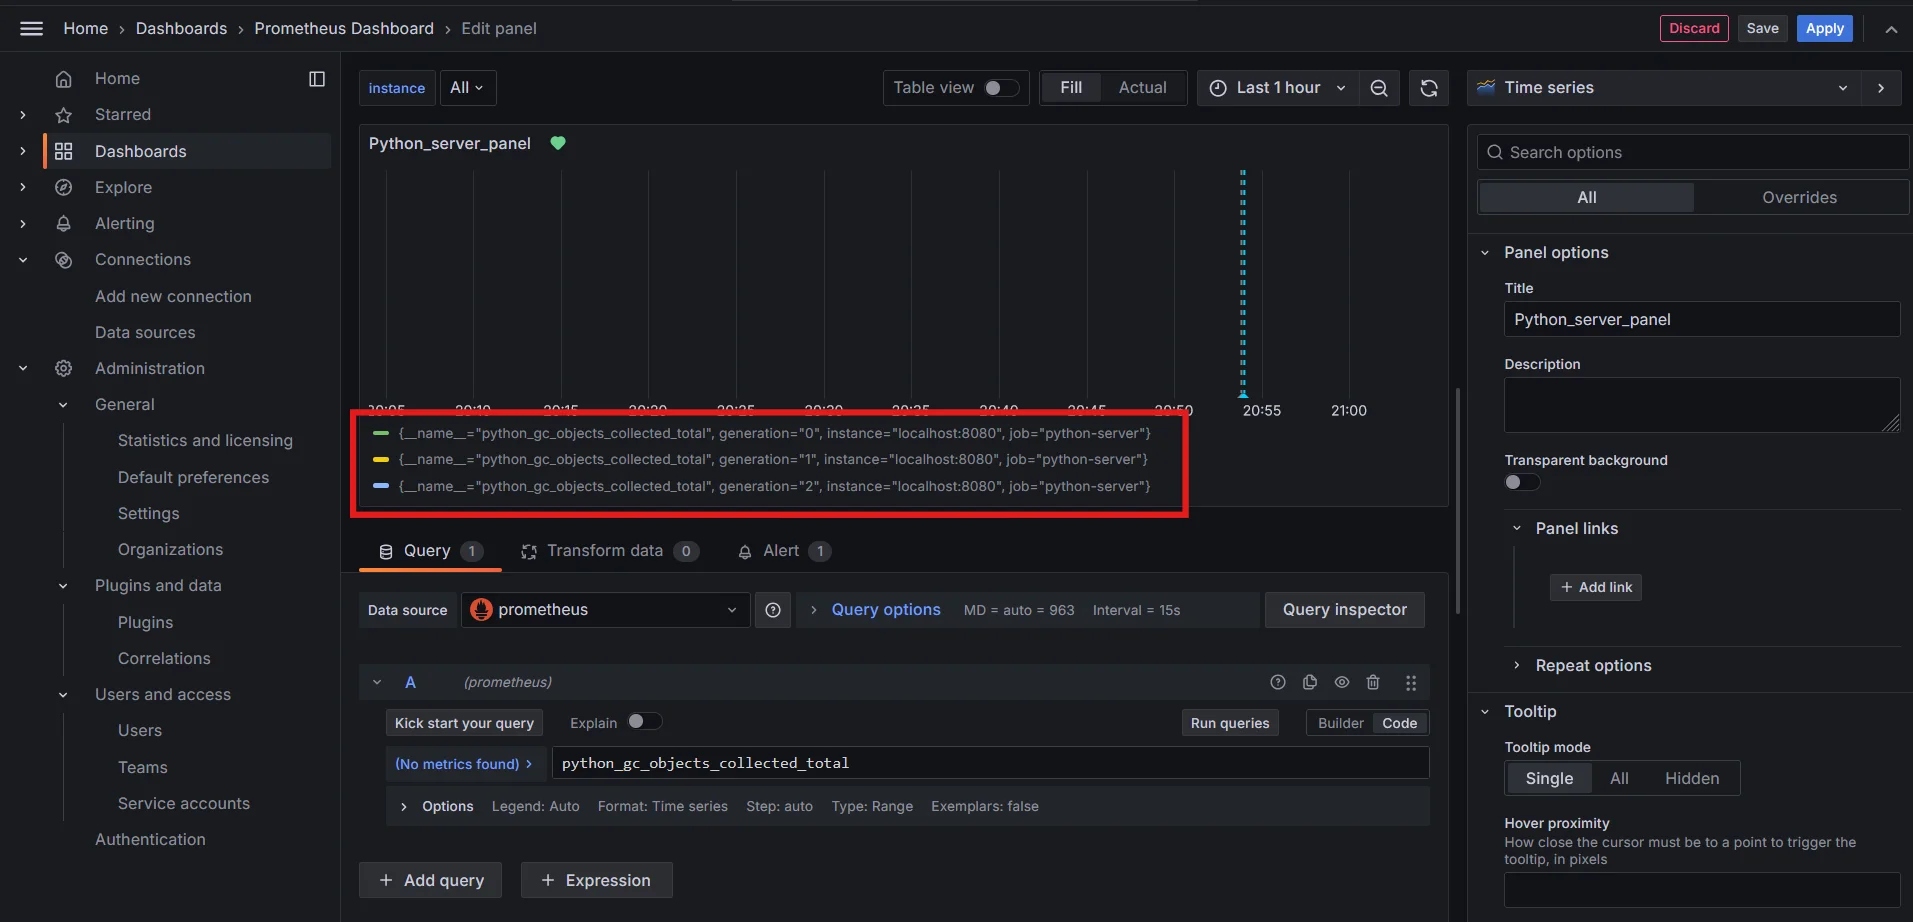
Prometheus generates legends based on the metric names and labels associated with the data it collects. When visualized in Grafana, these legends become critical for interpreting complex, multi-dimensional datasets. A well-organized legend can significantly enhance your ability to analyze trends, spot anomalies, and draw insights from your time series data.
Having understood legends, next thing which comes into mind is series name.
What is Series Name ?
In the context of Prometheus and Grafana, a series name refers to the unique identifier for a specific set of time series data.
It typically includes the metric name and a combination of its associated labels. Here's a breakdown:
Components of a Series Name
Metric Name: This is the primary identifier for the metric being tracked. For example,
http_requests_totalis a metric name that counts the total number of HTTP requests.Labels: Labels are key-value pairs that provide additional context for the metric. They help differentiate between different instances of the same metric.
For instance, a series might look like:
http_requests_total{method="GET", status="200"}In this example:
http_requests_totalis the metric namemethod="GET"andstatus="200"are labels
Example
If you have multiple labels for HTTP requests, the series names could look like:
http_requests_total{method="GET", status="200"}http_requests_total{method="POST", status="404"}http_requests_total{method="GET", status="500"}
Each of these series represents a different combination of labels for the same metric, allowing you to analyze performance, error rates, and other dimensions of your application’s behavior.
Importance of Series Names
- Data Organization: Series names help organize and categorize your data in Grafana.
- Visualization: They are used in legends to help users identify which data series is represented in visualizations.
- Filtering and Querying: You can filter and aggregate data based on series names and labels in Prometheus queries.
Why Sorting Legends is Crucial for Data Analysis
The ability to sort legends by series name is more than just a cosmetic preference — it's a powerful tool for effective data analysis. Here's why it matters:
- Improved readability: Sorted legends make it easier to locate specific series, especially in graphs with numerous metrics.
- Easier comparison: When series are sorted, comparing related metrics that might be alphabetically adjacent becomes simpler.
- Pattern recognition: Sorted legends can reveal patterns or groupings in your data that might not be immediately apparent otherwise.
- Time-saving: For analysts and developers working with large datasets, sorted legends can significantly reduce the time spent searching for specific metrics.
- Multi-dimensional data: When dealing with high-cardinality data or multiple dimensions, sorting becomes more complex and can impact performance.
Methods to Sort Legends by Series Name in Grafana
There are several methods to sort legends by series name in Grafana:
1. Using Grafana's Built-in Sorting Options
Grafana 7 and later versions offer built-in options for legend sorting:
In the Grafana Dashboard go to
Dashboardssection and select the dashboard for which you want to edit the panel.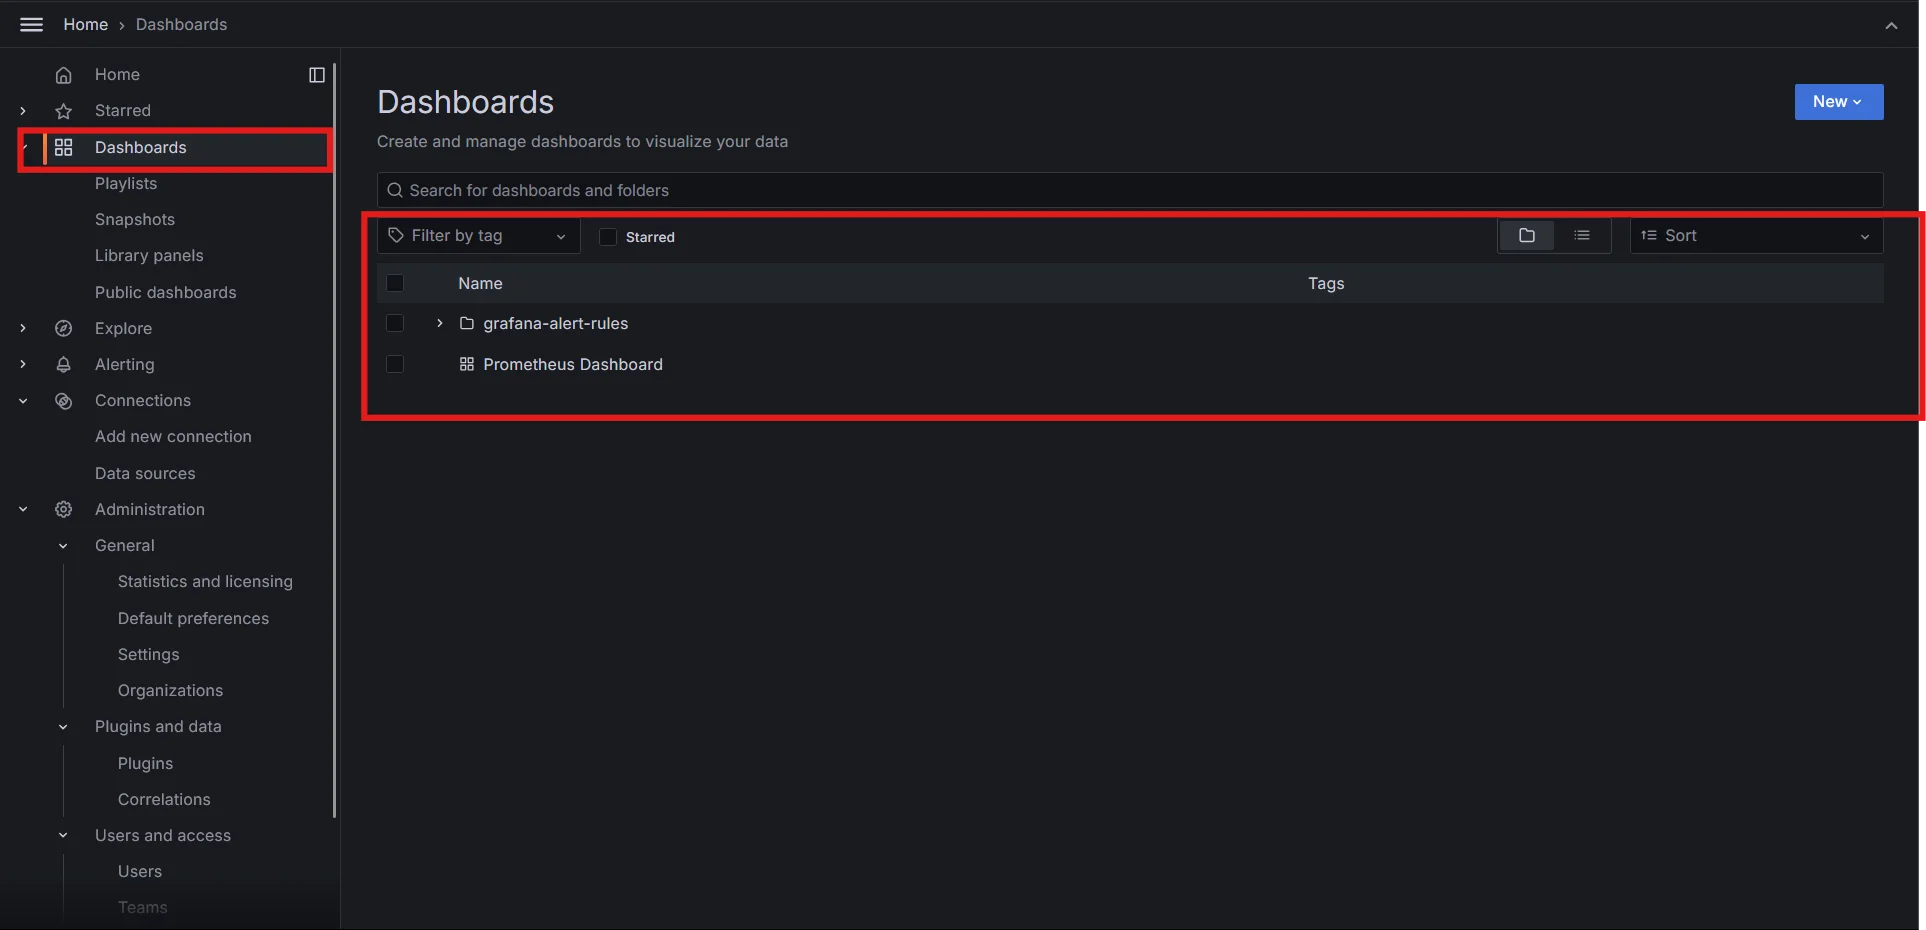
Selecting dashboards in Grafana Select the panel you want to work with within the dashboard and click the
Editoption.
Selecting Panel in Grafana Dashboard Navigate to the "Legend" tab in the panel settings.
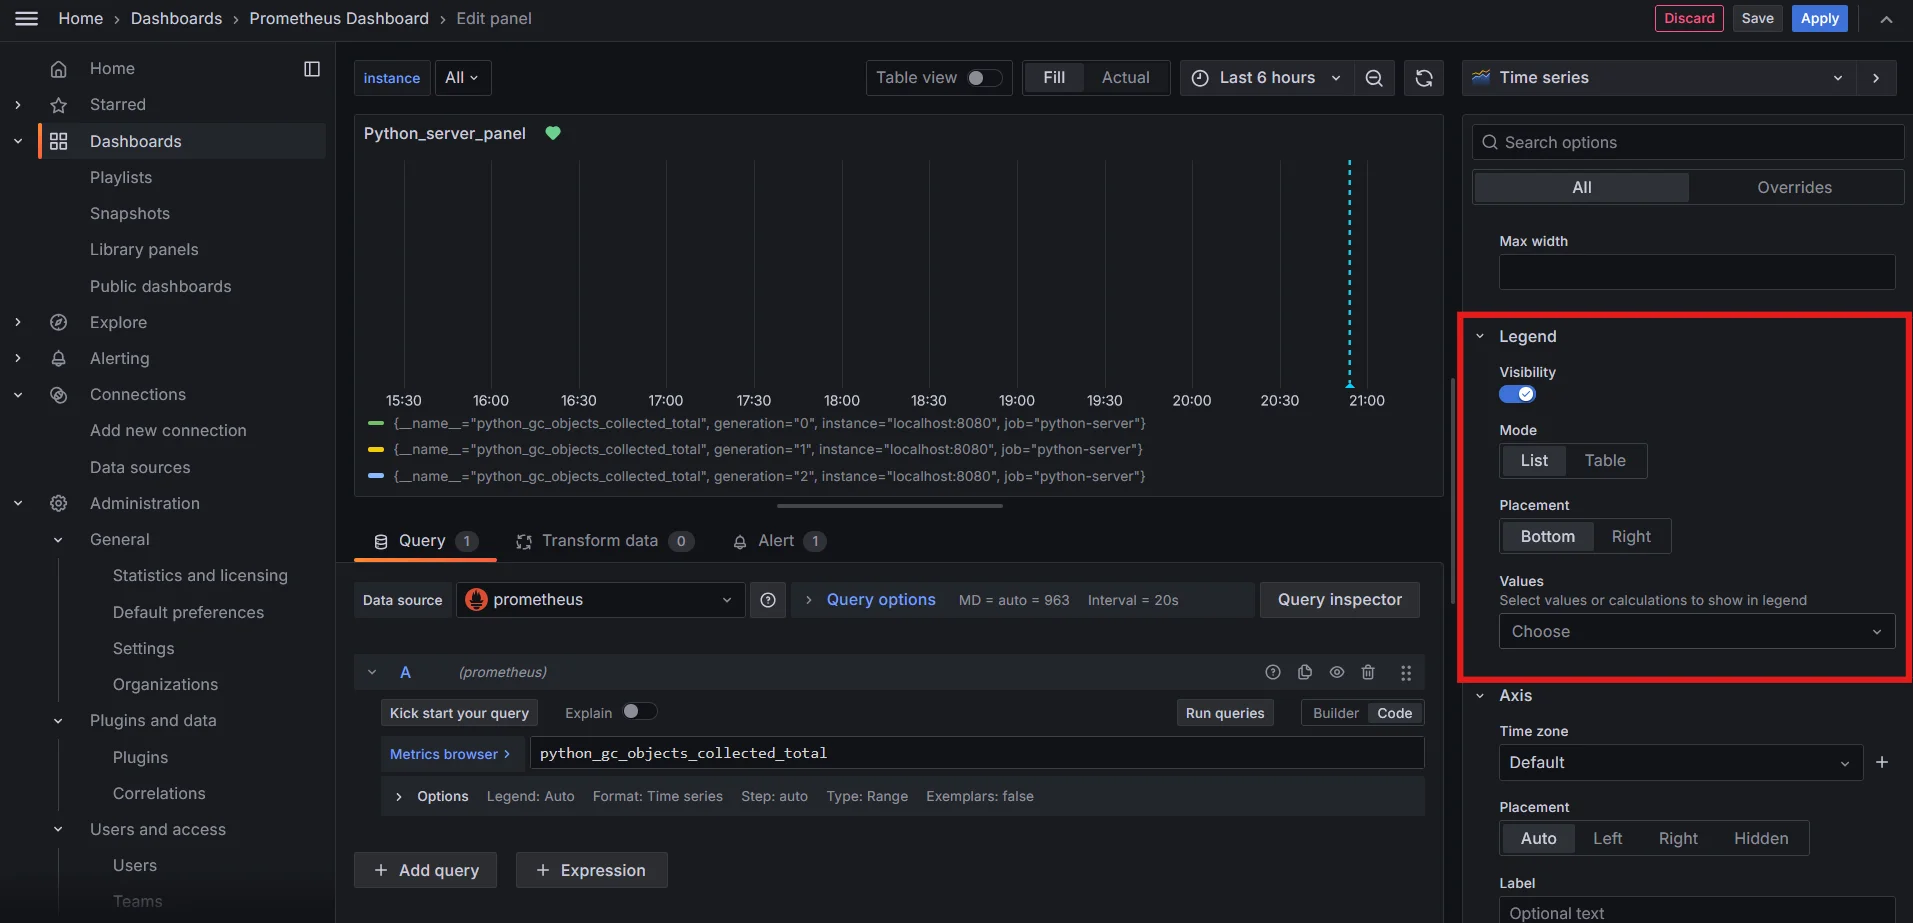
Navigating to Legends tab in Panel settings Under Mode, select Table.
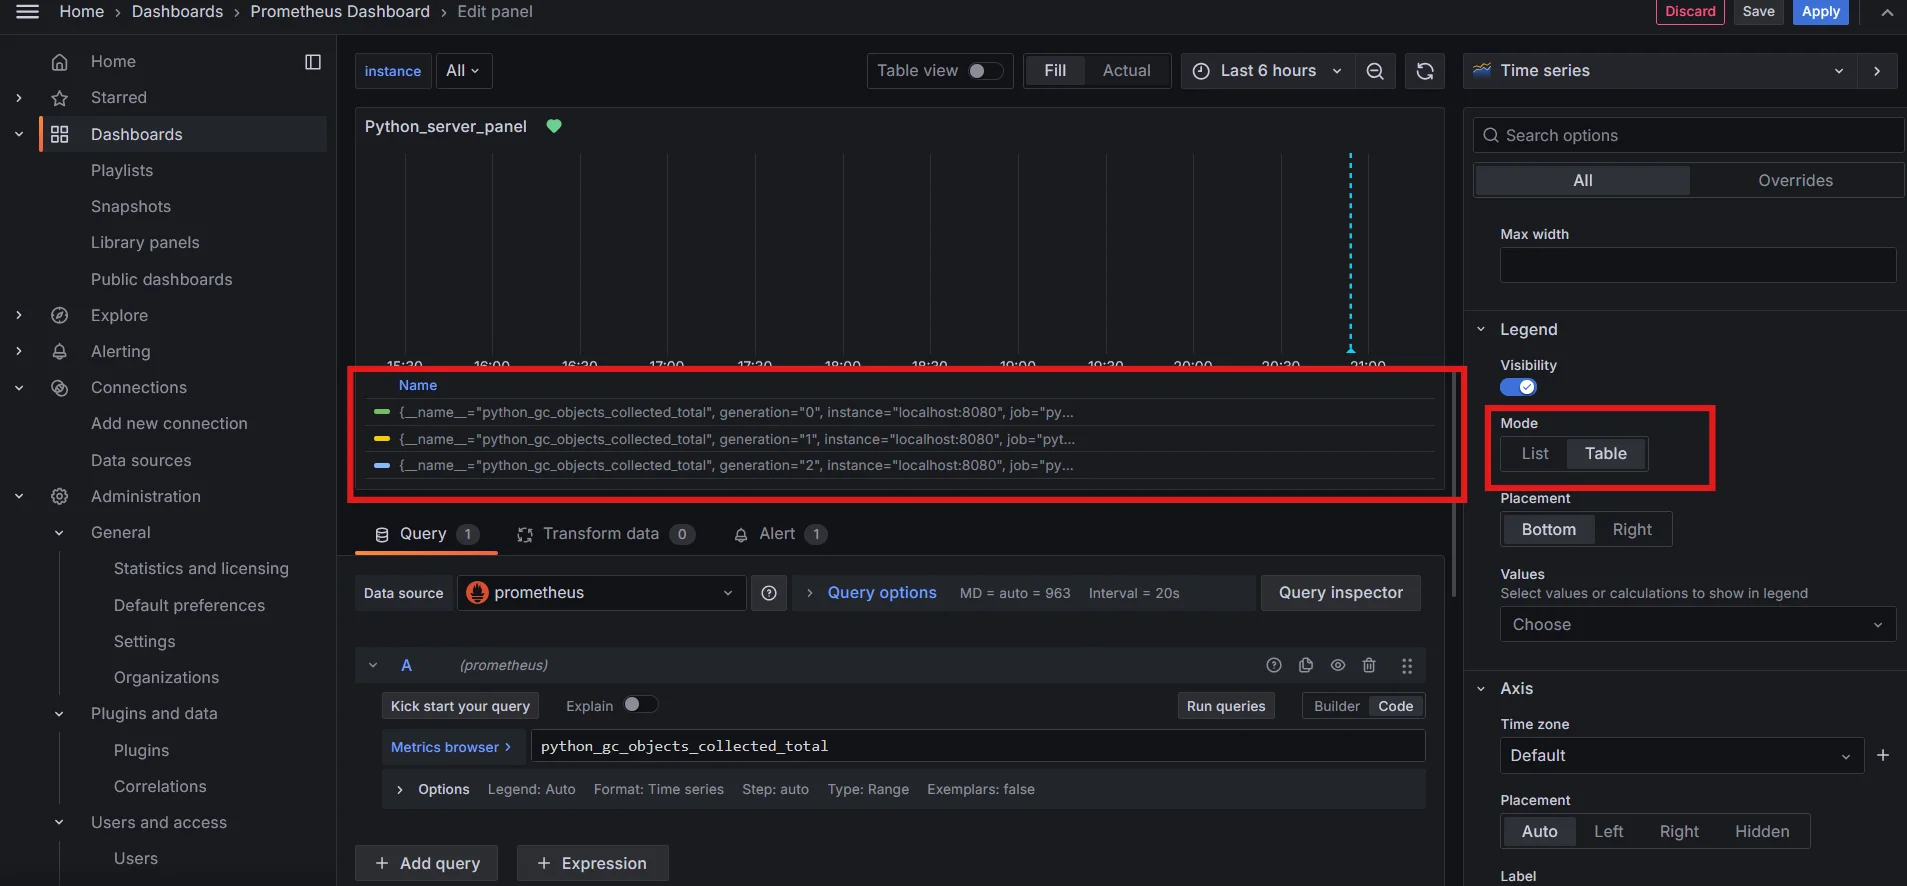
Selecting Legend Mode Under Values, select the value or calculation that you want to show. The legend table now displays values.
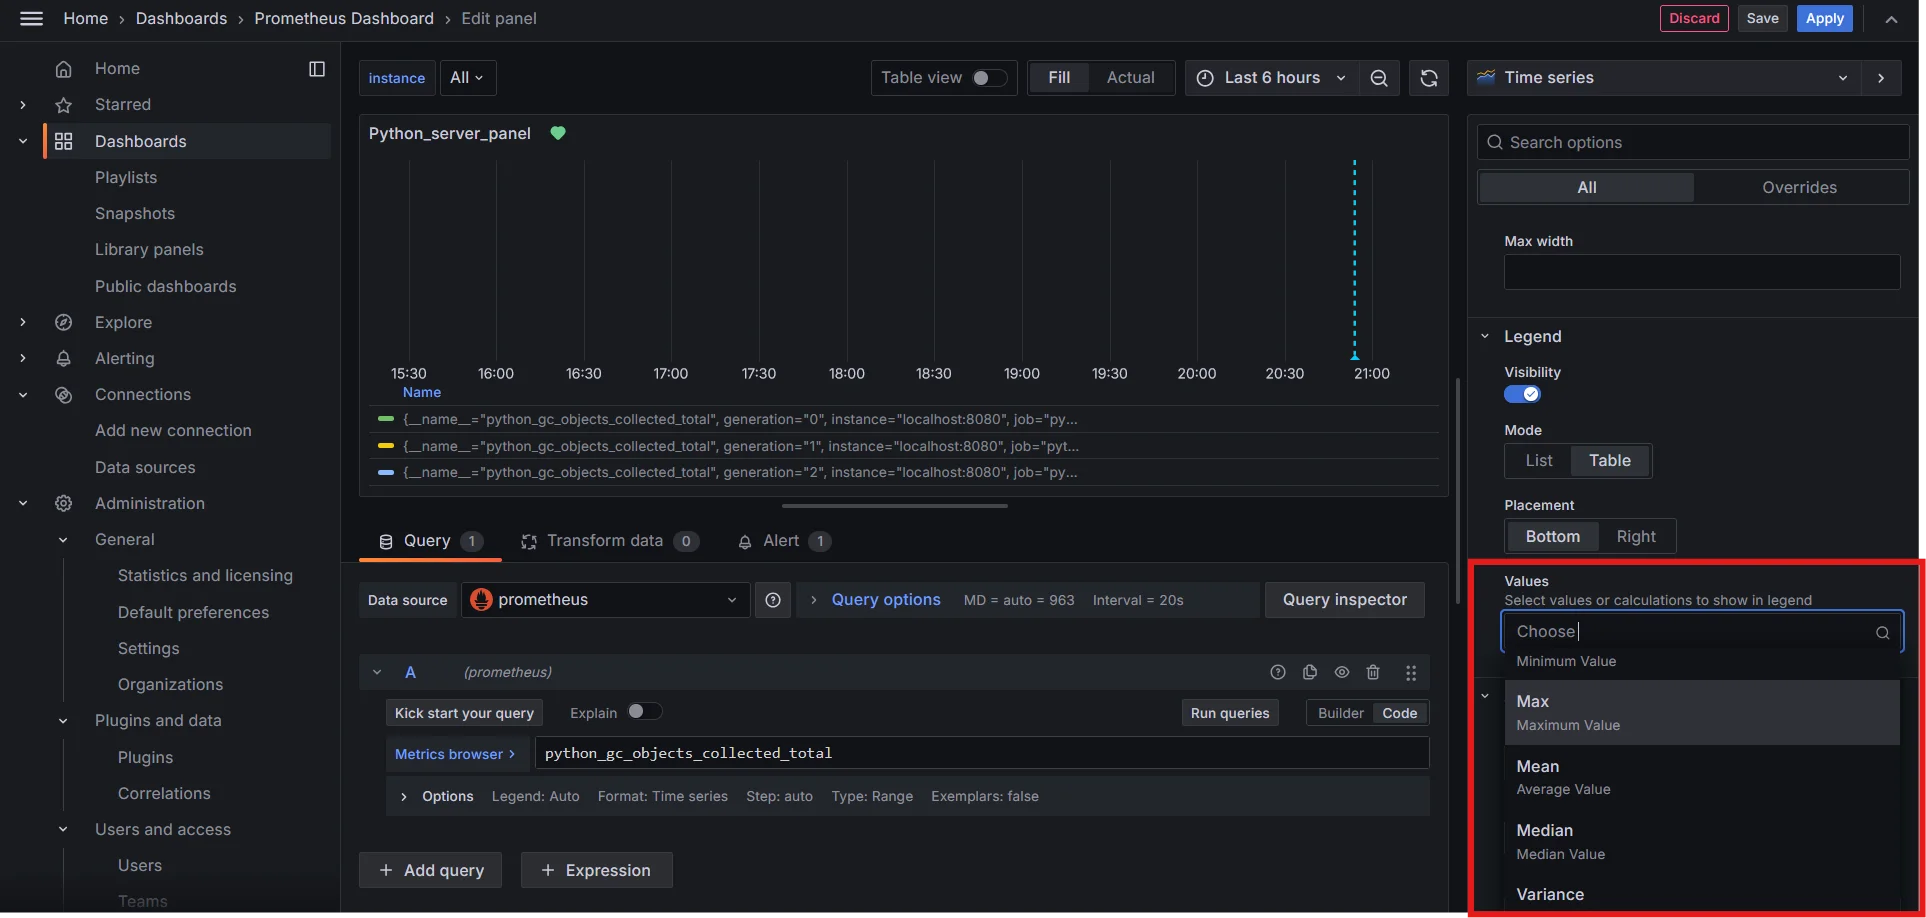
Selecting Legend Values 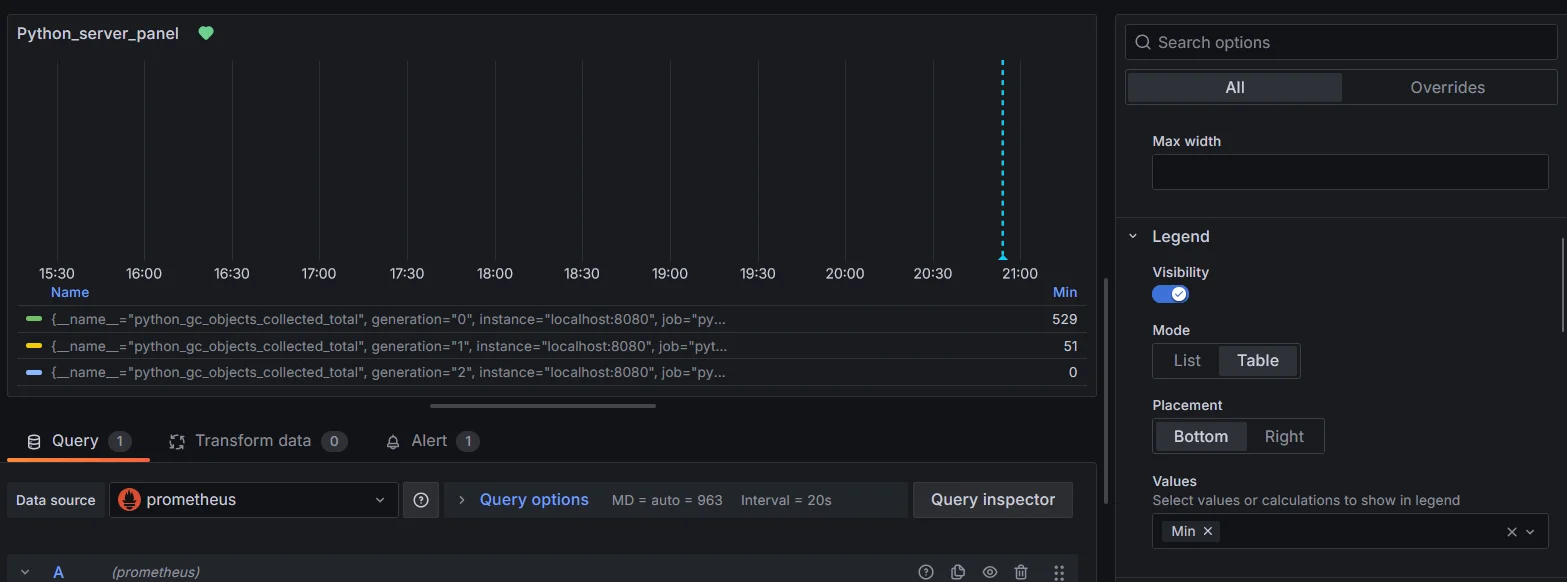
Values get added to the Legend table Click the calculation name header in the legend table to sort the values in the table in ascending or descending order.
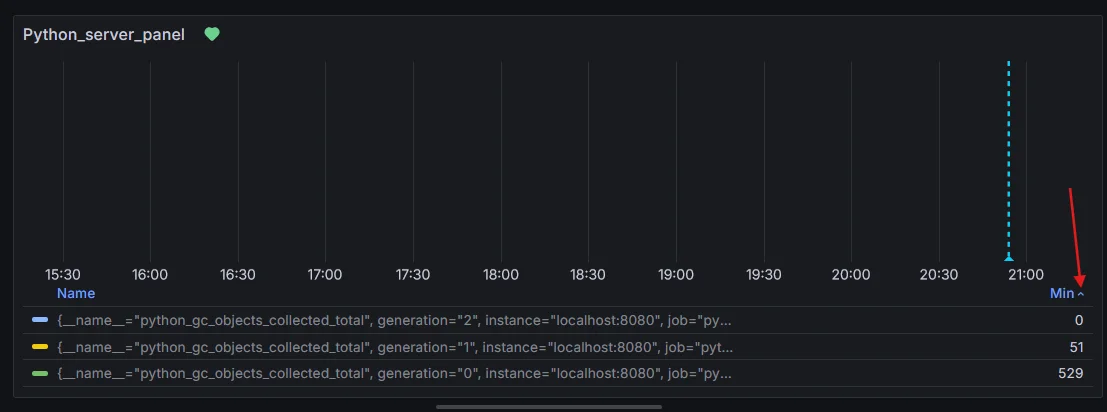
Sorting Legend table based on Values
2. Leveraging Prometheus Query Functions
While Prometheus doesn't have direct sorting functions, you can use label manipulation to influence legend order.
To use sort_by_label() or sort_by_label_desc(), you must enable the experimental feature in Prometheus by passing the feature flag:
--enable-feature=promql-experimental-function

After enabling the flag, you can sort by label values directly. For example:
Ascending order by label value (
generationin this case):sort_by_label(python_gc_objects_collected_total, "generation")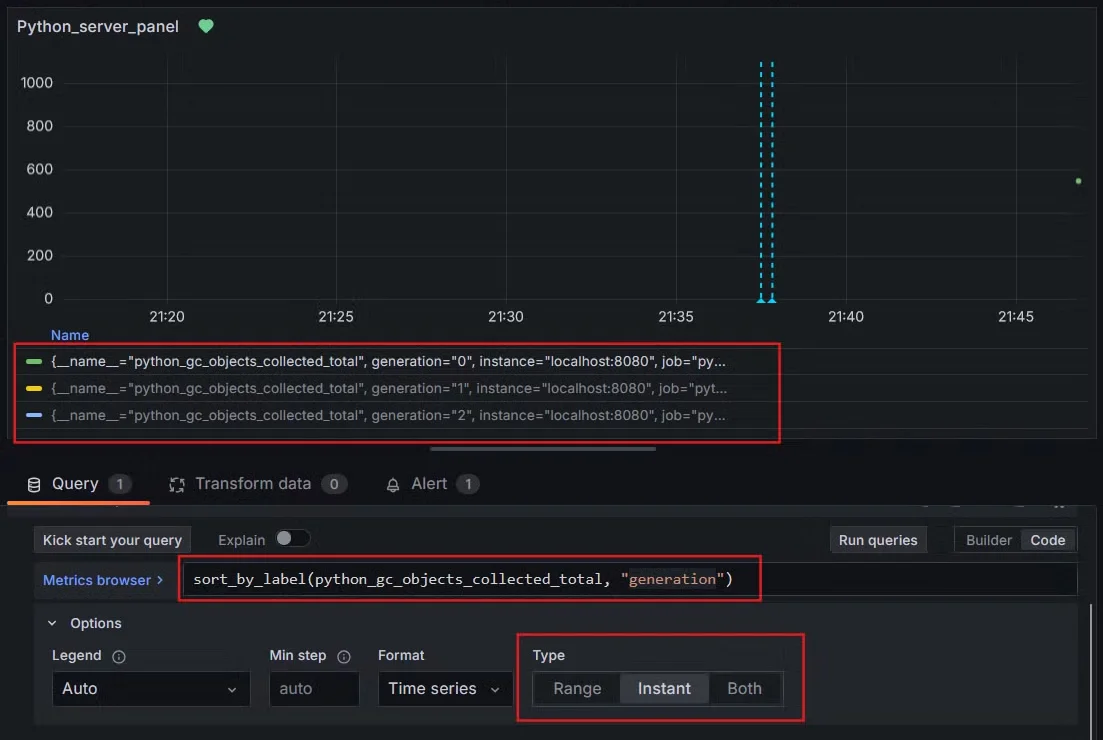
Running PromQL to sort legends in ascending order Descending order by label value (
generation):sort_by_label_desc(python_gc_objects_collected_total, "generation")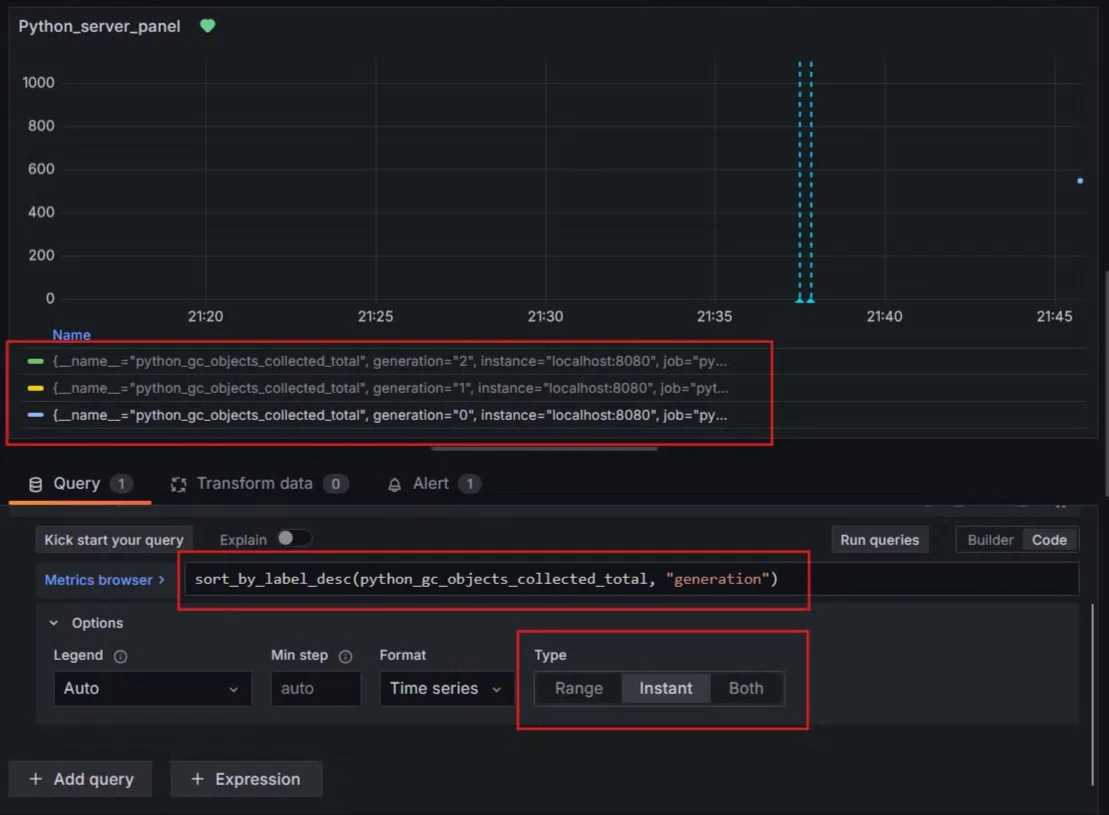
Running PromQL to sort legends in descending order
Best Practices for Legend Management in Time Series Visualizations
Follow these best practices to make the most of your legend sorting efforts:
- Consistent Naming: Use clear and uniform names for series to enhance readability.
- Color Selection: Choose contrasting colors for better visibility, considering color blindness.
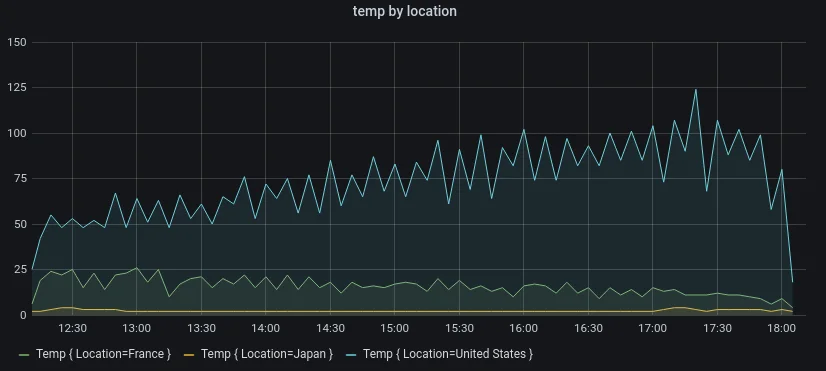
- Limit Series: Avoid overcrowding the legend; focus on key metrics to maintain clarity.
- Grouping: Group-related metrics to improve intuitive understanding.
- Interactive Features: Enable click-to-hide/show options for user customization.
- Descriptive Labels: Use labels that provide context for easier interpretation.
- Performance Optimization: Optimize queries for large datasets to maintain performance.
By applying these practices, you can improve the effectiveness of legends in your visualizations.
Current Limitations in Sorting Legends by Series Name
Despite the clear benefits, sorting legends by series name isn't always straightforward in Prometheus and Grafana. Some limitations include:
- Default behavior: Grafana's default legend sorting is often based on the order in which series appear in the query results, not alphabetically by name.
- Prometheus Query Limitations: Functions like
sort()apply only to instant queries, with range queries maintaining fixed ordering. - Multi-Dimensional Data Challenges: Sorting can be complex with multi-dimensional metrics, complicating legend display.
Future Developments in Legend Sorting
The Prometheus and Grafana communities are continually working on improvements. Keep an eye out for:
- Enhanced sorting capabilities in future Grafana releases
- Community-developed plugins for advanced legend management
- Potential improvements in Prometheus' data model to facilitate easier sorting
Enhancing Observability with SigNoz
SigNoz offers a powerful solution for observability and time-series data visualization, particularly when managing large datasets. Although it doesn’t currently support legend sorting by series name either, SigNoz excels in areas like seamless integration with open standards such as OpenTelemetry, efficient querying, and built-in analytics tools. These features help streamline performance monitoring and troubleshooting, making SigNoz a solid choice for teams looking to enhance their observability stack beyond what Prometheus and Grafana offer today.
Key Benefits of SigNoz:
- Advanced Log Querying: SigNoz provides a powerful log query builder, allowing users to search, filter, and analyze logs effortlessly.
- Efficient Filtering: With flexible filtering options, you can narrow down logs by service, timestamp, or specific labels. This ability to focus on relevant data ensures faster troubleshooting and root cause analysis.
- Intuitive Interface: With a user-friendly interface, SigNoz simplifies the process of managing legends and visualizations.
- Comprehensive Monitoring: It integrates well with existing monitoring setups, providing a seamless experience for tracking performance and metrics.
SigNoz Cloud is the easiest way to run SigNoz. Sign up for a free account and get 30 days of unlimited access to all features.
You can also install and self-host SigNoz yourself since it is open-source. With 24,000+ GitHub stars, open-source SigNoz is loved by developers. Find the instructions to self-host SigNoz.
By leveraging SigNoz, you can effectively overcome the challenges associated with legend sorting and gain deeper insights into your data.
FAQs
Why can’t I sort legends alphabetically by default in Grafana?
Grafana’s default sorting is based on the data values or time series order. However, newer versions of Grafana offer built-in sorting options in the panel settings.
How does sorting legends affect Grafana's performance?
For small to medium-sized datasets, the impact is negligible. However, sorting large datasets with many series can potentially impact rendering time.
Can I use PromQL to sort my legend entries?
Yes. You can use PromQL functions like sort() and sort_desc() to control the order of data before it reaches Grafana in case of instant queries.
What are the alternatives to native legend sorting in Prometheus/Grafana?
Alternatives include using external data processing tools, implementing server-side sorting with middleware, or exploring comprehensive observability platforms like SigNoz that offer advanced legend management features.
