How to Create Dynamic Grafana Templates with Chained Variables
Dynamic dashboards are essential for teams who rely on scalable monitoring solutions, especially when working with vast datasets. By leveraging chained variables in Grafana, you can make your dashboards adaptable, enabling them to respond to changes in data sources without manual updates. This article walks you through creating powerful Grafana templates with interconnected (chained) variables, specifically using Prometheus as a data source.
Understanding Grafana Template Variables
Template variables in Grafana allow users to switch between different data views without creating multiple dashboards. They act as placeholders in your Grafana dashboards. This helps users analyze data from multiple sources or viewpoints within a single dashboard setup.
Different Types of Variables
Grafana supports several types of variables, each serving specific needs:
Query Variables
Query variables pull dynamic data directly from a data source, such as Prometheus, to populate options in a dropdown.
Example: A query like
label_values(http_requests_total, job)will list all the available jobs in Prometheus and let users select from them.Custom Variables
Custom variables allow you to define static options manually, which are useful when you have a fixed set of choices.
Example: A custom variable with values like
production,staging,developmentcan be used to filter a dashboard based on the selected environment.Constant Variables
Constant variables hold a fixed value that remains the same across the entire dashboard, ideal for reusable static information.
Example: A constant variable like
cluster_name: "production-cluster"can be used throughout the dashboard to reference a specific cluster.Datasource Variables
Datasource variables allow you to switch between different data sources dynamically, useful when working with multiple data sources.
Example: A datasource variable can switch between Prometheus and InfluxDB, depending on which source you want to query for the dashboard.
How Variable Chaining Works
Variable chaining in Grafana allows you to create a dynamic relationship between two or more variables, where the options available in one variable depend on the selection made in another. This creates a cascade effect, ensuring that each dropdown filters the next based on the previous selection. This is particularly useful when you have hierarchical or related data, such as selecting a job and then filtering available instances within that job.
How It Works:
- Parent Variable: The first variable, often called the parent, provides the initial selection options. For example, a "job" variable might list all available jobs in your system.
- Dependent Variable: The second variable, known as the dependent variable, changes its available options based on the selection made in the parent variable. For example, selecting a specific job can filter the "instance" variable to show only instances related to that job.
Example:
- Job Variable:
job=production,job=staging - Instance Variable: If
job=productionis selected, the instance variable might show only instances related to the production job, likeinstance=prod-server-1,prod-server-2. - If
job=stagingis selected, the instance dropdown updates to show instances likestaging-server-1,staging-server-2.
In Grafana, variable chaining allows one variable to reference another’s value, creating dynamic filtering for more granular insights. Chained variables are particularly useful in dashboards that monitor multiple systems or environments, enabling them to respond based on selections from other variables.
Creating Your First Chained Variable with Prometheus
Let’s create a basic setup with Prometheus to see how chained variables work.
- Set Up the Primary Variable
Go to Dashboard Settings > Variables and click Add variable.
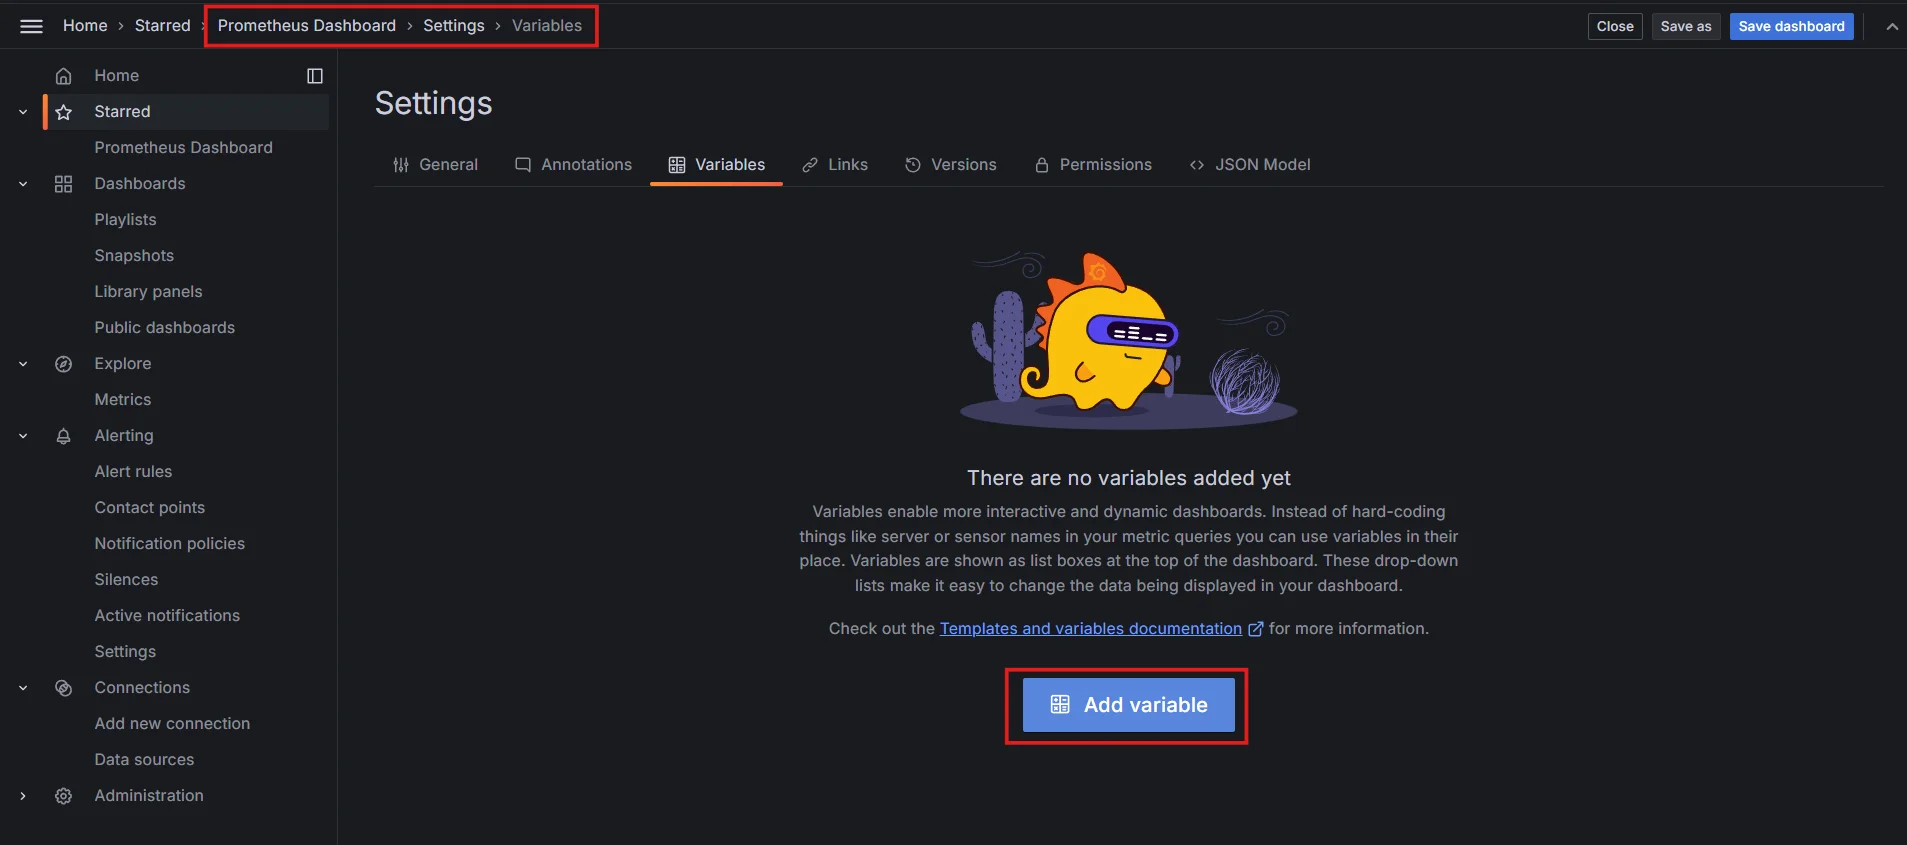
Adding Variables in dashboards Select Query as the variable type and choose Prometheus as the data source.
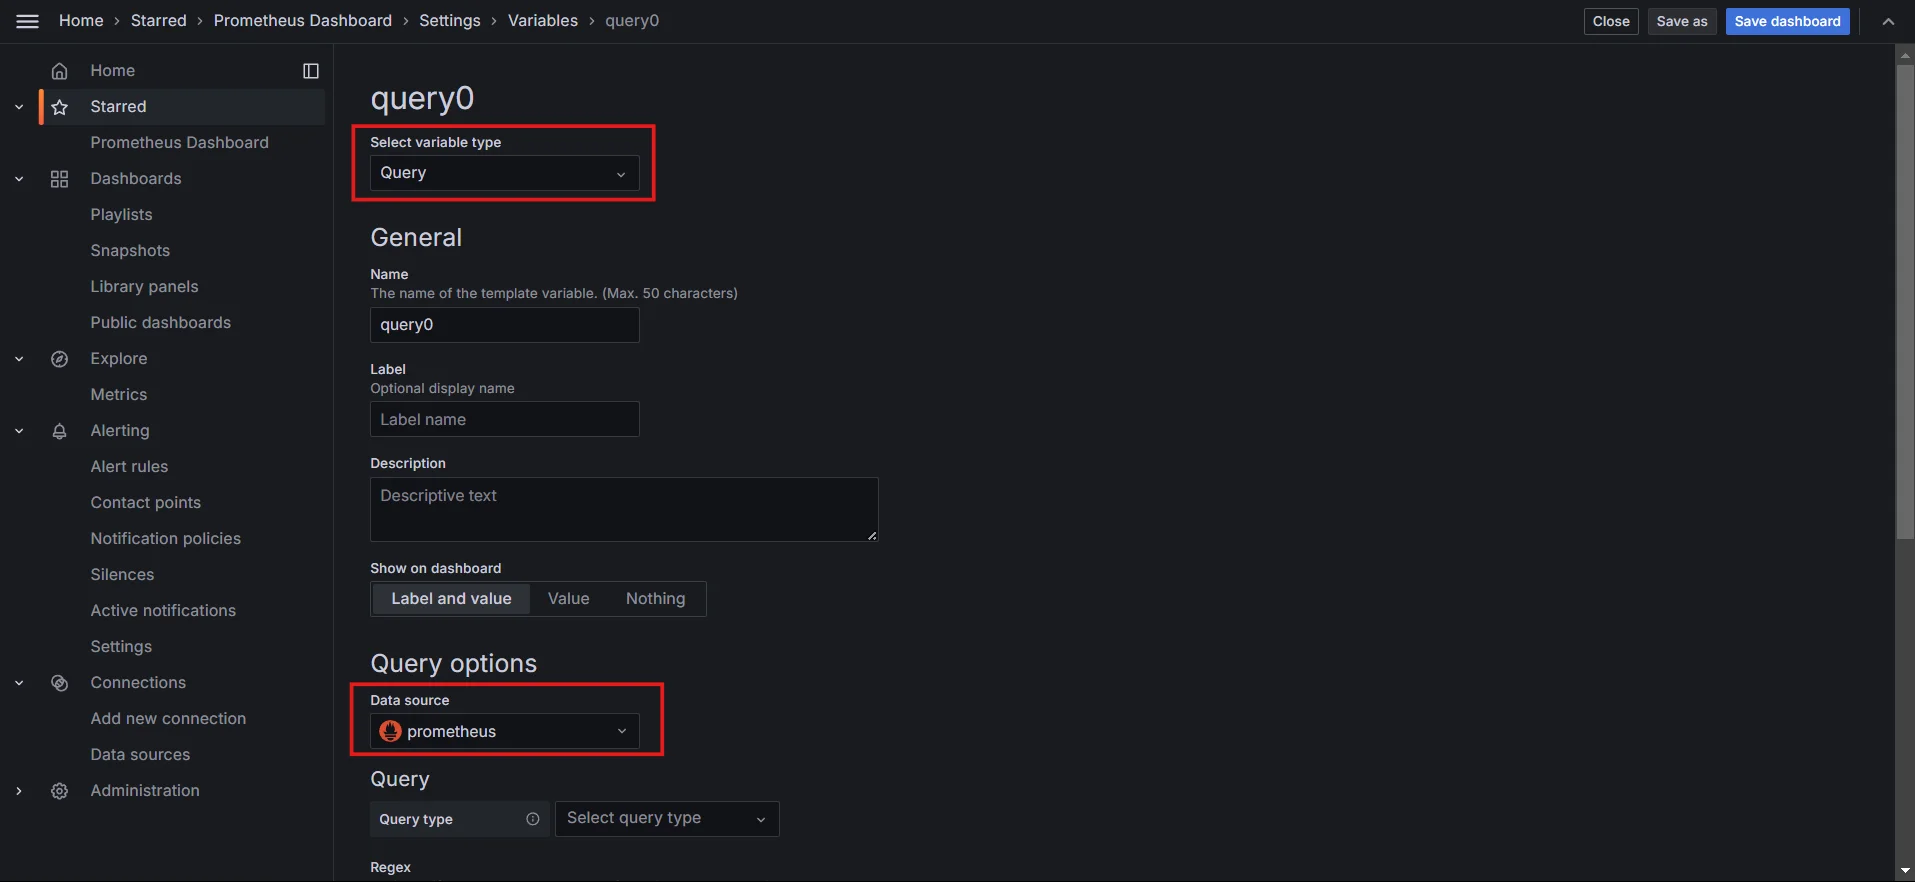
Defining variable parameters In the Query field, use a query like
label_values(job)to retrieve all available jobs.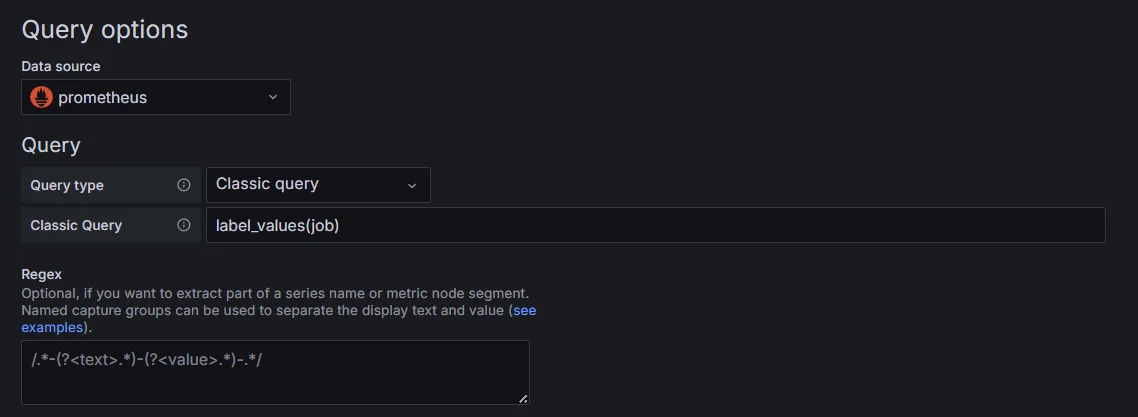
Writing query to populate values in the variable Give the variable a name, e.g.,
job, and click on the Apply button.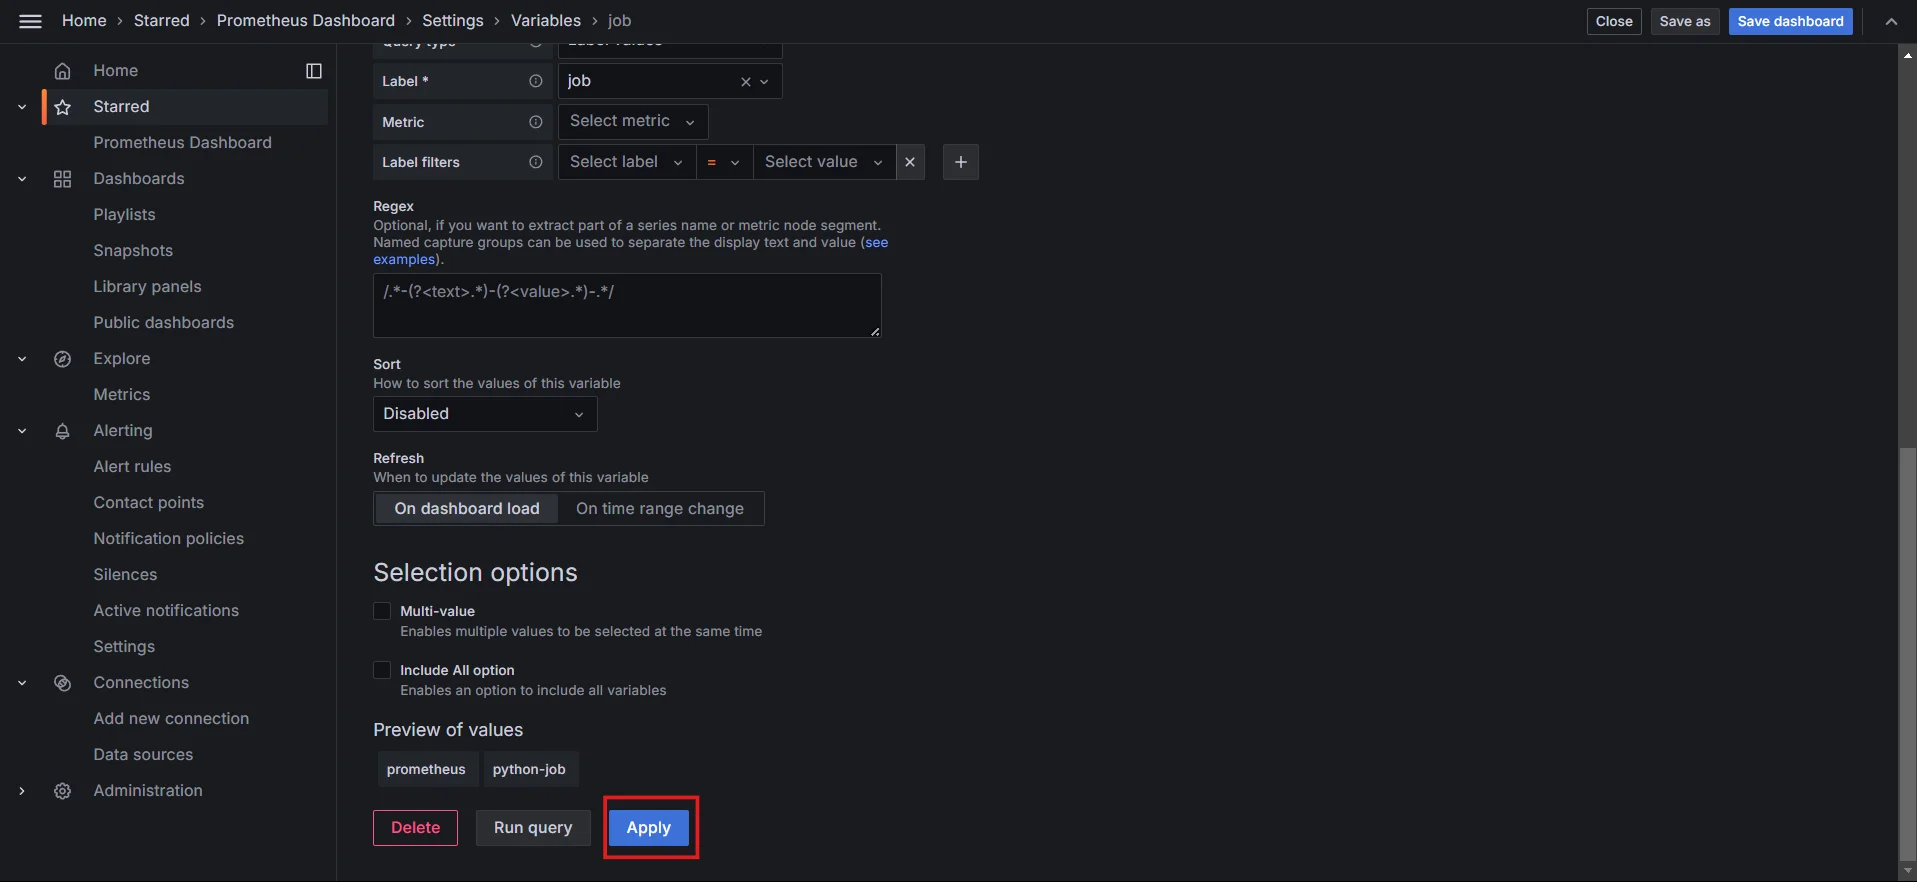
Saving the variable
- Configure the Dependent Variable
- Add a new variable and select Query as the type.
- Set Prometheus as the data source.
- In the Query field, use
label_values({job="$job"}, instance)to populate instances based on the selectedjobvalue. This example uses$jobas a reference to the primary variable. - Name the variable
instanceand save it.
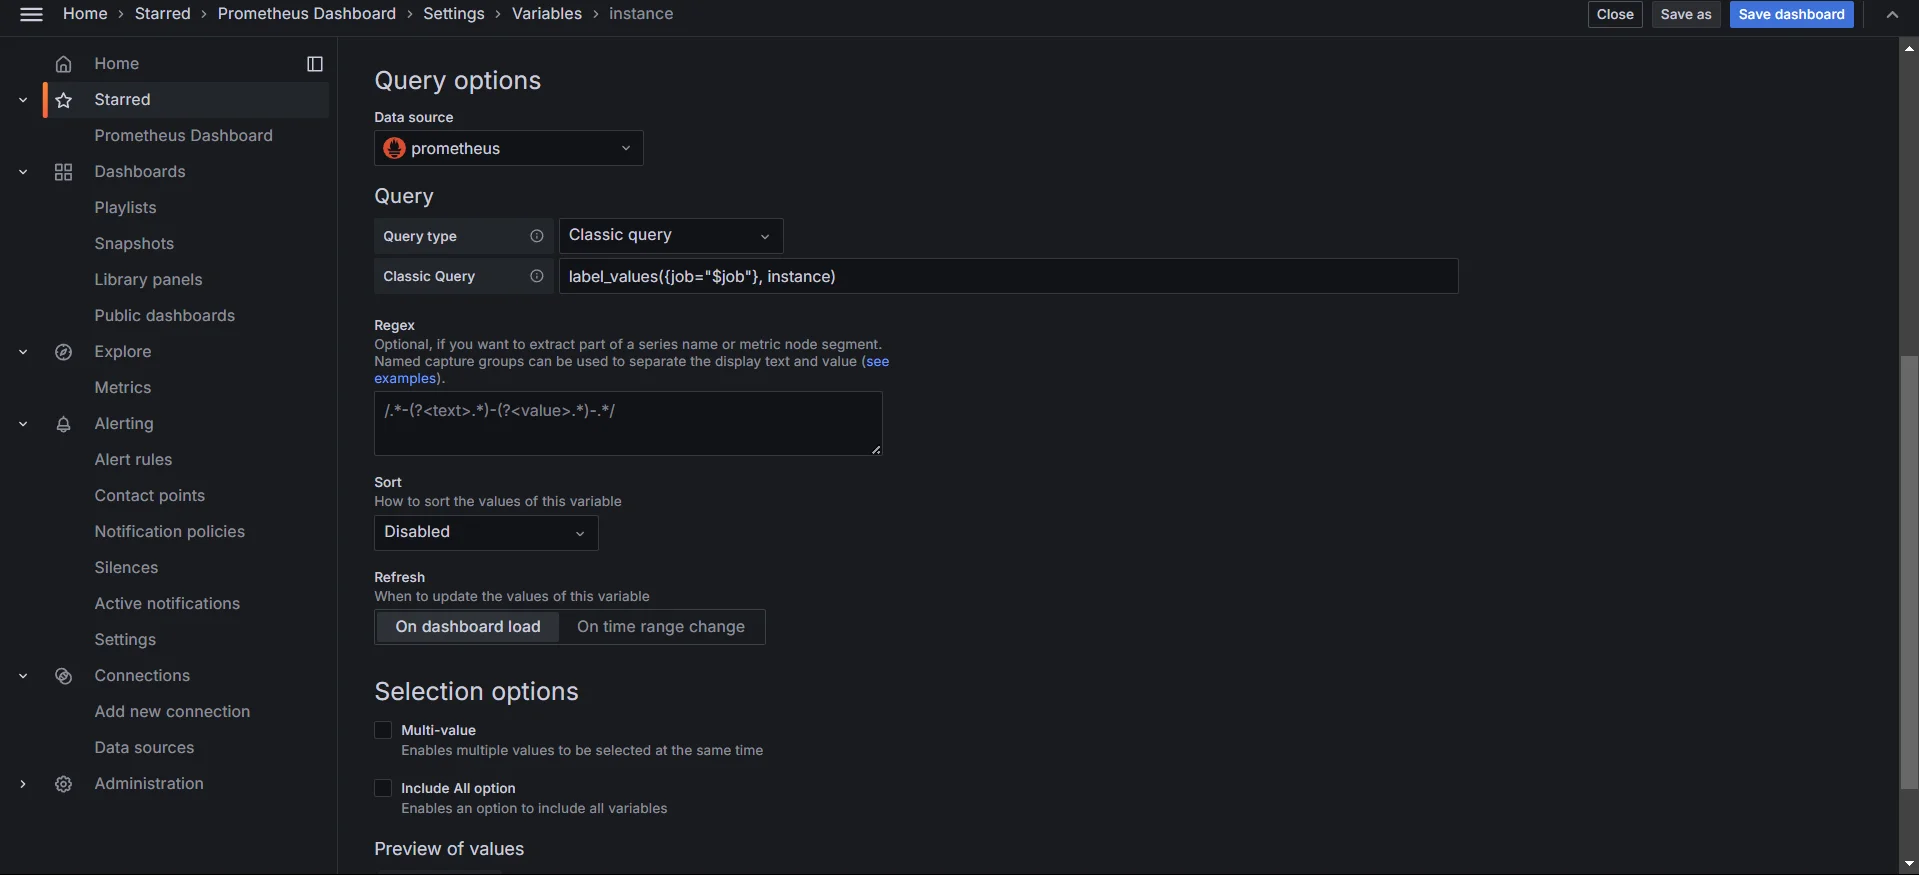
Creating Dependent Variable
Understanding Variable Syntax
Grafana variables use $variable_name syntax by default. When using them in more complex expressions, ${variable_name} syntax can prevent ambiguity in Prometheus queries.
Example: label_values(metric_name{instance="${instance}"}).
Best practices for naming and organizing variables
- Use descriptive names (like
job,instance, etc.) for clarity. - Group related variables together to avoid confusion in large dashboards.
Variable Reference Patterns
Once you've set up basic variables, you can explore more advanced reference patterns to create more dynamic and context-sensitive queries in Grafana. Here's how to handle both simple and more complex references:
Basic and Complex Patterns
- Single Variable Reference:
- This is a straightforward way to reference a single variable in your query. For example,
label_values(job)fetches all available job labels. - To filter a second variable based on the first (e.g.,
instancevalues associated with a selectedjob), you can uselabel_values(instance, {job="$job"}). This ensures that theinstancevariable only shows values for the chosenjob, allowing you to narrow down your data selection step-by-step.
- This is a straightforward way to reference a single variable in your query. For example,
- Multiple Dependencies:
- As dashboards become more complex, you may need to reference more than one variable in a single query. This allows for deeper filtering of data based on multiple criteria.
- For example,
label_values(metric_name{job="$job", instance="$instance"})references bothjobandinstancevariables. This query would fetch metric values filtered by both the selectedjobandinstancevalues, making the data highly specific to your selections.
- Single Variable Reference:
Using Regex Filters
You can filter values based on patterns with regex:
- For example, using
label_values({job=~"$job_pattern"}, instance)allows dynamic instance selection based onjob_pattern.
- For example, using
Error Handling and Validation
Sometimes, chained variables can lead to errors if a referenced variable isn’t set or returns no results. To manage this:
- Ensure primary variables have default values.
- Wrap queries in error-safe PromQL expressions if possible.
Advanced Variable Chaining Techniques
To enhance your dashboard even further, try these advanced techniques.
Implement Cascading Dropdowns
Cascading dropdowns in Grafana refer to a set of linked dropdown menus (variables), where the selection made in one dropdown dynamically filters the options available in the next dropdown. This "cascade" effect allows users to narrow down their data choices in a step-by-step manner, ensuring that each dropdown only shows relevant options based on the previous selection.
How Cascading Dropdowns Work:
- Parent Dropdown: The first dropdown contains a broad set of options (e.g.,
jobnames in a monitoring system). - Dependent Dropdown: The second dropdown shows a set of options that depend on the selection from the first dropdown (e.g., instances related to the selected job).
- Dynamic Filtering: When you choose a value in the parent dropdown, the dependent dropdown automatically updates to show only the relevant options based on that choice.
Example of Cascading Dropdown:
- Job: The first dropdown lists available jobs (e.g.,
job1,job2, etc.). - Instance: The second dropdown shows instances tied to the selected job (e.g., if you select
job1, the instance dropdown will show instances related tojob1only).
This functionality allows for more precise filtering and more efficient data exploration, especially in complex systems where variables have hierarchical relationships.
Steps to set up cascading dropdowns:
Define the Parent Variable (e.g.,
job)Create a variable for
jobthat lists all available jobs. This will be the parent dropdown.Define the Dependent Variable (e.g.,
instance)Create a second variable for
instancewith a query that uses the selectedjobvalue. For example, use$jobin the query to filter instances based on the chosen job.Save Both Variables
After setting up both variables, save the dashboard.
Test the Cascade
Go to the dashboard view, where you’ll see two dropdowns: one for
joband one forinstance.- Select a
jobin the first dropdown. - The
instancedropdown will automatically update to display only instances associated with the selected job, letting you refine data selections efficiently.
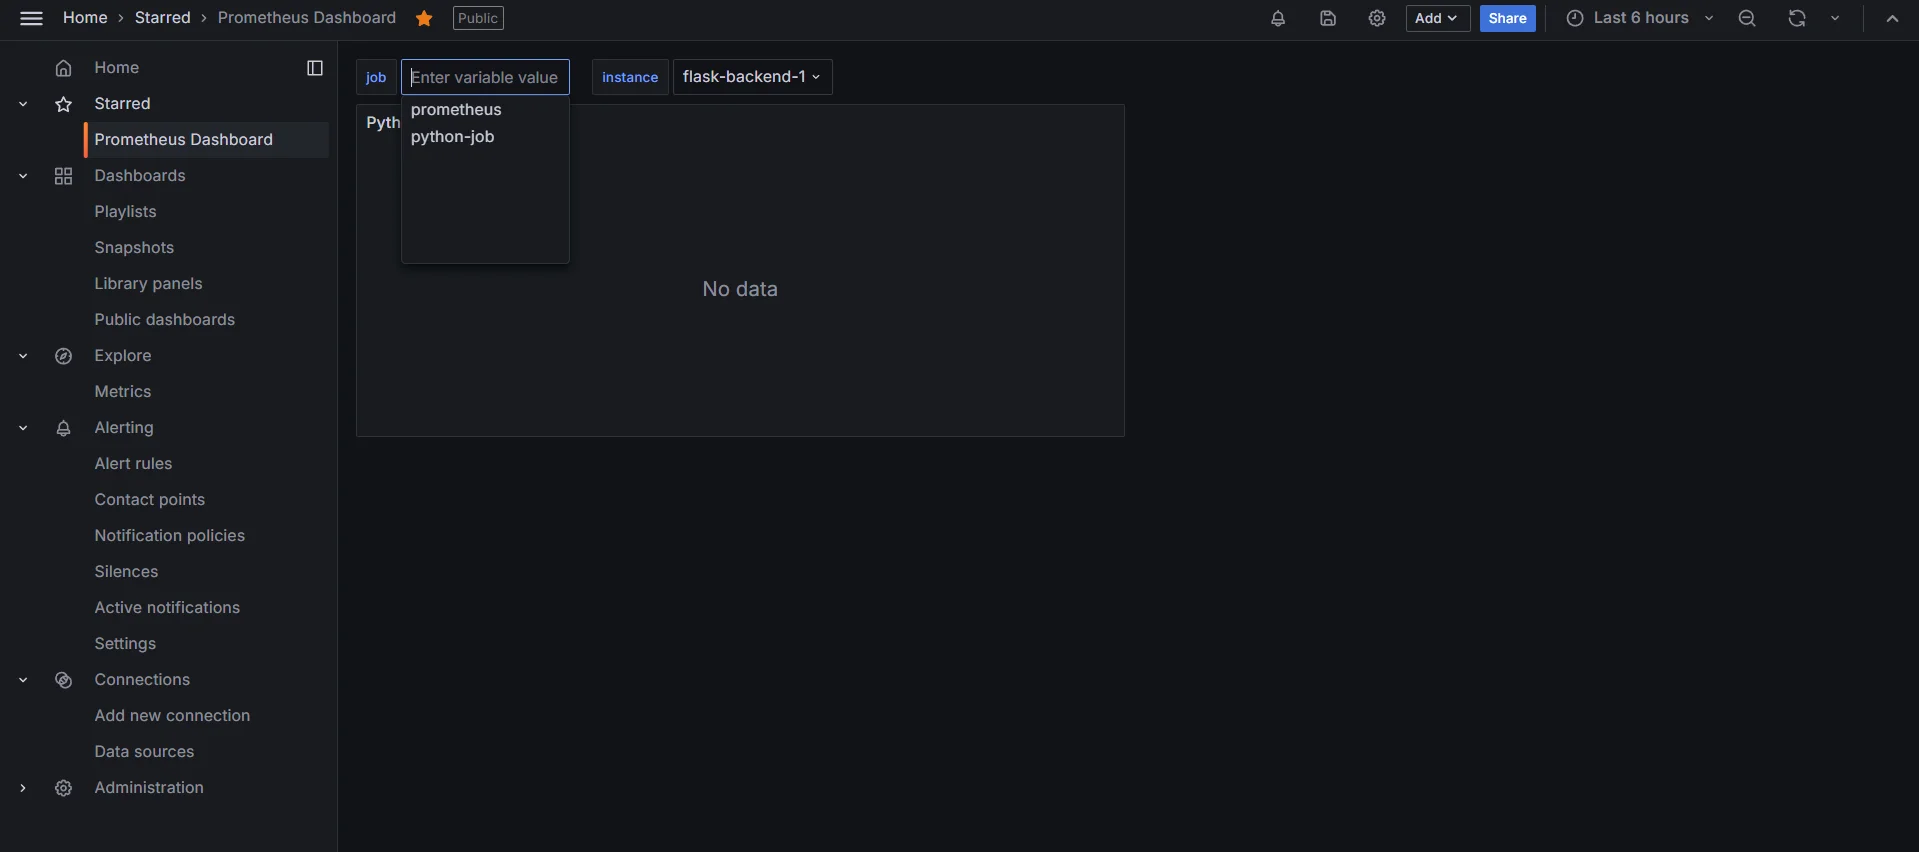
Cascading Dropdowns - Select a
To make use of these variables in a panel, you might use a query like:
up{job="$job", instance="$instance"}
This query will filter based on both the selected job and instance, displaying data specific to the chosen cascading options.
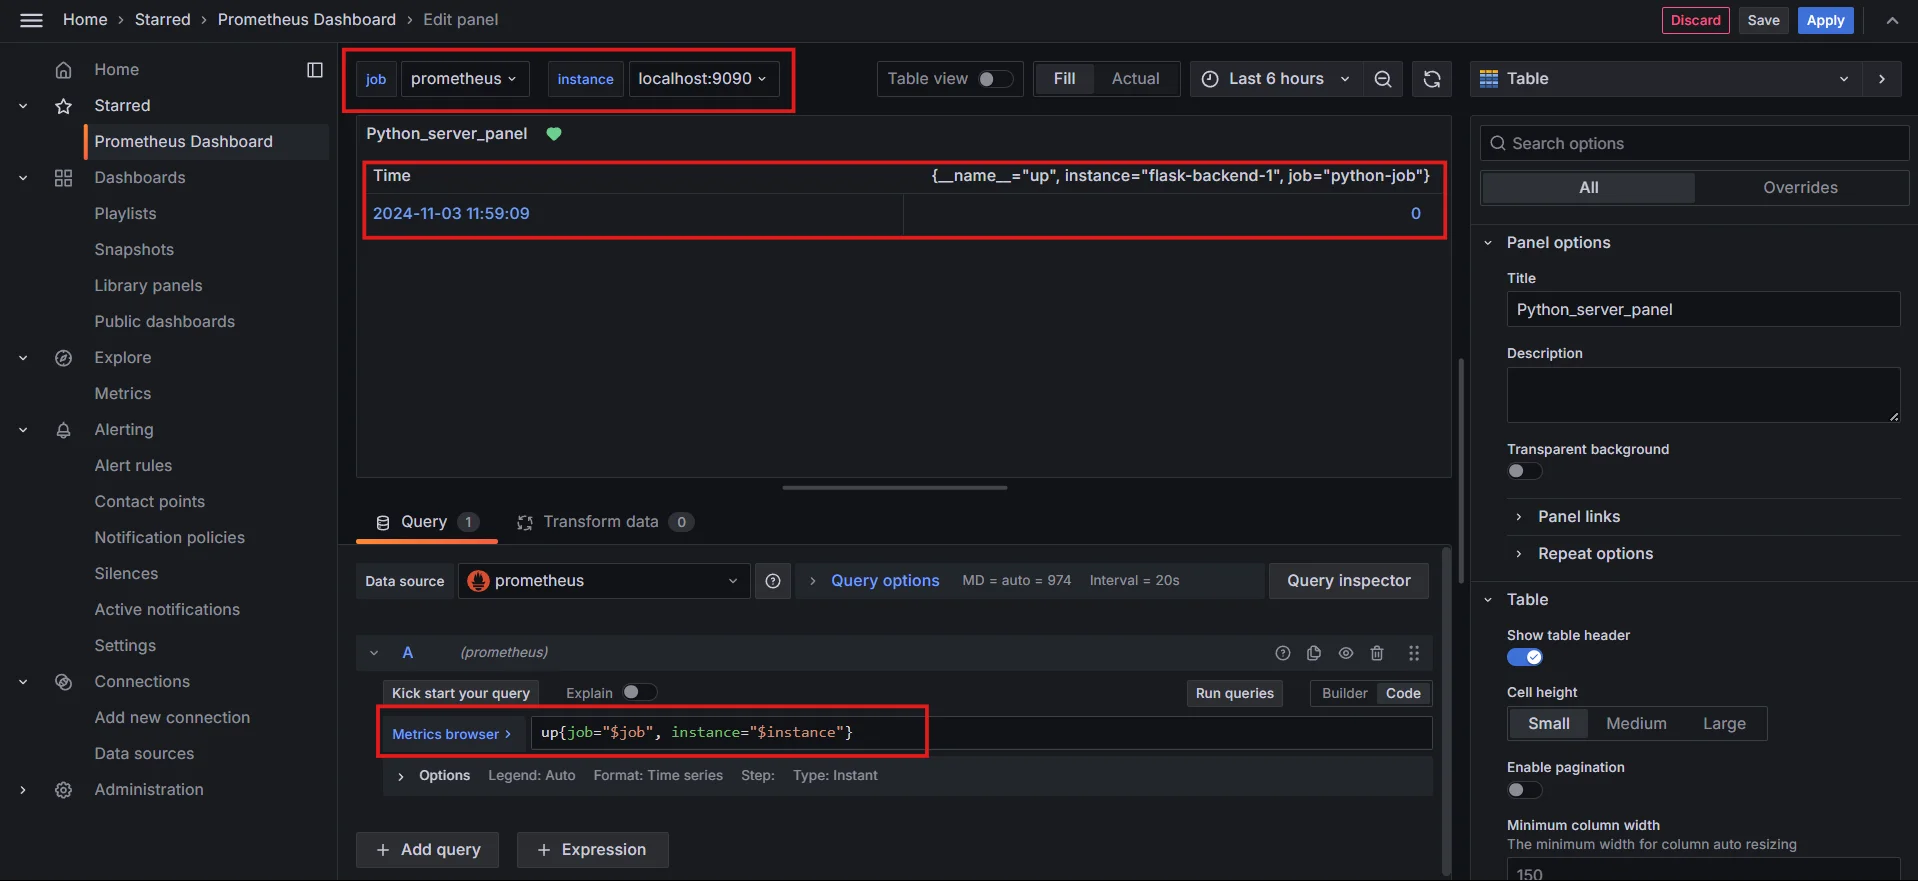
Create Dynamic Query Variables
Grafana’s query variable type allows you to define a Prometheus query directly as the source, e.g., label_values(node_cpu, "instance"). This ensures the list of instances reflects the latest data.
Use Prometheus functions like label_values(<label>) and label_values(<metric>, <label>) to create dynamic lists based on live metrics. Example: label_values(job) populates based on available labels in Prometheus.
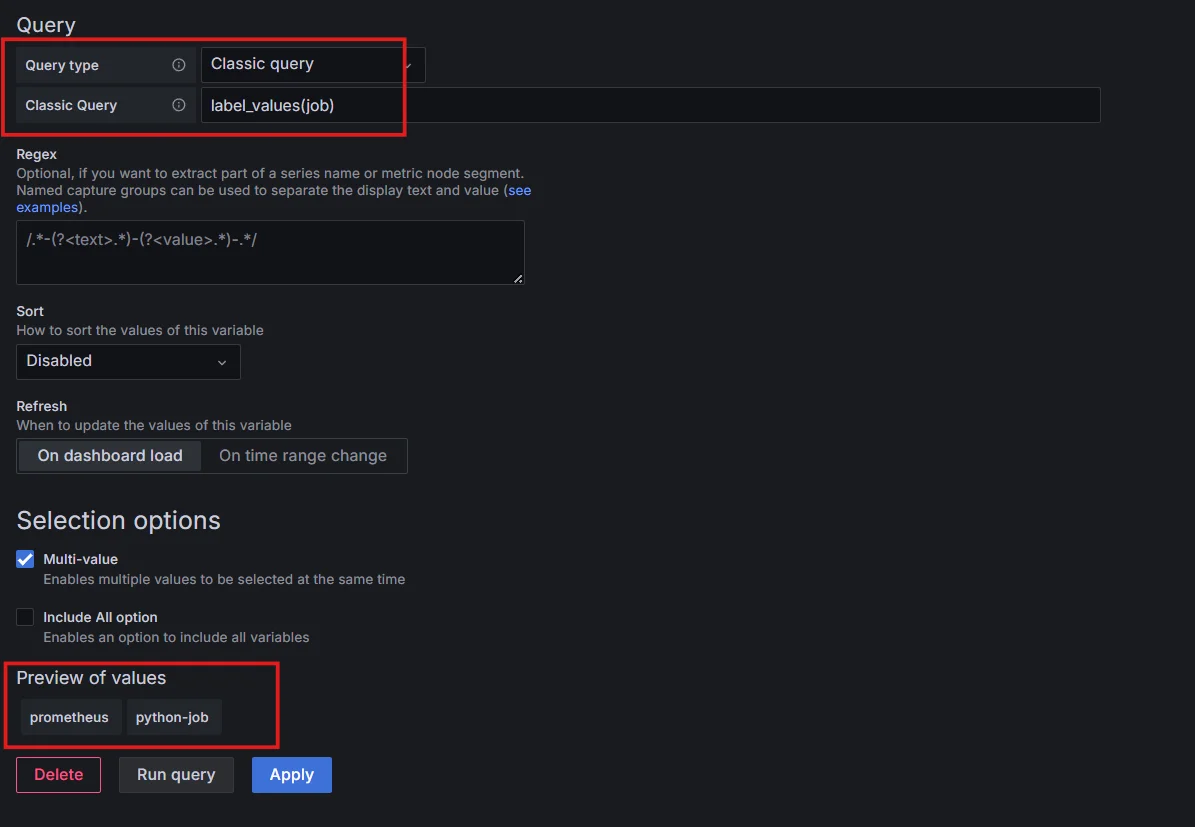
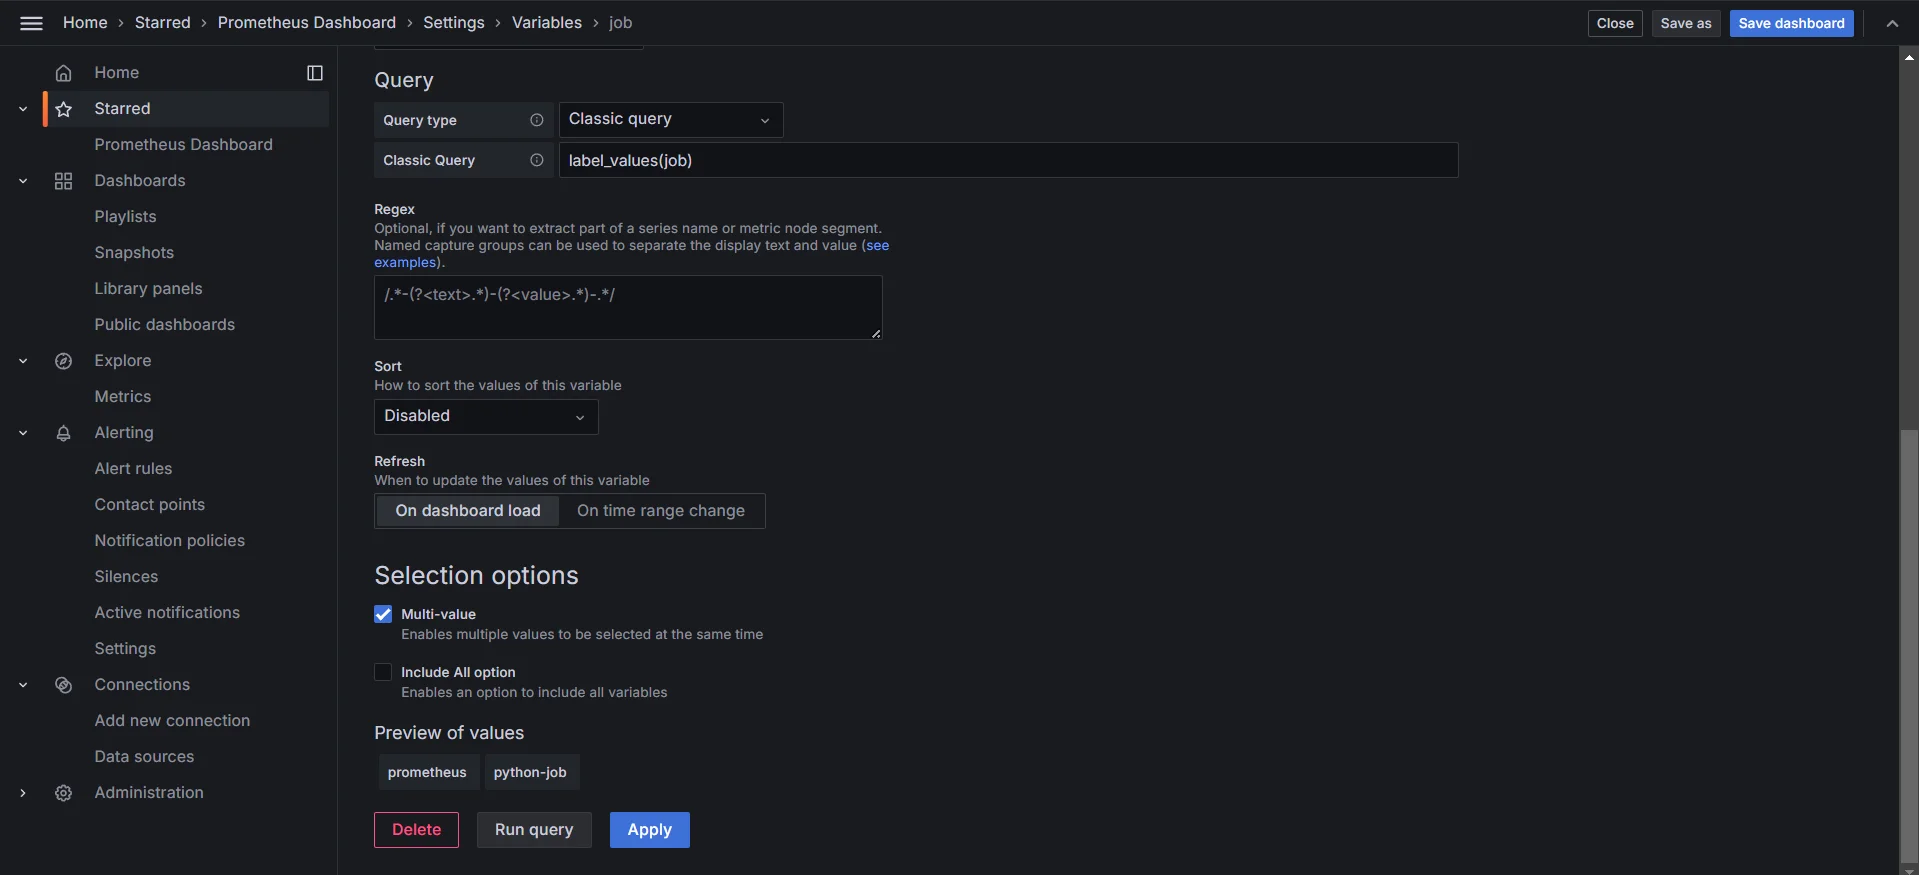
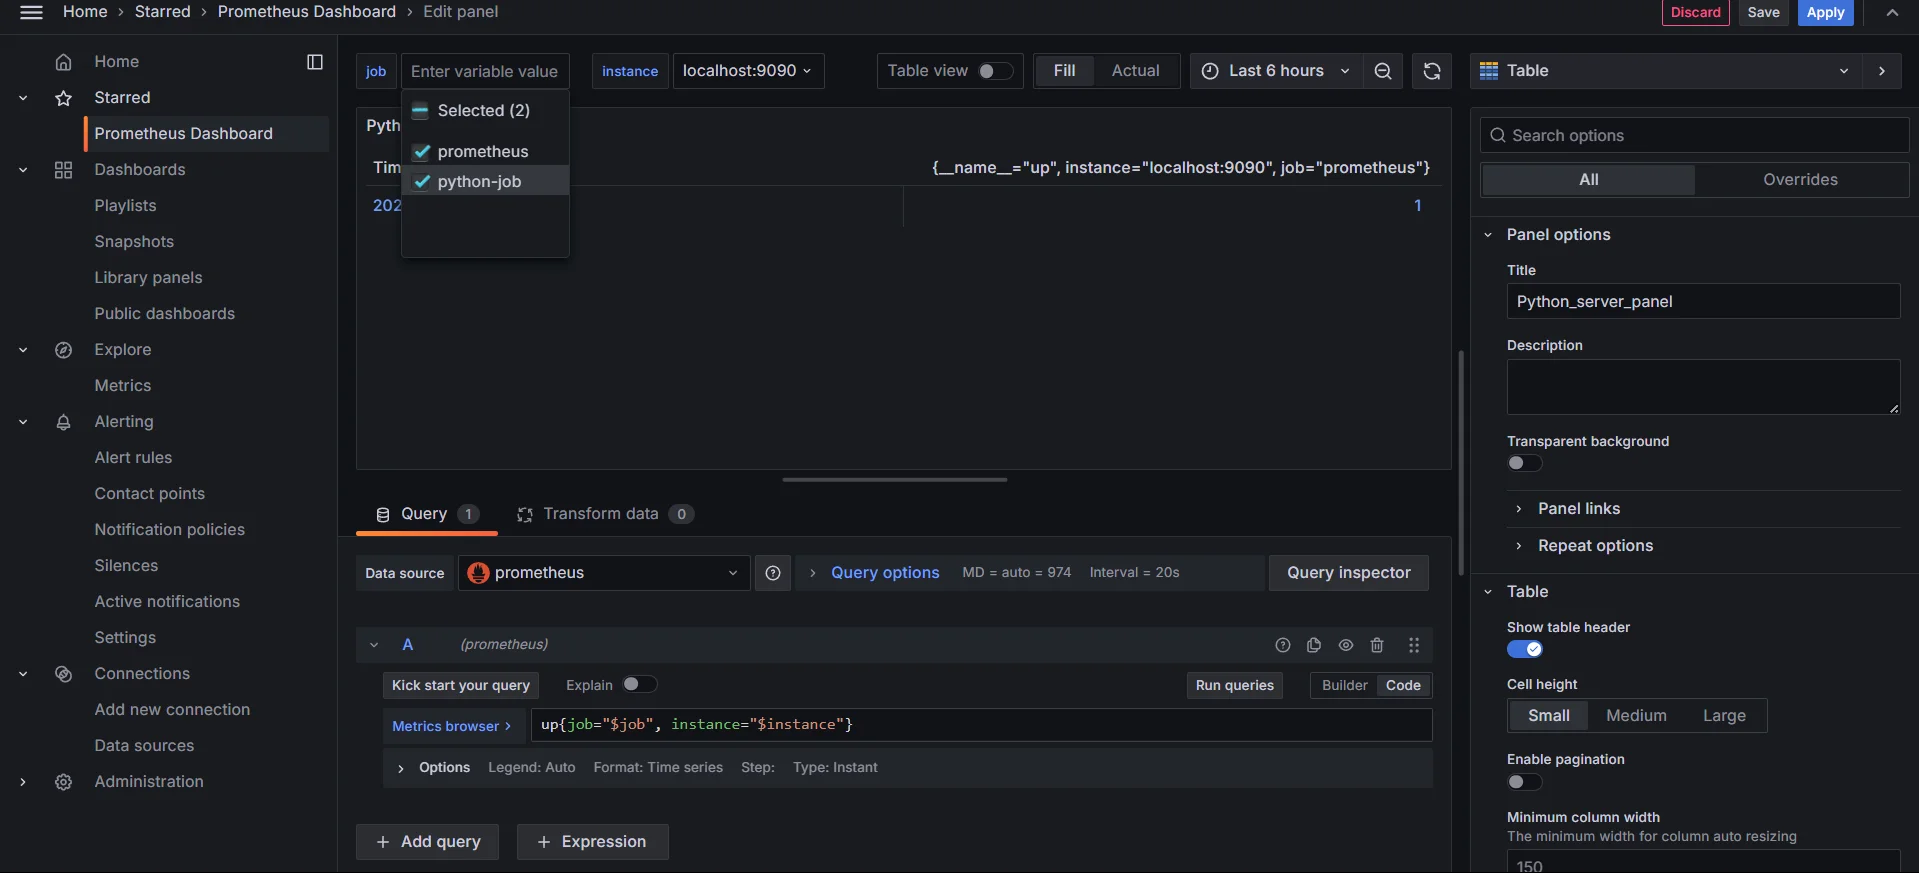
Multi-Value Selections
Enable multi-value selection for variables, allowing users to select multiple jobs or instances. This is particularly useful when you want to aggregate or compare data across multiple systems.
Optimizing Variable Performance in Grafana
Optimizing variable performance is essential for creating responsive and efficient dashboards, especially in large-scale or complex environments. Here are strategies to ensure better performance for Grafana variables:
Enable variable caching in Grafana settings
Enabling caching for variables in Grafana settings helps reduce repeated queries. Cached variables store their results temporarily, which cuts down on the need to re-fetch data every time a dashboard loads, improving speed and responsiveness.
Use the
regexparameter to filter resultsUse the
regexparameter to retrieve only the data you need, filtering out unnecessary results. By applying regex filters like/^prod-/, you can limit variables to production-specific data, which lightens the load and makes queries more efficient.Limit the number of values in multi-value selections
Multi-value variables are helpful but can slow dashboards when large numbers of selections are made. Restricting the number of selections with a cap or default values prevents excessive data from being queried at once, keeping performance steady.
Use specific metrics instead of high-cardinality ones
High-cardinality metrics (those with many unique label combinations) are resource-intensive. To optimize, use metrics with lower cardinality whenever possible, especially for variables. Aggregated metrics, for instance, can provide valuable insights without the overhead of querying every unique label combination.
Monitoring Variable Performance with SigNoz
When using Grafana to visualize and explore data from Prometheus, keeping dashboards responsive is essential, especially in dynamic environments where variables are used extensively. However, as dashboards grow more complex, so do the demands on performance, which can make it challenging to pinpoint and optimize slow queries or overloaded dashboards.
Here’s where SigNoz comes in as a powerful alternative, offering deeper observability and detailed performance insights that go beyond what Grafana natively provides.
Why SigNoz is a Better Alternative for Monitoring Dashboard Performance
While Grafana excels at data visualization, it lacks dedicated tools for monitoring query performance and impact. SigNoz, an open-source observability tool, fills this gap by providing deeper insights into query load, response times, and optimization opportunities.
Here’s how SigNoz enhances monitoring:
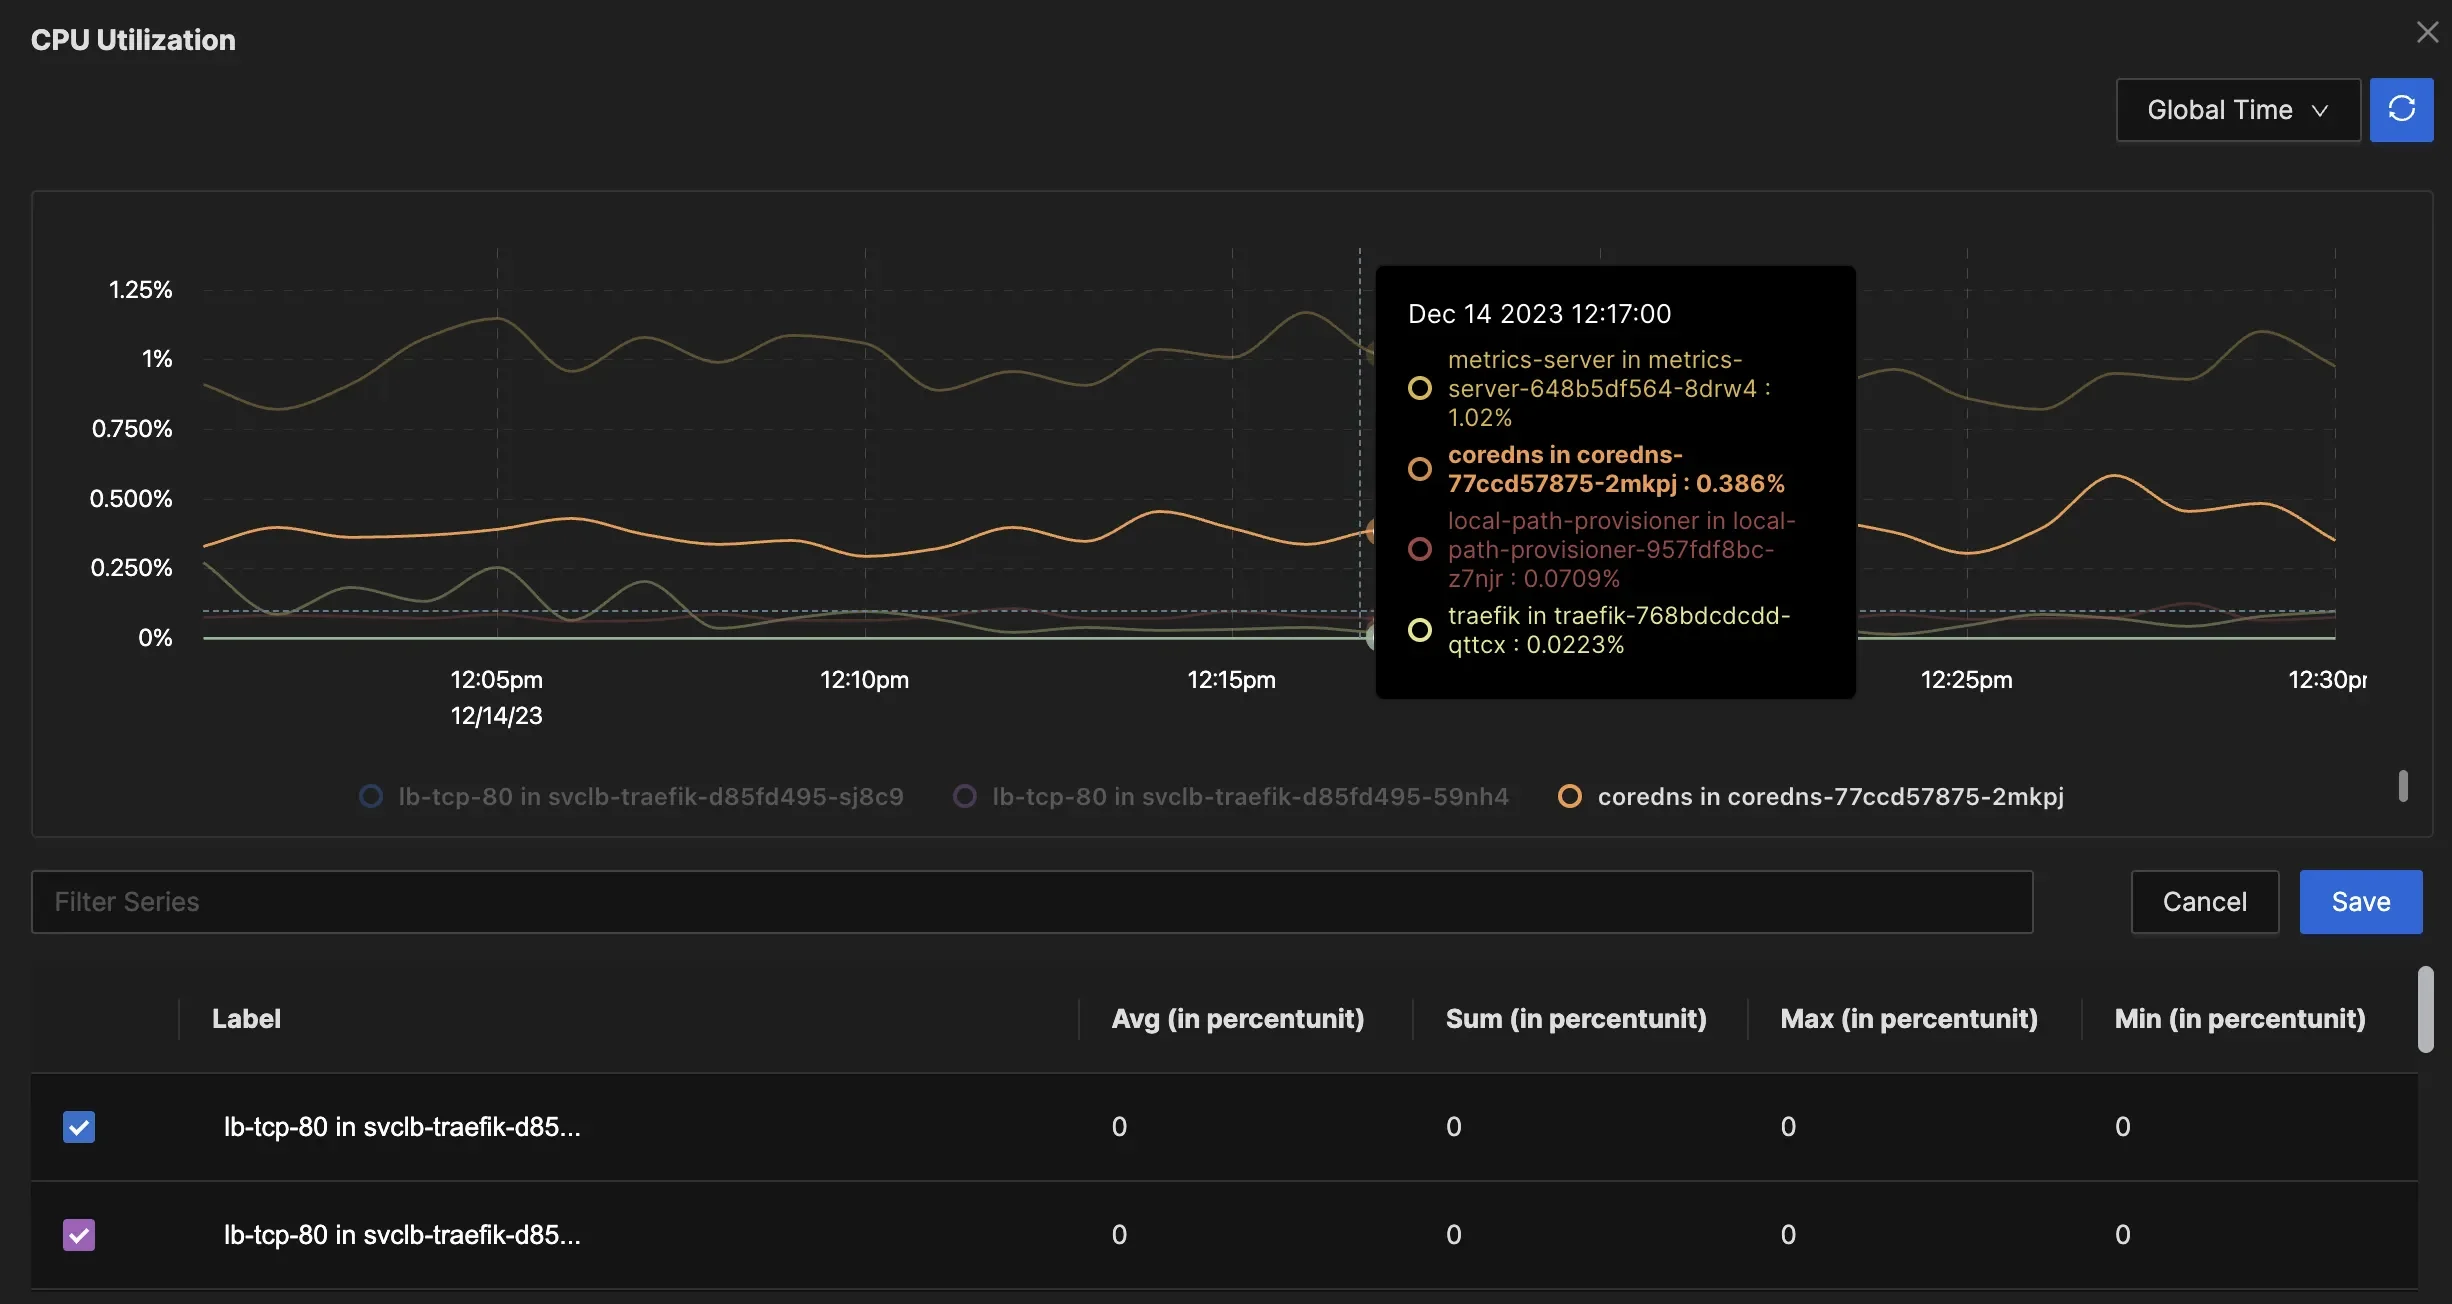
Unified Observability: SigNoz integrates metrics, traces, and logs, providing a comprehensive view of application health that simplifies troubleshooting.
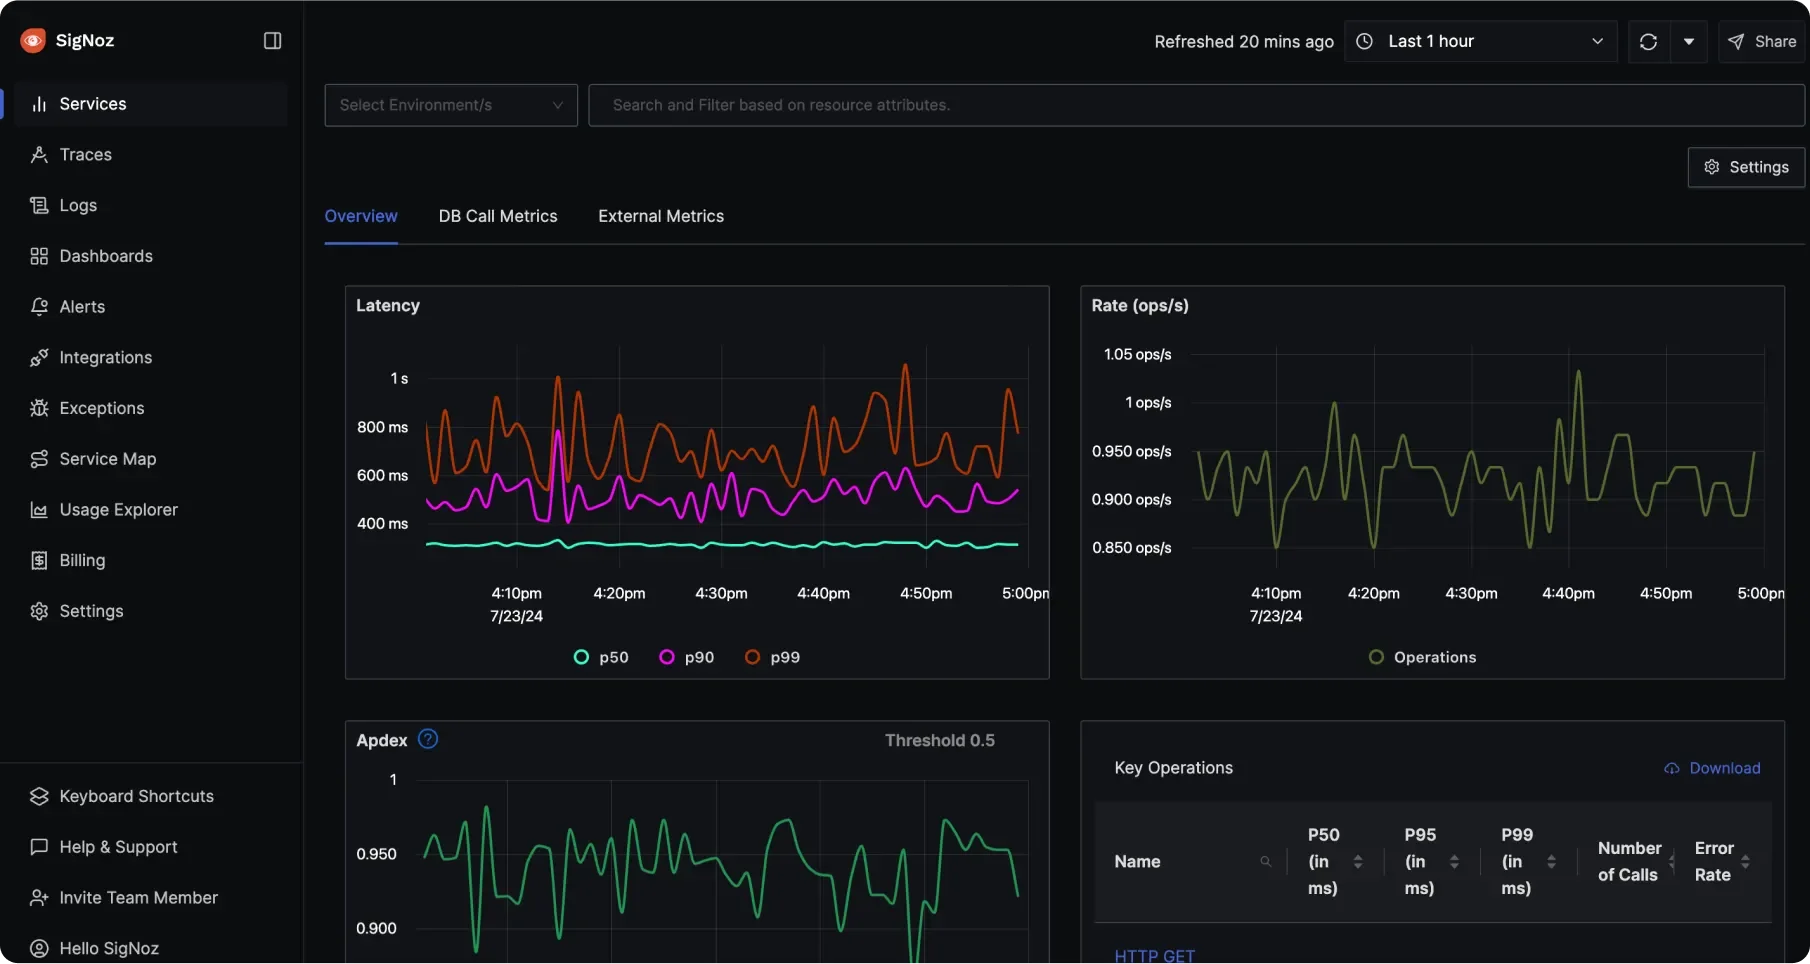
Unified Observability Real-time Performance Monitoring: Unlike Grafana, which focuses on historical data, SigNoz enables real-time analysis of application performance, helping identify bottlenecks and issues as they occur.
Real-time Performance Monitoring Cost-Effective and Simplified Setup: As an open-source solution, SigNoz offers a cost-effective alternative to paid services. Its built-in support for OpenTelemetry simplifies the setup process, allowing developers to start monitoring quickly without extensive configuration.
SigNoz enables proactive dashboard optimization, ensuring a responsive and efficient observability stack.
SigNoz Cloud is the easiest way to run SigNoz. Sign up for a free account and get 30 days of unlimited access to all features.
You can also install and self-host SigNoz yourself since it is open-source. With 24,000+ GitHub stars, open-source SigNoz is loved by developers. Find the instructions to self-host SigNoz.
Key Takeaways
- Chained variables make your dashboards flexible and interactive.
- Proper variable syntax and naming conventions are essential for clear, reliable queries.
- Optimize your queries by managing refresh patterns and reducing query load on Prometheus.
- Regularly monitor dashboard performance to keep variable-based queries efficient.
FAQs
How do I troubleshoot variable reference errors?
Errors often stem from syntax issues or missing references. Ensure that primary variables are always populated before dependent ones, and wrap variable names in ${variable_name} syntax to avoid ambiguity.
Can I use regex filters with chained variables?
Yes, regex filters can be applied within variable queries to dynamically filter options based on patterns. This is helpful when working with varied labels or data sources.
What's the performance impact of multiple chained variables?
If overused, chained variables can impact Grafana’s performance by increasing the query load on Prometheus. Monitoring and optimizing refresh patterns will help maintain performance. Try switching to alternatives like SigNoz which can help in reducing performance issues.
How do I implement cascading dropdowns in Grafana?
Create sequential variables where each depends on the previous selection. Use the label_values function with filters based on parent variables.
