How to Set Up a Custom Dashboard on Grafana's Home Page
Grafana stands as a powerful open-source platform for monitoring and observability, offering robust data visualization capabilities. One of its most valuable features is the ability to customize dashboards to suit your needs. For users who frequently revisit Grafana, having a custom dashboard set as the home page can streamline workflows and improve efficiency. This guide will walk you through the process of setting up a custom home dashboard in Grafana, from basic steps to advanced customization, along with tips for creating effective dashboards and leveraging SigNoz for enhanced monitoring.
Understanding Grafana's Home Dashboard
Grafana is primarily used for monitoring data from various sources, providing users with visual insights into their systems' performance. It integrates with a wide range of data sources, including Prometheus, MySQL, Elasticsearch, and many more, making it highly versatile for monitoring and visualization.
Its home dashboard acts as the landing page when you access your Grafana instance. By default, Grafana displays a generic home dashboard, but customizing this page can significantly enhance your user experience and productivity.
A well-designed home dashboard offers several benefits:
- Instant visibility of crucial metrics
- Quicker access to frequently used data
- Improved team collaboration through shared views
- Streamlined navigation for common monitoring tasks
Prerequisites for Setting Up a Custom Home Dashboard
Before you begin customizing your Grafana home page, ensure you meet the following requirements:
- Appropriate permissions: You need Admin or Editor role access in Grafana.
- Familiarity with Grafana: Basic knowledge of Grafana's interface and navigation is essential.
- Prepared dashboard: Create or identify the dashboard you want to set as your home page.
- Grafana version: Verify your Grafana version, as the process might vary slightly between versions.
Step-by-Step Guide to Change Grafana's Home Dashboard
Follow these steps to set a custom dashboard as your Grafana home page:
Log in to Grafana: Begin by logging into Grafana with credentials that have the necessary permissions (Admin or Editor role).
Navigate to the desired dashboard: Locate the dashboard you want to set as your home page.

Navigate to the desired dashboard Star the dashboard: To ensure the dashboard is marked as important, click the star icon located in the top-right corner of the dashboard. Starring a dashboard will make it appear in your list of favorites, and it’s also a best practice when managing multiple dashboards.

Star the dashboard Access Default preferences:
- Click on the Administration(gear) icon in the left sidebar.
- Select "Default Preferences" under the "General" section.
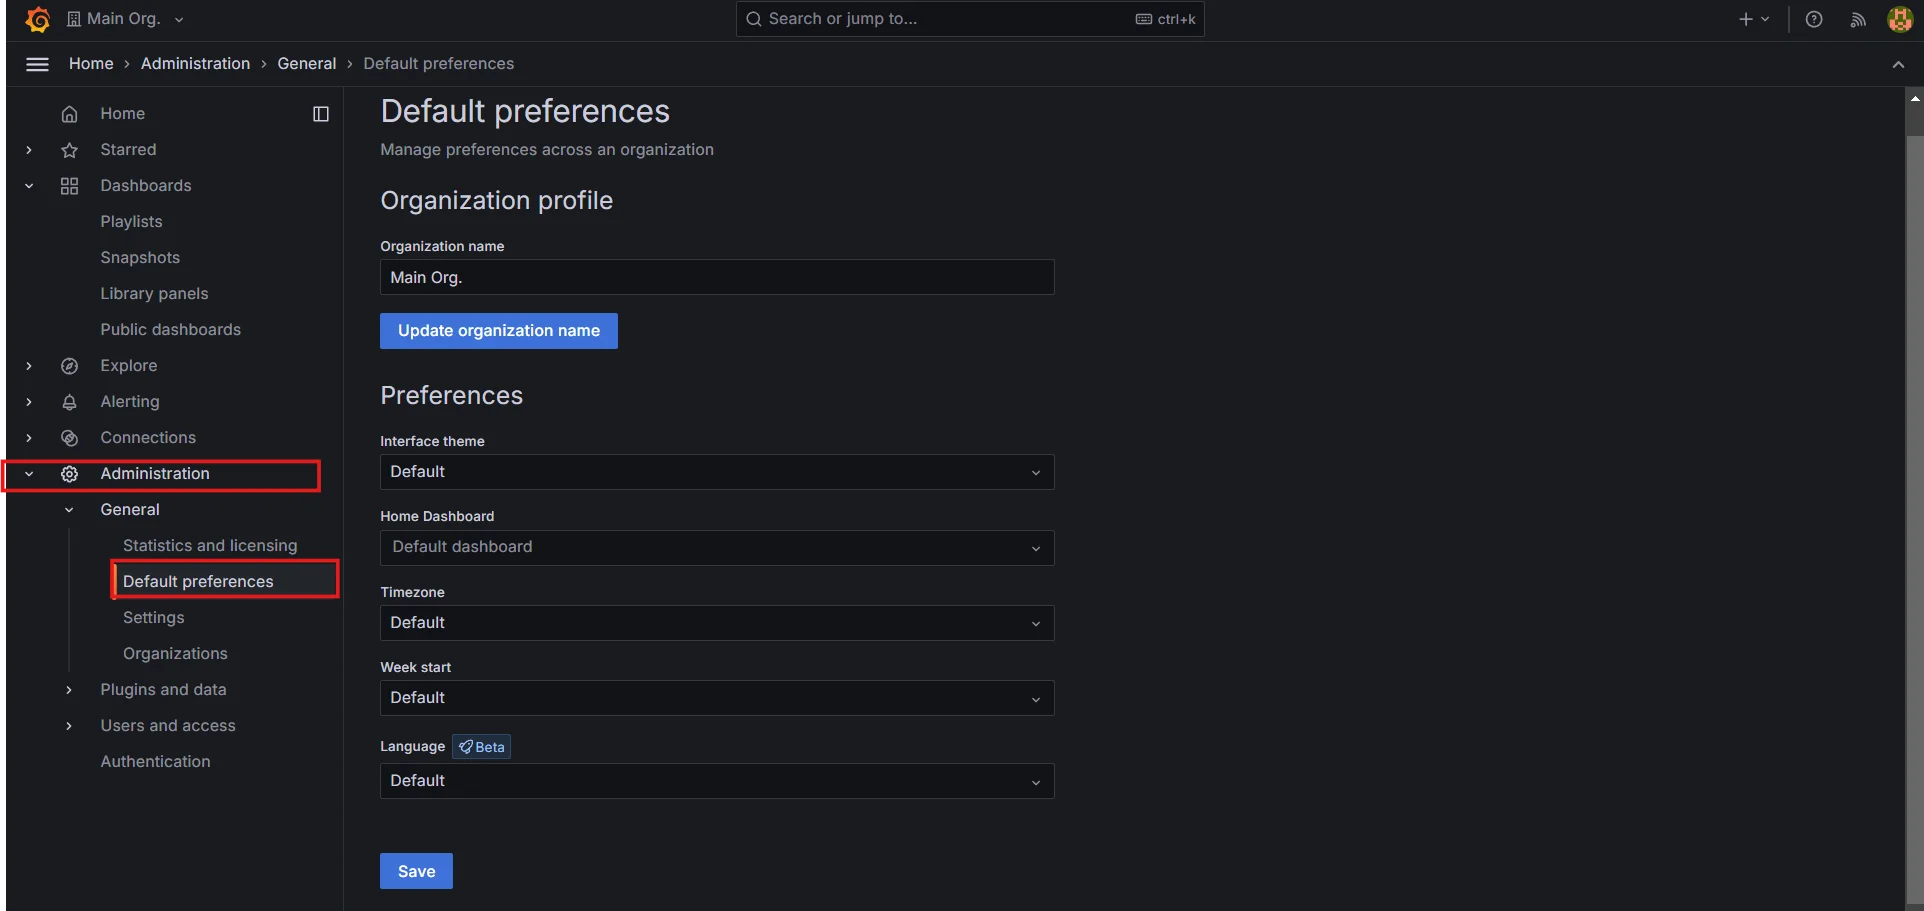
Access Default preferences Set the new home dashboard:
- In the "Home Dashboard" dropdown, select your starred dashboard.
- Click "Save" to apply the changes.
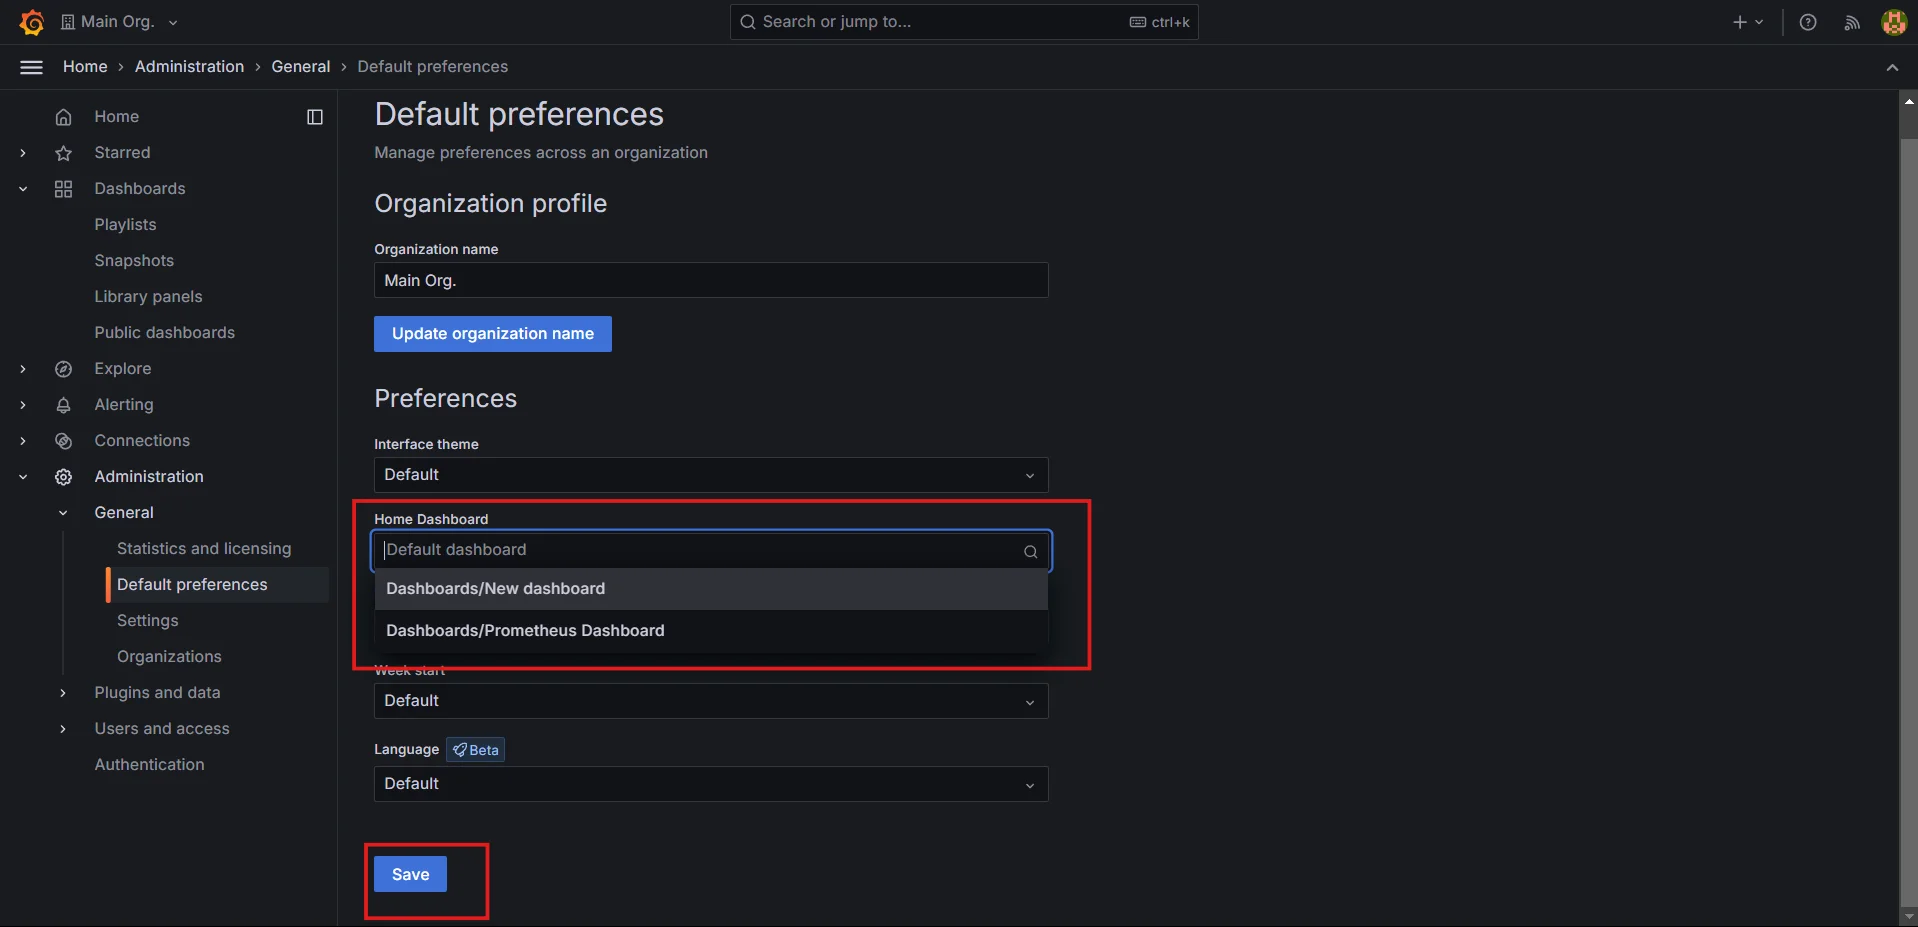
Set the new home dashboard
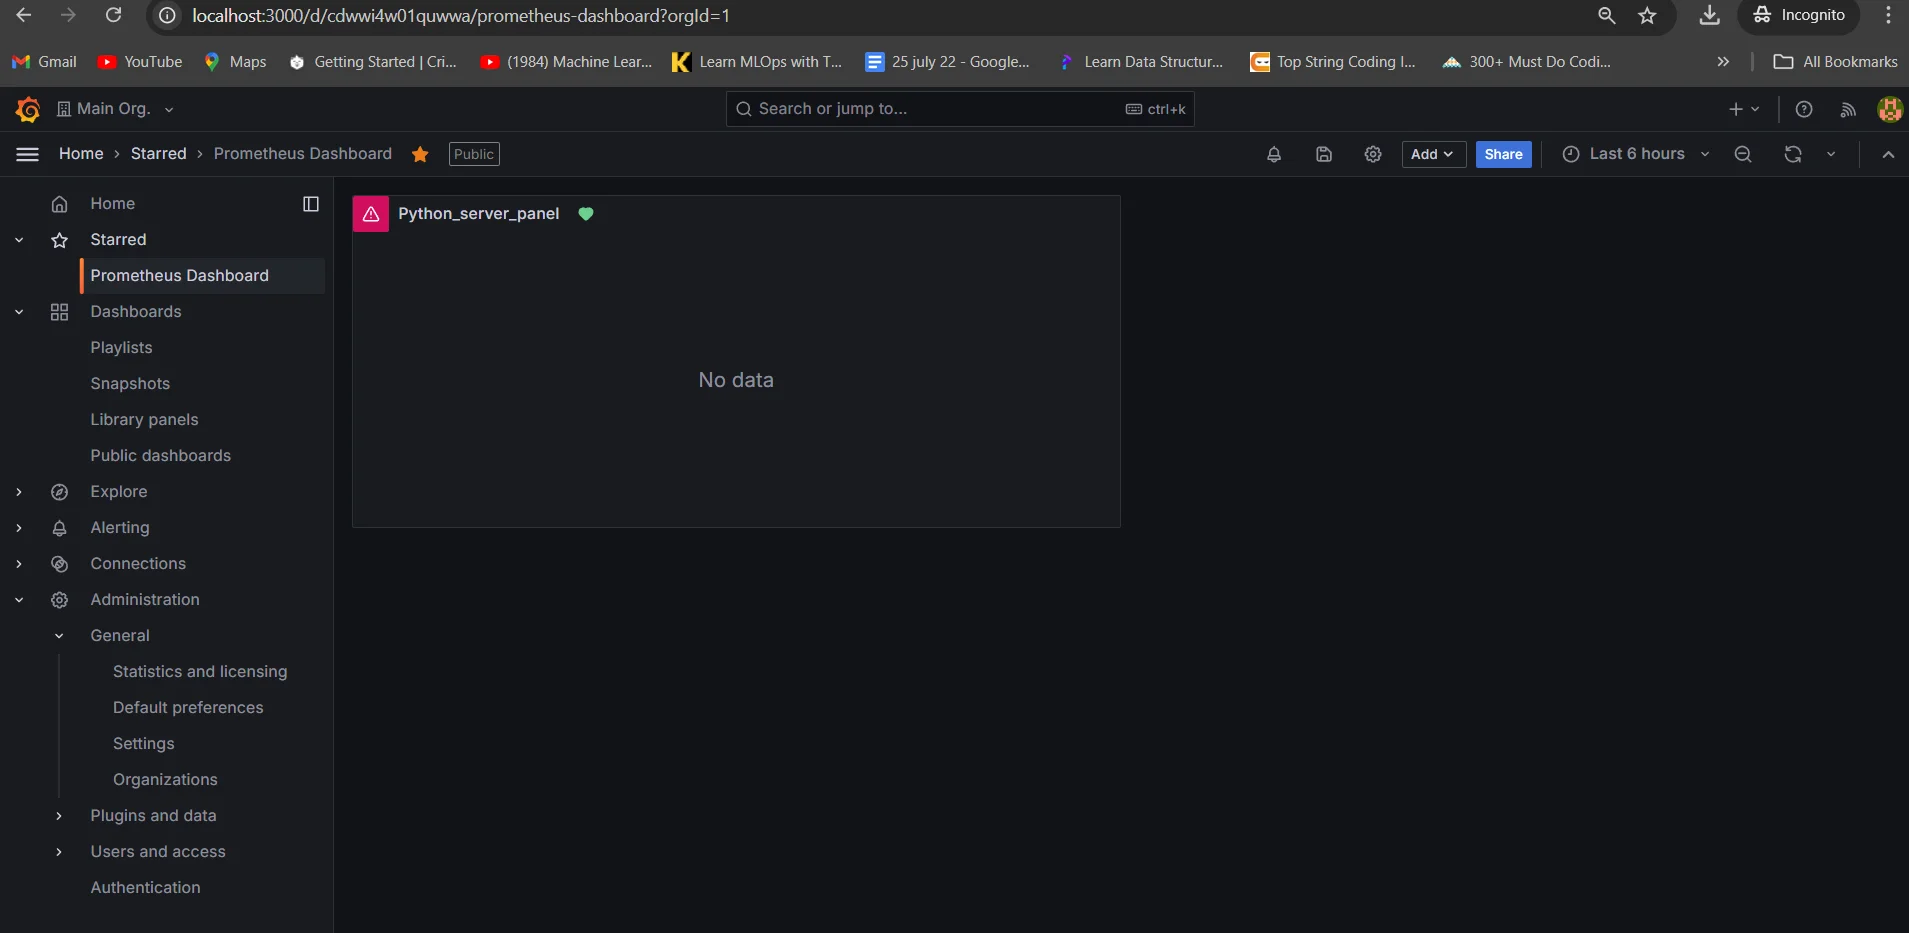
Your selected dashboard will now appear as the home page when you access Grafana.
Troubleshooting Common Issues
If you encounter problems while setting up your custom home dashboard, consider these solutions:
- Unable to save changes: Verify your user permissions and ensure you're logged in with the correct account.
- New dashboard not appearing in the select box: Confirm that you've starred the dashboard and refresh the page.
- Changes not taking effect immediately: Clear your browser cache or try accessing Grafana in an incognito window.
- Permissions-related problems: Check with your Grafana administrator to ensure you have the necessary rights to modify organization preferences.
Advanced Customization Options
To further enhance your Grafana experience, consider these advanced customization techniques:
Create a custom welcome dashboard: Design a dashboard specifically for new users or team members, including links to important resources and key metrics.
Incorporate multiple data sources: Grafana supports multiple data sources in one dashboard. By integrating data from Prometheus, Elasticsearch, or InfluxDB, you can create a comprehensive home dashboard that offers a holistic view of your system’s performance.
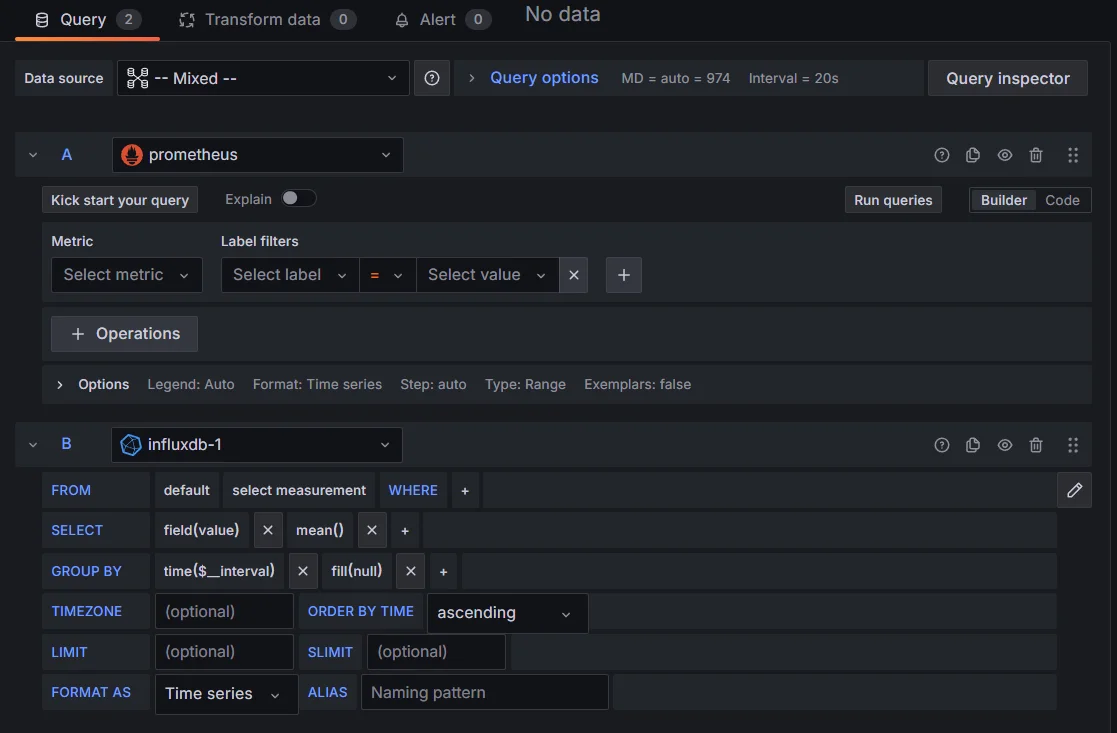
Creating panels using multiple data sources Use variables and templating: Implement dynamic content that adapts based on user selections or time ranges.
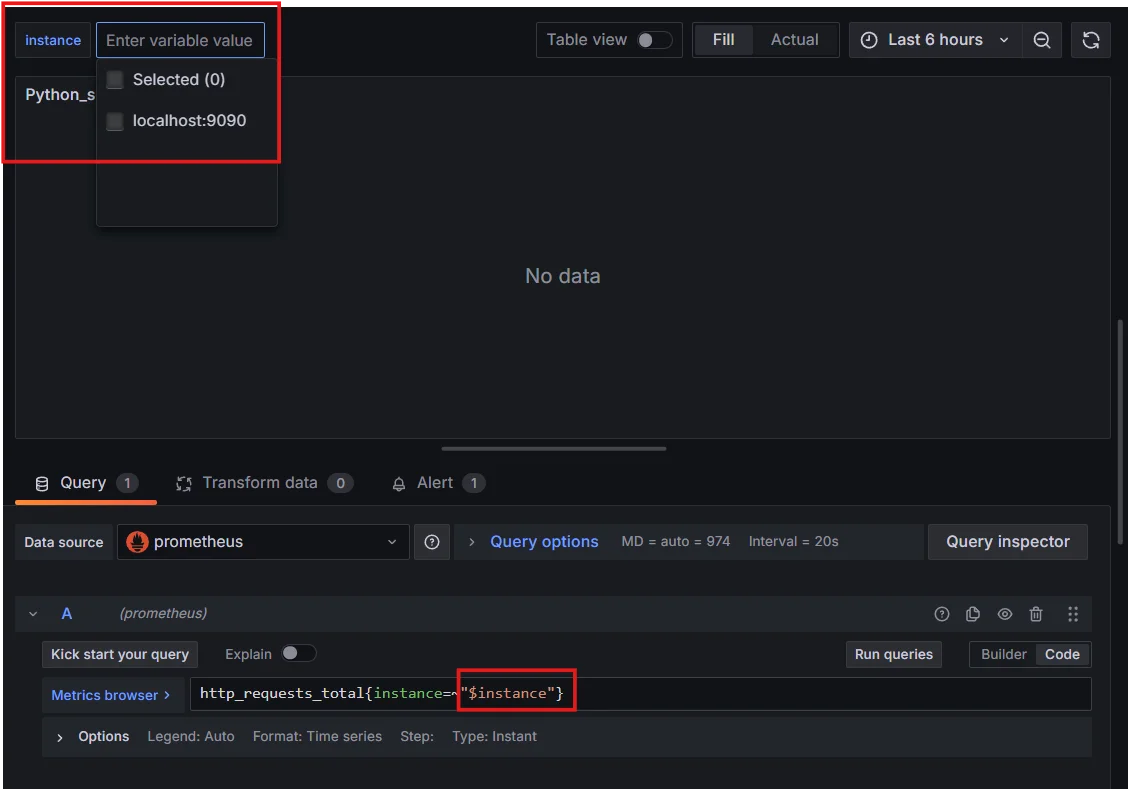
Using Variables Implement role-based home dashboards: Set different home dashboards for various user groups based on their roles and responsibilities.
Best Practices for Designing an Effective Home Dashboard
To maximize the impact of your custom home dashboard, follow these design principles:
- Keep it simple and focused: Highlight only the most critical metrics to avoid information overload.
- Use appropriate visualizations: Choose the right chart types for different data sets — use line graphs for time series data, pie charts for proportions, and gauges for single-value metrics.
- Ensure proper labeling: Clearly label all panels and include units of measurement where applicable.
- Implement consistent styling: Use a cohesive color scheme and layout to improve readability and aesthetics.
- Organize logically: Group related metrics together and arrange panels in a logical flow.
Leveraging SigNoz for Enhanced Dashboard Monitoring
While Grafana is widely used for monitoring and visualization, SigNoz offers a powerful alternative that goes beyond metrics, incorporating features for end-to-end observability with minimal setup. If you're looking for an all-in-one open-source platform that can handle more than just dashboards, SigNoz could be a better choice for monitoring, tracing, and logging in your systems.
What is SigNoz?
SigNoz is an open-source observability platform designed for monitoring and troubleshooting microservices-based applications. Unlike Grafana, which primarily focuses on metrics and visualization, SigNoz provides a complete observability solution, including distributed tracing, metrics, and logging—all in a single interface. It leverages OpenTelemetry standards, making it easy to integrate with modern cloud-native applications.
Why Choose SigNoz Over Grafana?
Here are some common reasons you may consider SigNoz over Grafana:
Unified Observability: SigNoz provides a one-stop solution for logs, metrics, and traces, whereas Grafana typically focuses on metrics and visualizations. With SigNoz, you don’t need multiple tools to monitor different aspects of your application.
Distributed Tracing: One of SigNoz’s key strengths is its built-in support for distributed tracing. This makes it easier to track the performance of microservices and pinpoint issues within your system, an area where Grafana relies on external tools like Jaeger.
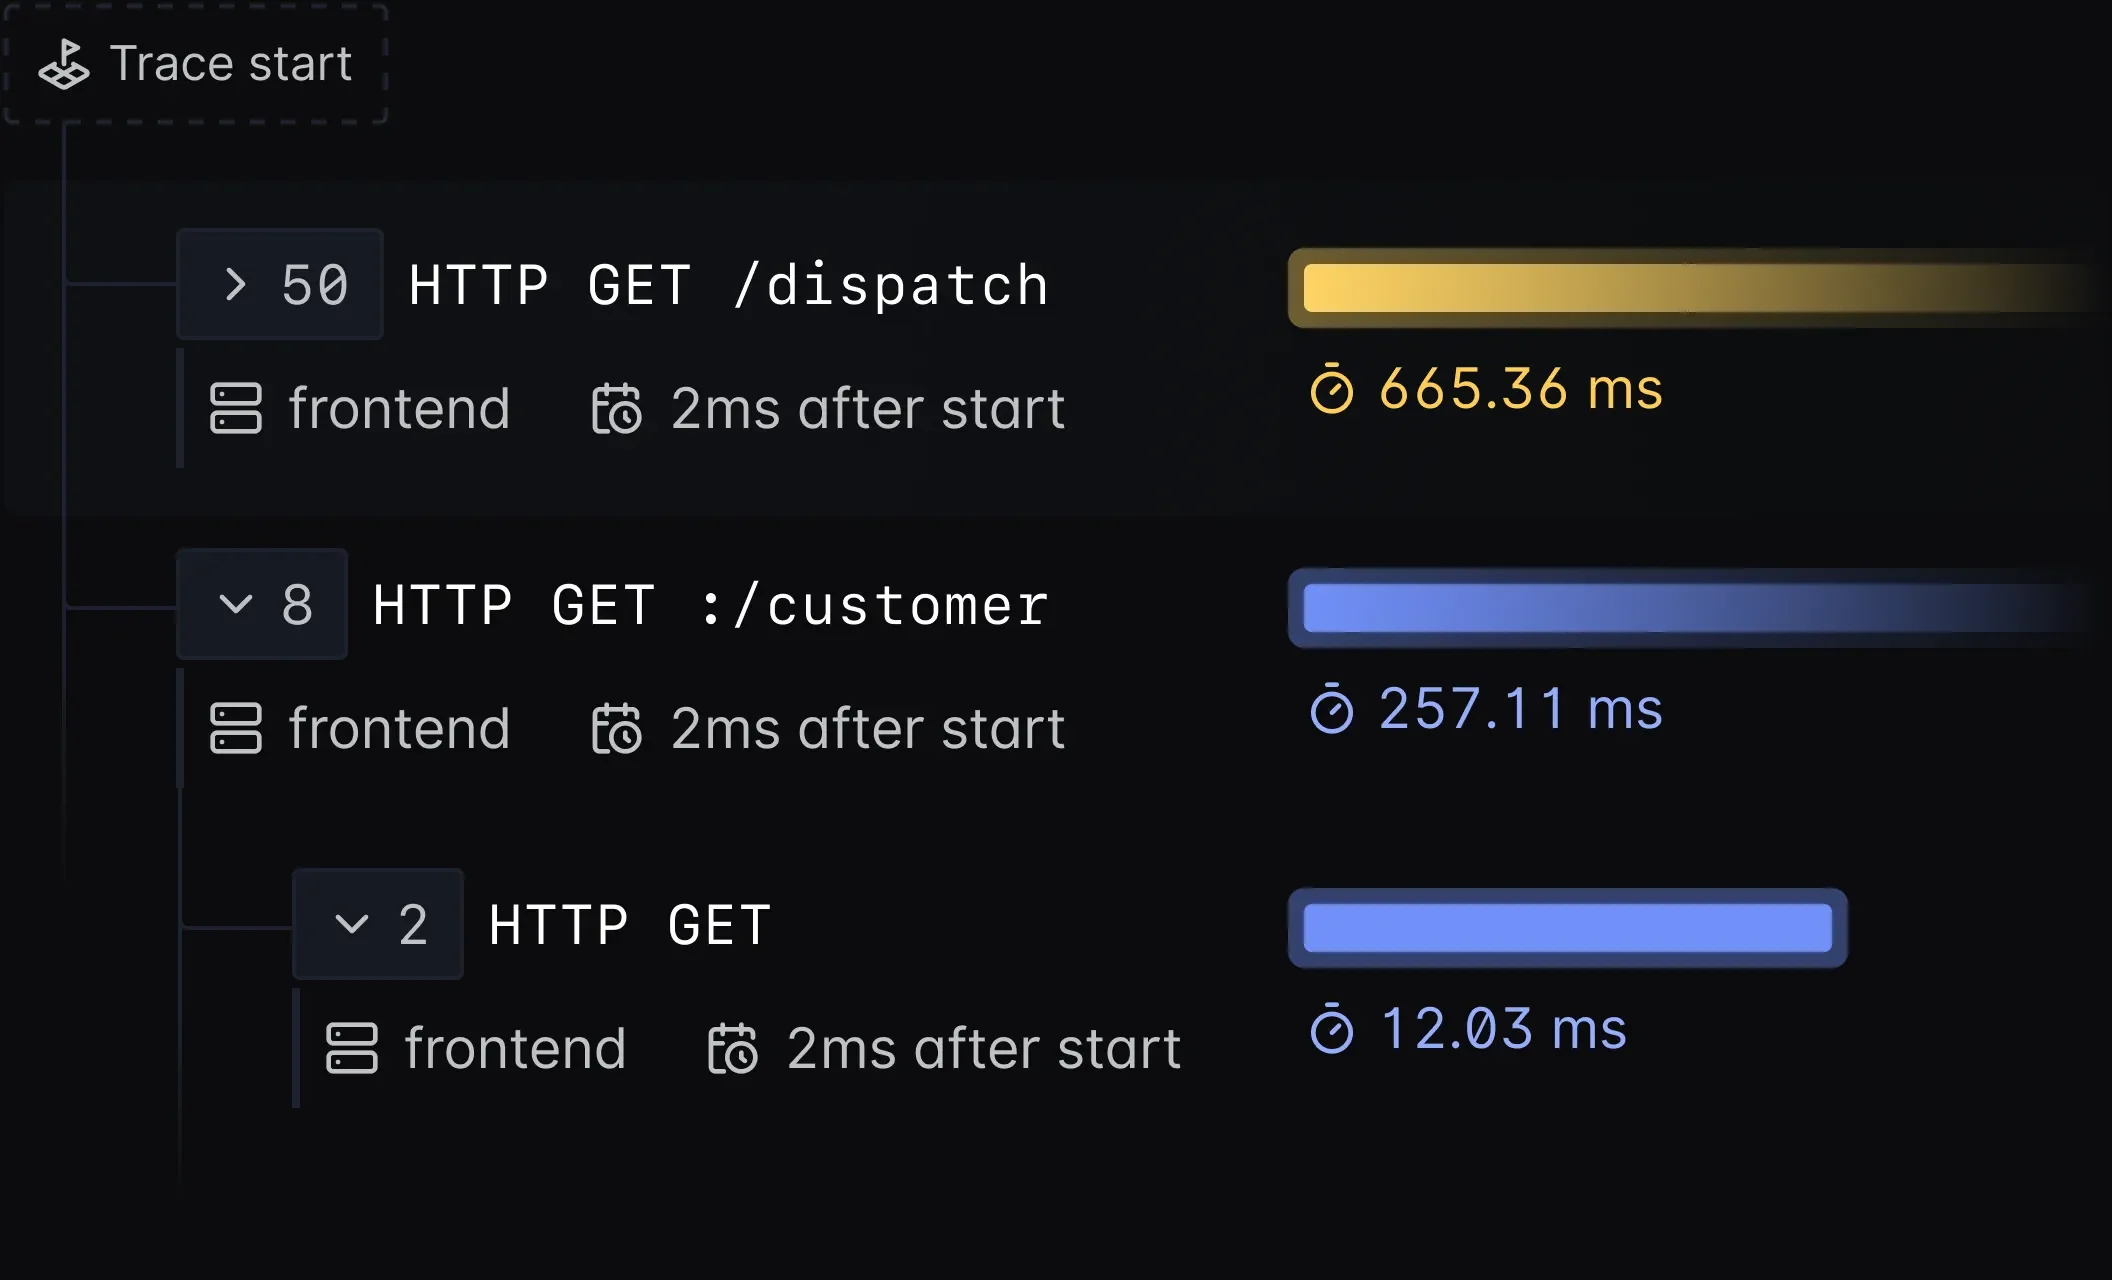
Distributed Tracing in SigNoz Simple Setup: SigNoz is easy to set up with built-in capabilities for observability, whereas Grafana often requires additional tools or services like Loki for logs and Tempo for tracing.
Integrated Dashboards: With SigNoz, you get an integrated dashboard that handles metrics, logs, and traces together, avoiding the need for configuring multiple data sources and integrations.
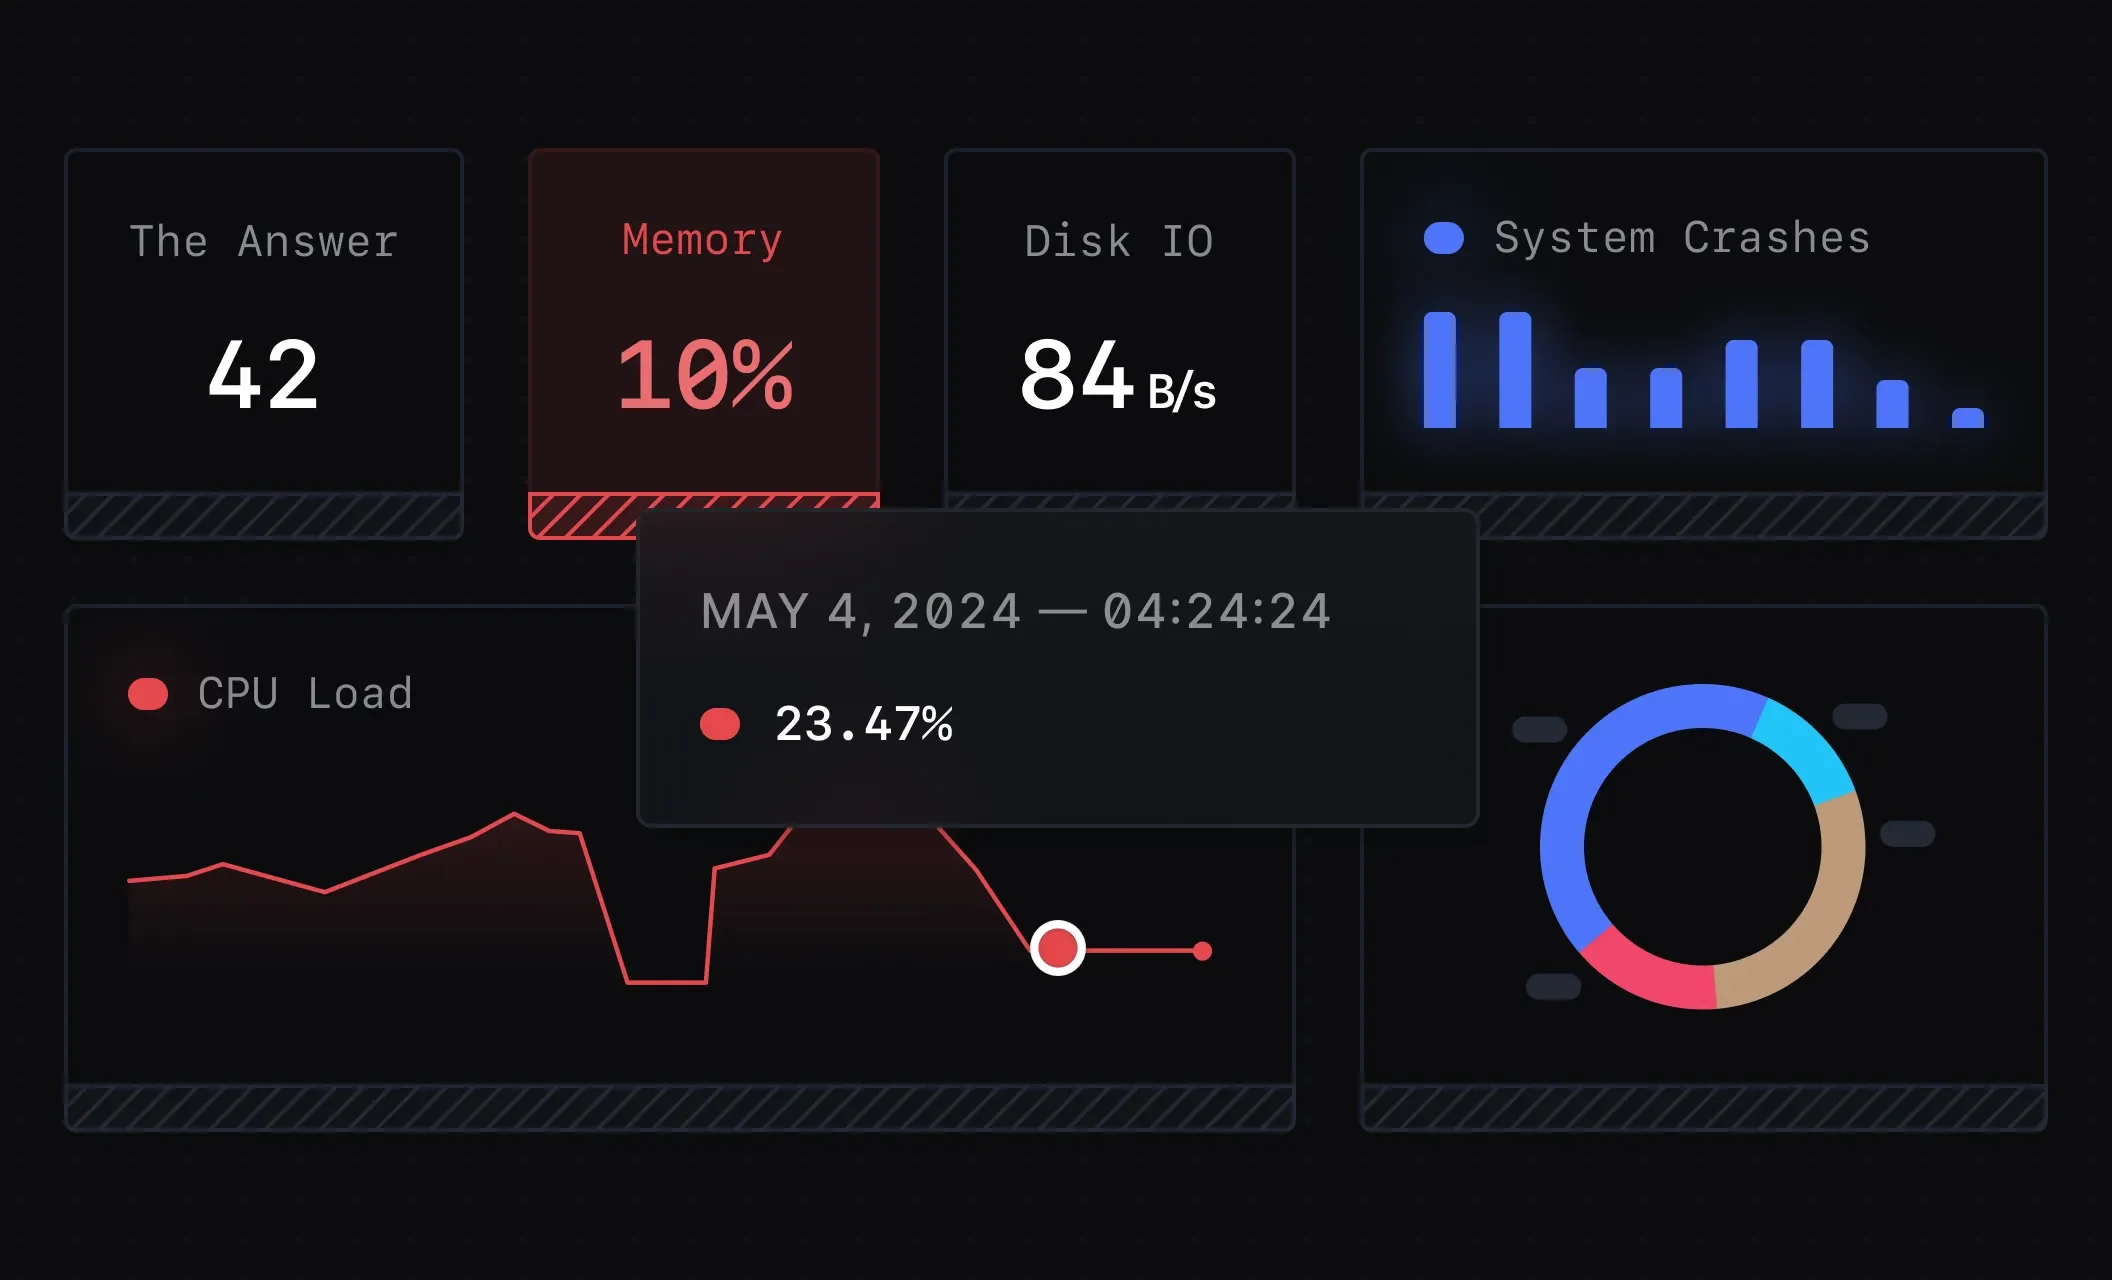
Integrated Dashboards in SigNoz
SigNoz Cloud is the easiest way to run SigNoz. Sign up for a free account and get 30 days of unlimited access to all features.
You can also install and self-host SigNoz yourself since it is open-source. With 24,000+ GitHub stars, open-source SigNoz is loved by developers. Find the instructions to self-host SigNoz.
By combining Grafana's visualization prowess with SigNoz's comprehensive monitoring capabilities, you create a powerful observability solution that provides deep insights into your system's performance.
Key Takeaways
- Customizing Grafana's home dashboard enhances user experience and monitoring efficiency.
- Proper permissions and familiarity with Grafana's interface are crucial for successful customization.
- The process involves selecting a dashboard, starring it, and updating organization preferences.
- Advanced customization techniques can provide tailored experiences for different user roles.
- Adhering to design best practices ensures an effective and informative home dashboard.
- Integrating tools like SigNoz can complement Grafana's capabilities for comprehensive monitoring.
FAQs
Can I set different home dashboards for different users?
Yes, Grafana allows setting different home dashboards based on user roles or teams. This feature requires proper configuration of user permissions and organization preferences.
How often should I update my Grafana home dashboard?
Update frequency depends on your monitoring needs. Review and adjust your home dashboard regularly — monthly or quarterly — to ensure it reflects current priorities and includes the most relevant metrics.
Is it possible to revert to the default home dashboard?
Yes, you can revert to the default home dashboard by selecting "Default" in the Home Dashboard dropdown within the Organization preferences settings.
Can I use a dashboard from a different Grafana organization as my home dashboard?
No, you can only set a dashboard from the current organization as your home dashboard. If you need a dashboard from another organization, consider copying it to your current organization first.
