How to Query Data by Time Period - A Step-by-Step Guide
Time-based querying is a powerful approach to monitoring and analyzing data trends over time, especially in real-time data platforms like Grafana. This guide will walk you through essential steps, from understanding time-based queries to building advanced time-based visualizations for insights in Grafana.
Understanding Time-Based Queries in Grafana with Prometheus
Time-based queries are essential in Grafana, particularly when paired with Prometheus as a data source, to filter, aggregate, and visualize metrics over specific time intervals. This approach is invaluable for real-time monitoring, historical analysis, and comparative insights, making it easier to spot trends, spikes, or anomalies in data.
With Grafana and Prometheus, you can dynamically query time-series data from your systems, displaying live metrics like CPU usage, memory consumption, or request rates in a visually meaningful way. Key use cases for these queries include:
- Real-Time Monitoring: Continuously visualize current metrics such as resource usage or error rates to catch issues as they arise.
- Historical Analysis: Track data over longer periods, like weeks or months, to identify trends and seasonal patterns.
- Comparative Analysis: Examine metrics across different time frames (e.g., this week vs. last week) to understand performance changes or improvements.
Types of Time Periods: Absolute vs. Relative
In Grafana, you can define time periods in your queries using two main types:
Absolute Time Periods: Absolute periods specify exact start and end times, such as
"2023-01-01T00:00:00"to"2023-12-31T23:59:59". Absolute periods allow you to analyze a fixed timeframe, ideal for detailed reports or historical data snapshots.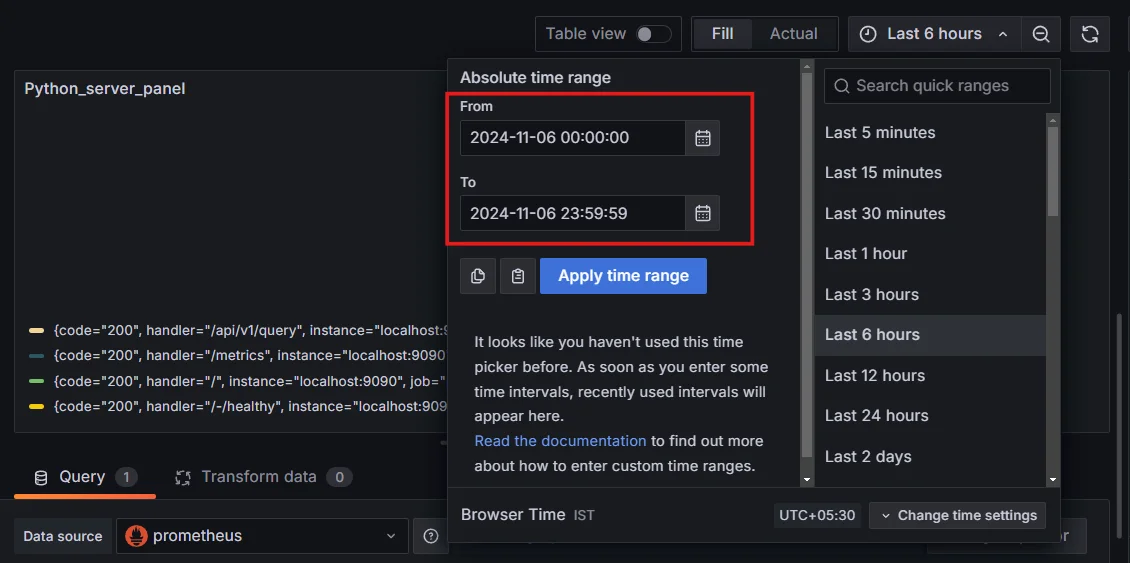
Absolute Time Periods Relative Time Periods: Relative periods use expressions like “last week,”
now-24h(last 24 hours) ornow-7d(last seven days), based on the current time. Relative periods are great for dashboards, as they automatically update to reflect the latest data without manual adjustment.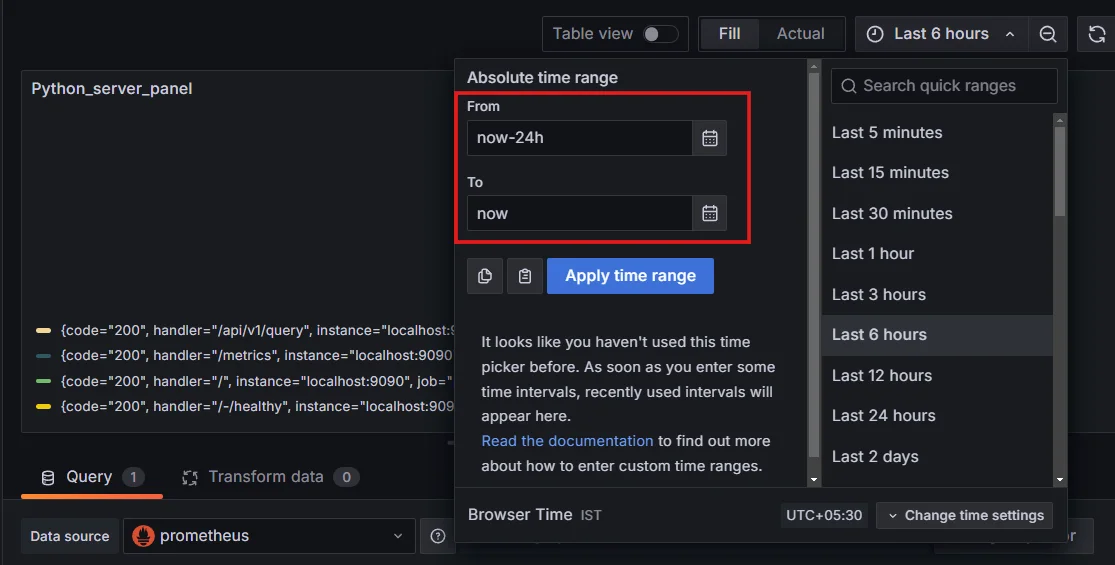
Relative Time Periods
Grafana makes it easy to switch between these periods using its built-in time selector, allowing you to customize your view with just a few clicks.
Key Components of Time-Based Queries in Prometheus for Grafana
To create powerful, flexible queries in Prometheus for Grafana, it’s essential to understand the following components:
- Time Range Filter: Limits data to the desired timeframe (e.g., the last hour or last five minutes) by specifying a
[duration]within Prometheus queries. - Aggregation Functions: Functions such as
sum(),avg(),min(), ormax()aggregate values across the selected time range, transforming raw data into useful summaries. For example,avg()can be used to calculate average CPU usage, whilesum()shows the total request count. - Time Functions: Functions like
rate()andincrease()in Prometheus manipulate time-series data, allowing you to calculate rates or increments over time. These functions are critical for metrics that change constantly, like request rates or error counts. - Grouping or Bucketing: Organizing data by intervals (e.g., 5 minutes, hourly) helps create trends within the selected time period. You can use the
byclause to group data by labels (e.g.,status_code) for insights into specific segments or events.
Example Prometheus Query in Grafana
Here's an example of a Prometheus query in Grafana that visualizes HTTP request trends on an API server over time:
sum(rate(http_requests_total{job="api-server"}[5m])) by (status_code)
This query consists of:
- Time Range Filter:
[5m]— Limits data to the last five minutes, creating a moving window for real-time trends. - Aggregation Function:
sum()— Aggregates the request count by status code. - Time Function:
rate()— Calculates the request rate over the last five minutes, giving insights into traffic patterns. - Grouping:
by (status_code)— Breaks down request counts by HTTP status codes, allowing you to monitor specific response types (e.g., 200 for success, 404 for not found).
This query is ideal for visualizing real-time traffic patterns in Grafana, with each status code showing as a separate line, revealing how frequently different response codes occur over time.
Common Time-Selection Patterns in Prometheus
When using Prometheus in Grafana, you’ll typically see time-selection patterns that help specify how the data is retrieved and displayed. Here are some of the most commonly used patterns:
- Rolling Time Windows: Brackets like
[5m]or[1h]specify the time window for the query. For example,rate(cpu_usage[5m])calculates the CPU usage rate over the last 5 minutes, which adjusts dynamically in real-time. - Absolute Time Selection in Grafana: Set a specific date and time directly within Grafana’s time picker for absolute periods, useful for focused analysis.
- Relative Time Selection: Use Grafana's relative time selector (e.g., "Last 24 hours") to view data that updates based on the current time, ideal for dynamic dashboards.
Essential Time Query Components
Selecting the right time range format is essential for effective time-based querying in Grafana with Prometheus. Here’s a breakdown of commonly used formats:
- Relative Time Expressions: Grafana’s relative time options allow for dynamically changing time ranges based on the current time. For example:
last 24h: Shows the last 24 hours from the current time.past week: Displays data from the last seven days.now-1htonow: Custom expressions likenow-1htonoware also available, letting you fine-tune time ranges based on specific requirements.
- Custom Date-Time Patterns: In Grafana, you can specify custom date ranges in the dashboard’s time range selector, allowing for non-standard intervals that aren’t covered by the default options. For instance, if you need to look at data from
"2023-05-15 09:00"to"2023-05-15 17:00", you can set these manually. - Time Zone Considerations: Grafana allows you to set a time zone per dashboard, ensuring consistent data display for users across different regions. When using Prometheus with Grafana, it’s crucial to confirm that your time zones align to avoid discrepancies, especially if the data originates from geographically dispersed sources.
Step-by-Step Query Construction
Constructing time-based queries in Grafana with Prometheus involves setting up filters, applying functions, and using operators to retrieve data effectively. Here’s how to do it step-by-step:
1. Building Basic Time Range Filters
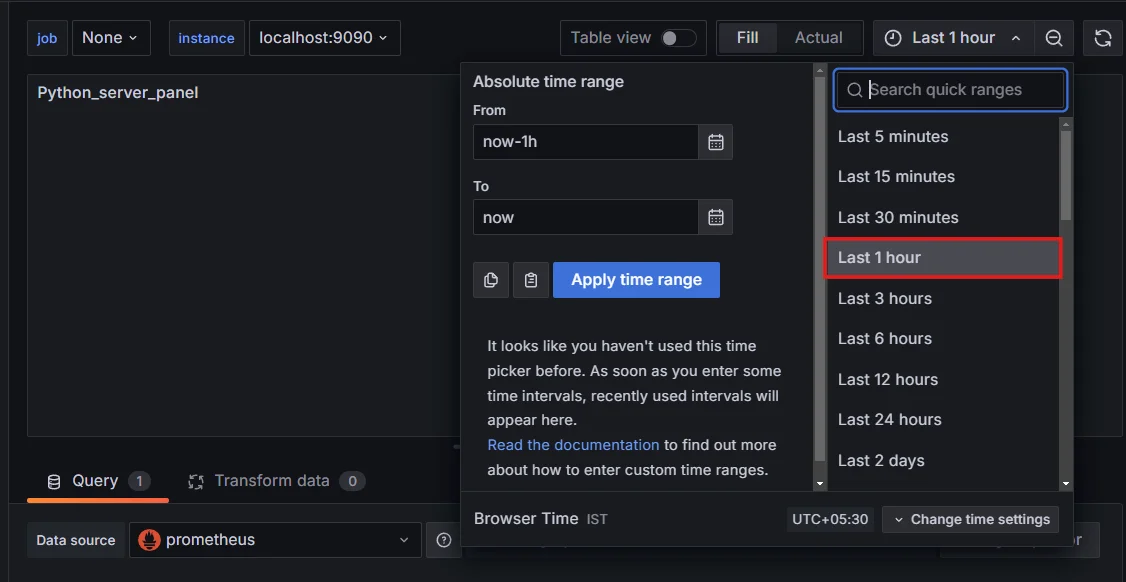
In Grafana, you select the time range for your data from the dashboard’s time picker. Prometheus handles the selected range automatically, filtering results to only include data within that time frame.
Example:
If you select “Last 1 hour” in Grafana, Prometheus applies this range to the data it queries, so metrics will only display values from the last hour.
2. Time Functions
Prometheus’s PromQL provides several time functions and operators that allow for precise control over time ranges and metrics:
rate(): The
rate()function calculates the average per-second rate of increase over a specified time interval. Ideal for metrics like network requests or CPU usage.rate(prometheus_http_requests_total[5m])This query returns the rate of HTTP requests per second over the last five minutes.
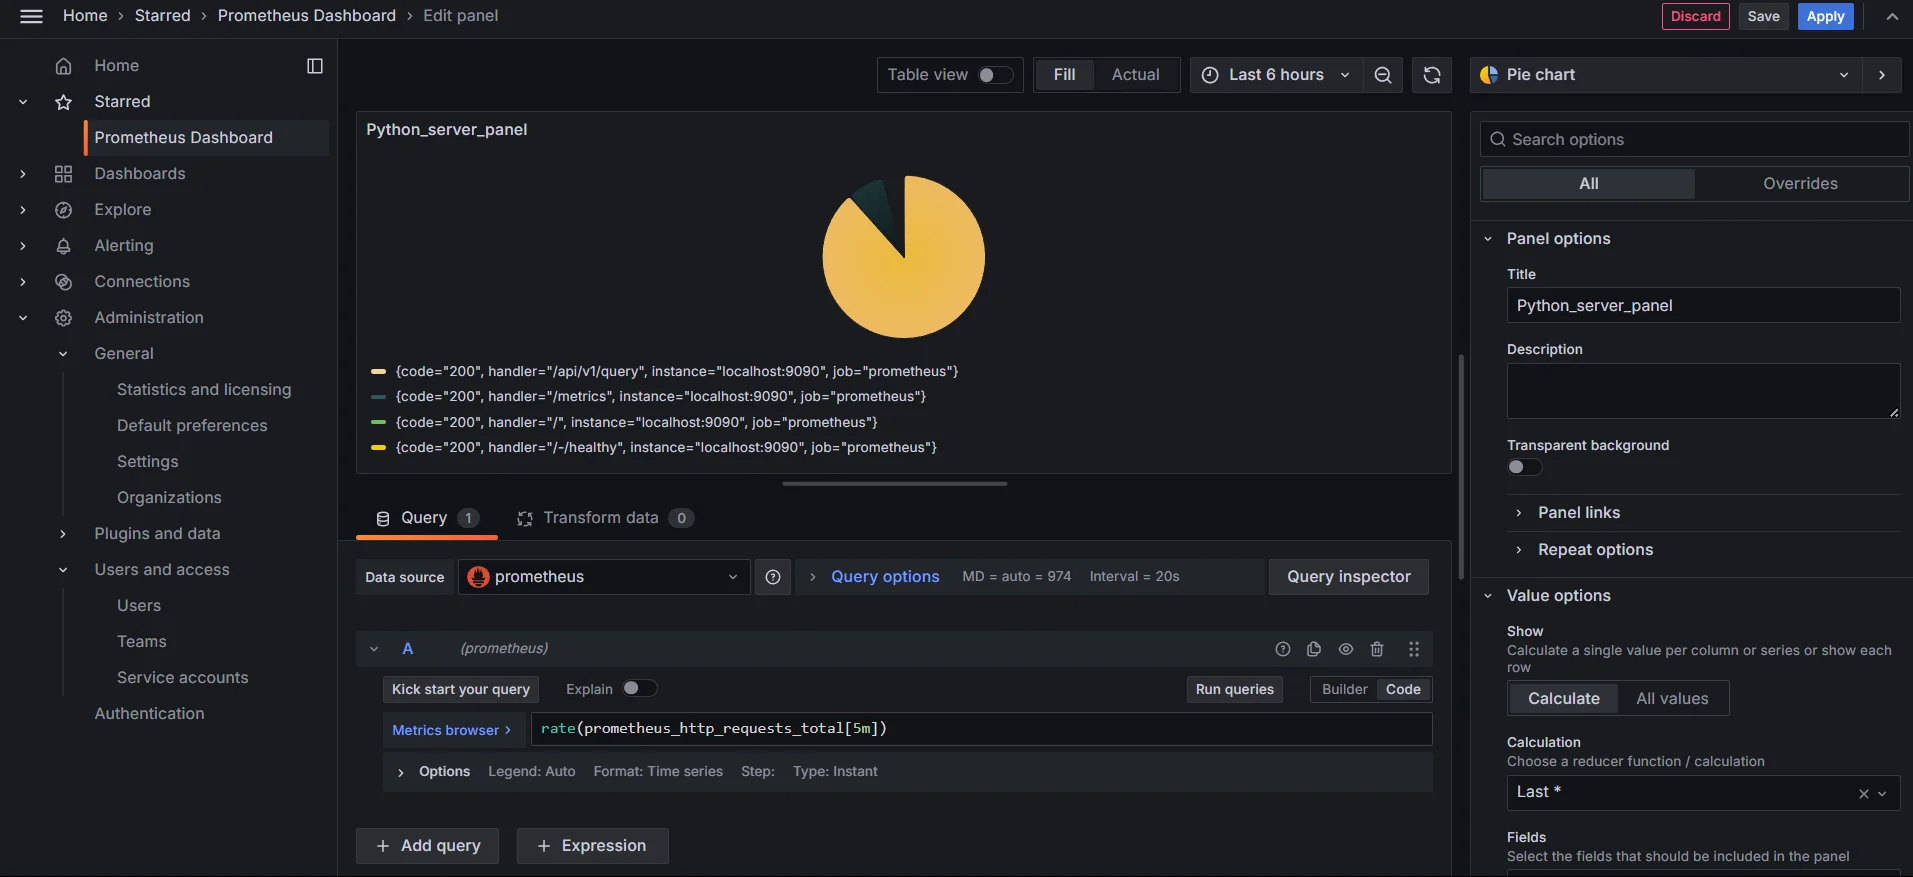
rate() function increase(): Calculates the cumulative increase over a given period, useful for counters.
increase(http_requests_total[1h])Here,
increase()shows the total increase in HTTP requests in the last hour.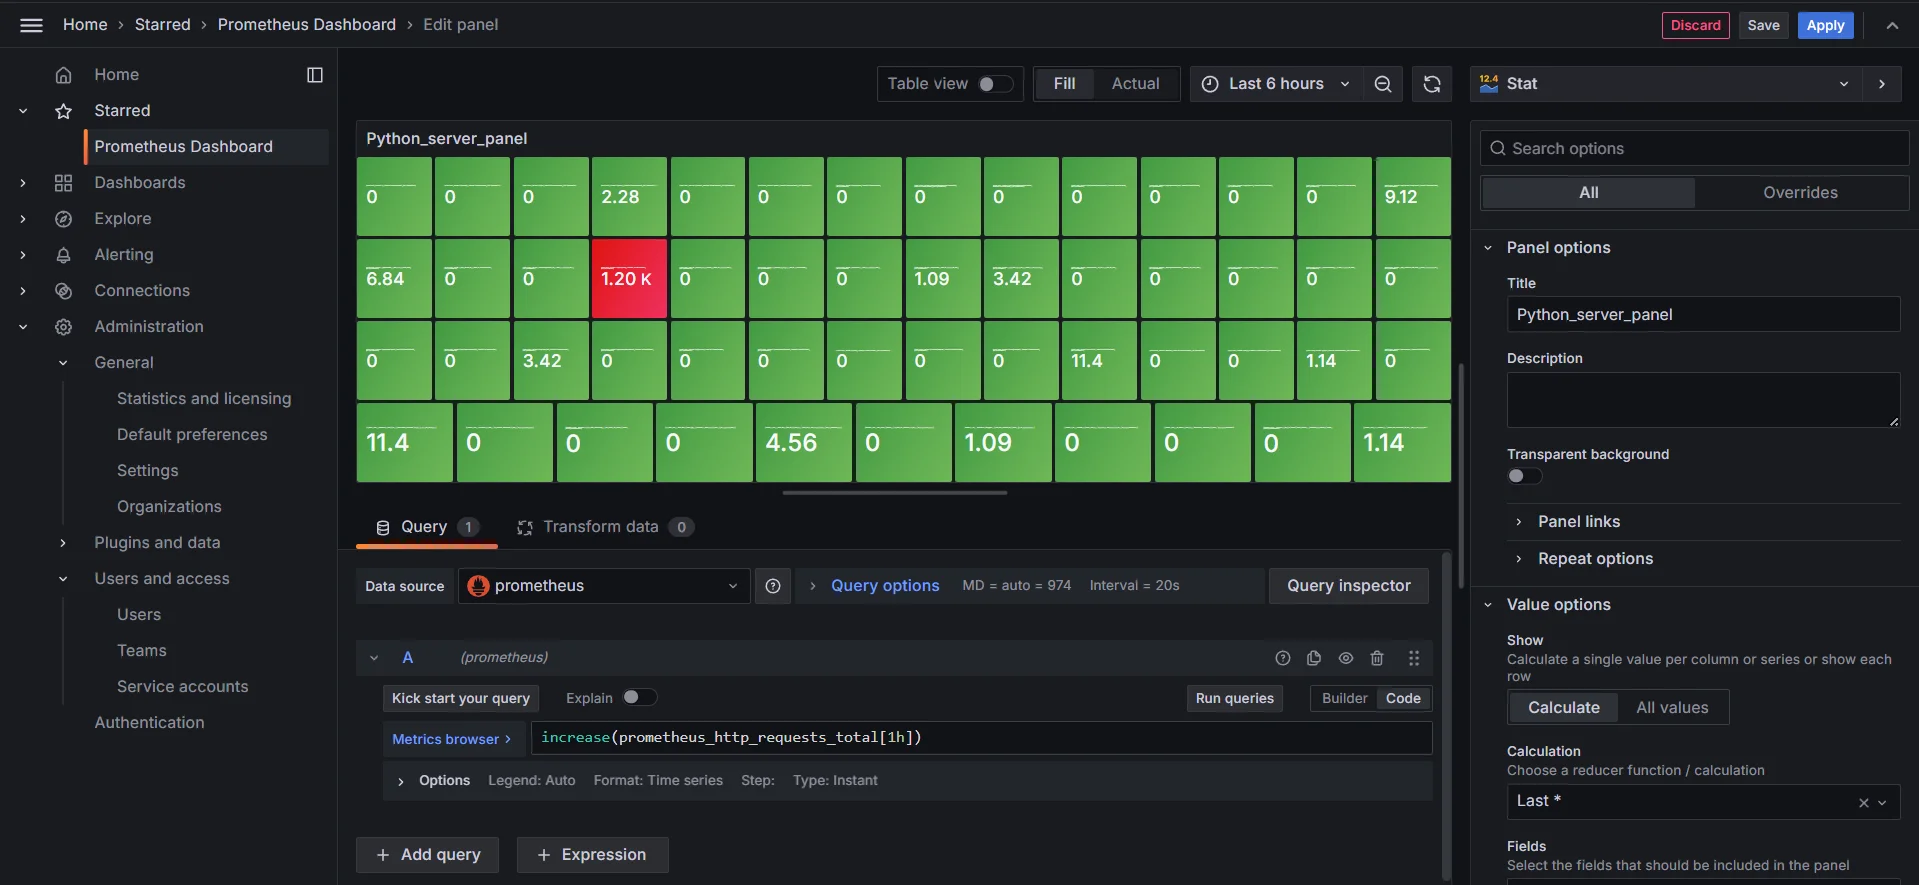
increase() function
3. Time Aggregations
Aggregating data over specific time intervals is essential for meaningful summaries. In PromQL, you can use functions like avg_over_time and sum_over_time for this purpose.
sum_over_time(): Returns the total value over a specified interval, which is useful for aggregating metrics like total bytes transferred.
sum_over_time(prometheus_http_requests_total[1h])This query aggregates HTTP requests in the last hour.
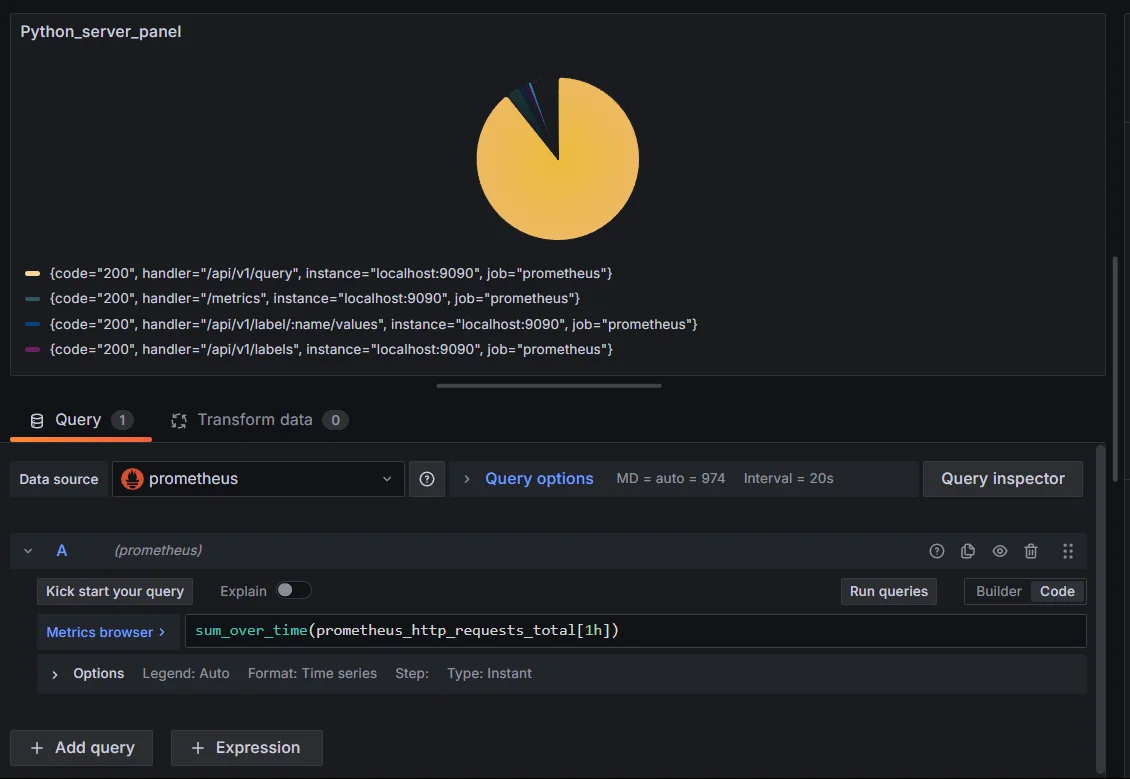
sum_over_time() - Time aggregation avg_over_time(): Calculates the average value over a given interval. For instance:
avg_over_time(prometheus_http_requests_total[1h])This query computes the average HTTP requests received over the last 1 hour.
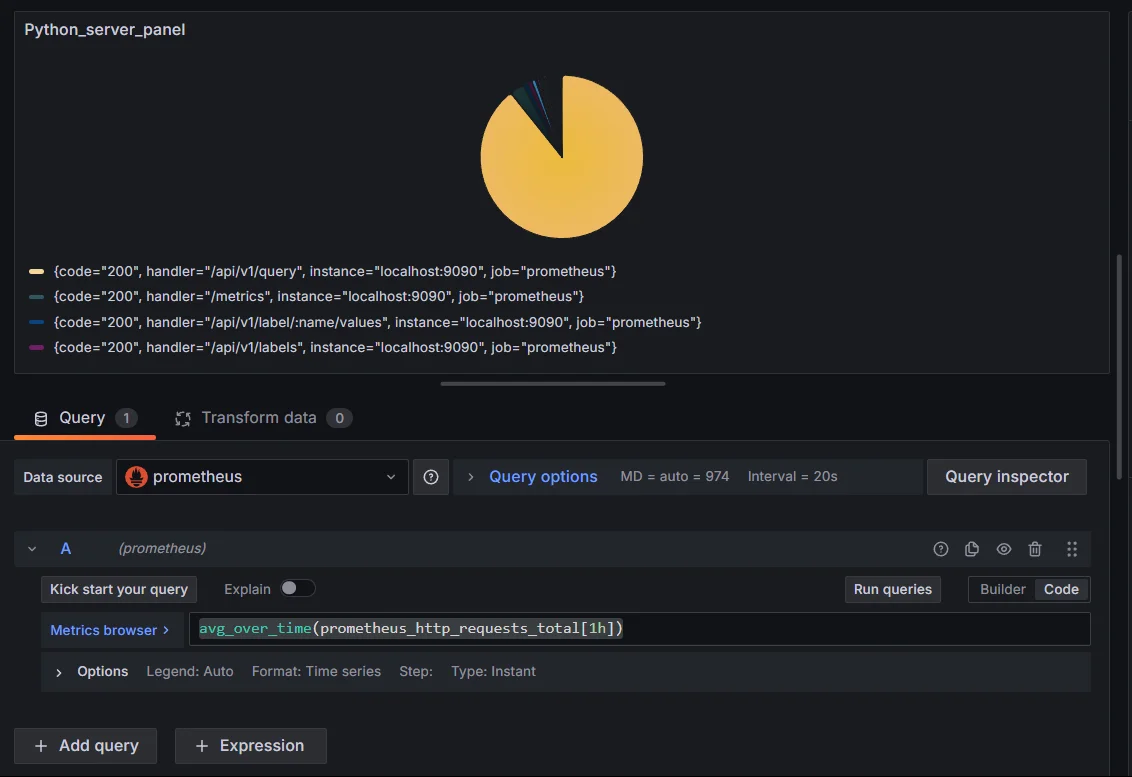
avg_over_time() - Time aggregation max_over_time() and min_over_time(): These return the maximum or minimum values within a specified range, ideal for identifying peaks or minimum usage patterns.
Advanced Time Query Techniques
In Grafana with Prometheus, advanced time-based queries can provide deeper insights into data by enhancing trend analysis, managing data gaps, and improving query efficiency. Here’s a look at some advanced techniques:
Time-Based Joins and Correlations
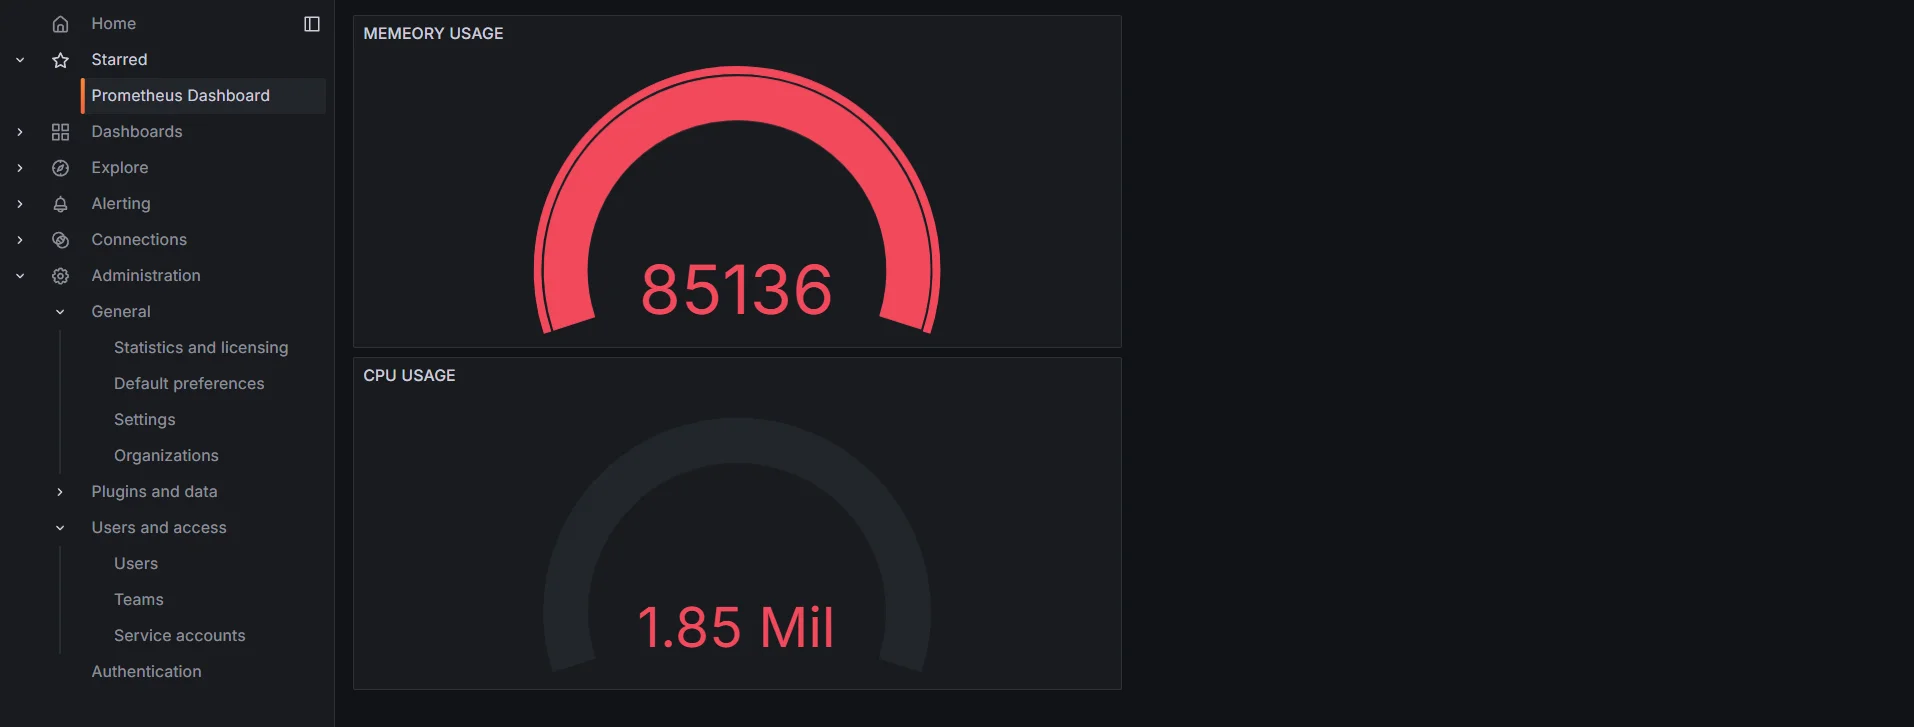
Time-based joins are useful for finding correlations between multiple metrics across the same timeframe. While Prometheus itself does not support true SQL-style joins, Grafana panels can be used to display side-by-side data for visual correlation.
For a high-level correlation, you might create two queries for metrics like cpu_usage and memory_usage:
- Query A:
avg_over_time(cpu_usage[5m]) - Query B:
avg_over_time(memory_usage[5m])
These can be placed on the same graph or separate panels in Grafana to visually compare trends over time.
Handling Missing Time Intervals
Prometheus lacks built-in functions for directly filling data gaps, so missing intervals appear as empty points or NaN in Grafana.
In Prometheus, you can sometimes manage missing data using expressions that default to a fixed value if no data is available. For example:
rate(http_requests_total[5m]) or 0
This expression returns zero if there’s no data for http_requests_total over the last five minutes.
Performance Optimization Tips
Here are some performance optimization tips for working with time-based queries in Prometheus and Grafana:
- Limit time ranges to necessary periods (e.g., “Last 1 hour”) to reduce data points.
- Avoid high-cardinality labels (e.g.,
user_id) to prevent slow queries; use only essential labels. - Use subqueries to break down long-term aggregations, which reduces data processing volume.
Monitoring Time Series Data with SigNoz
SigNoz provides powerful capabilities for monitoring and analyzing time series data, making it a compelling alternative to traditional tools like Grafana, especially when integrated with observability standards like OpenTelemetry. Here's how SigNoz stands out:
Real-Time Querying Capabilities: SigNoz allows for fast, real-time querying of time series data, enabling you to track and troubleshoot issues as they arise. SigNoz streamlines the process with its intuitive interface and seamless integration with observability pipelines.
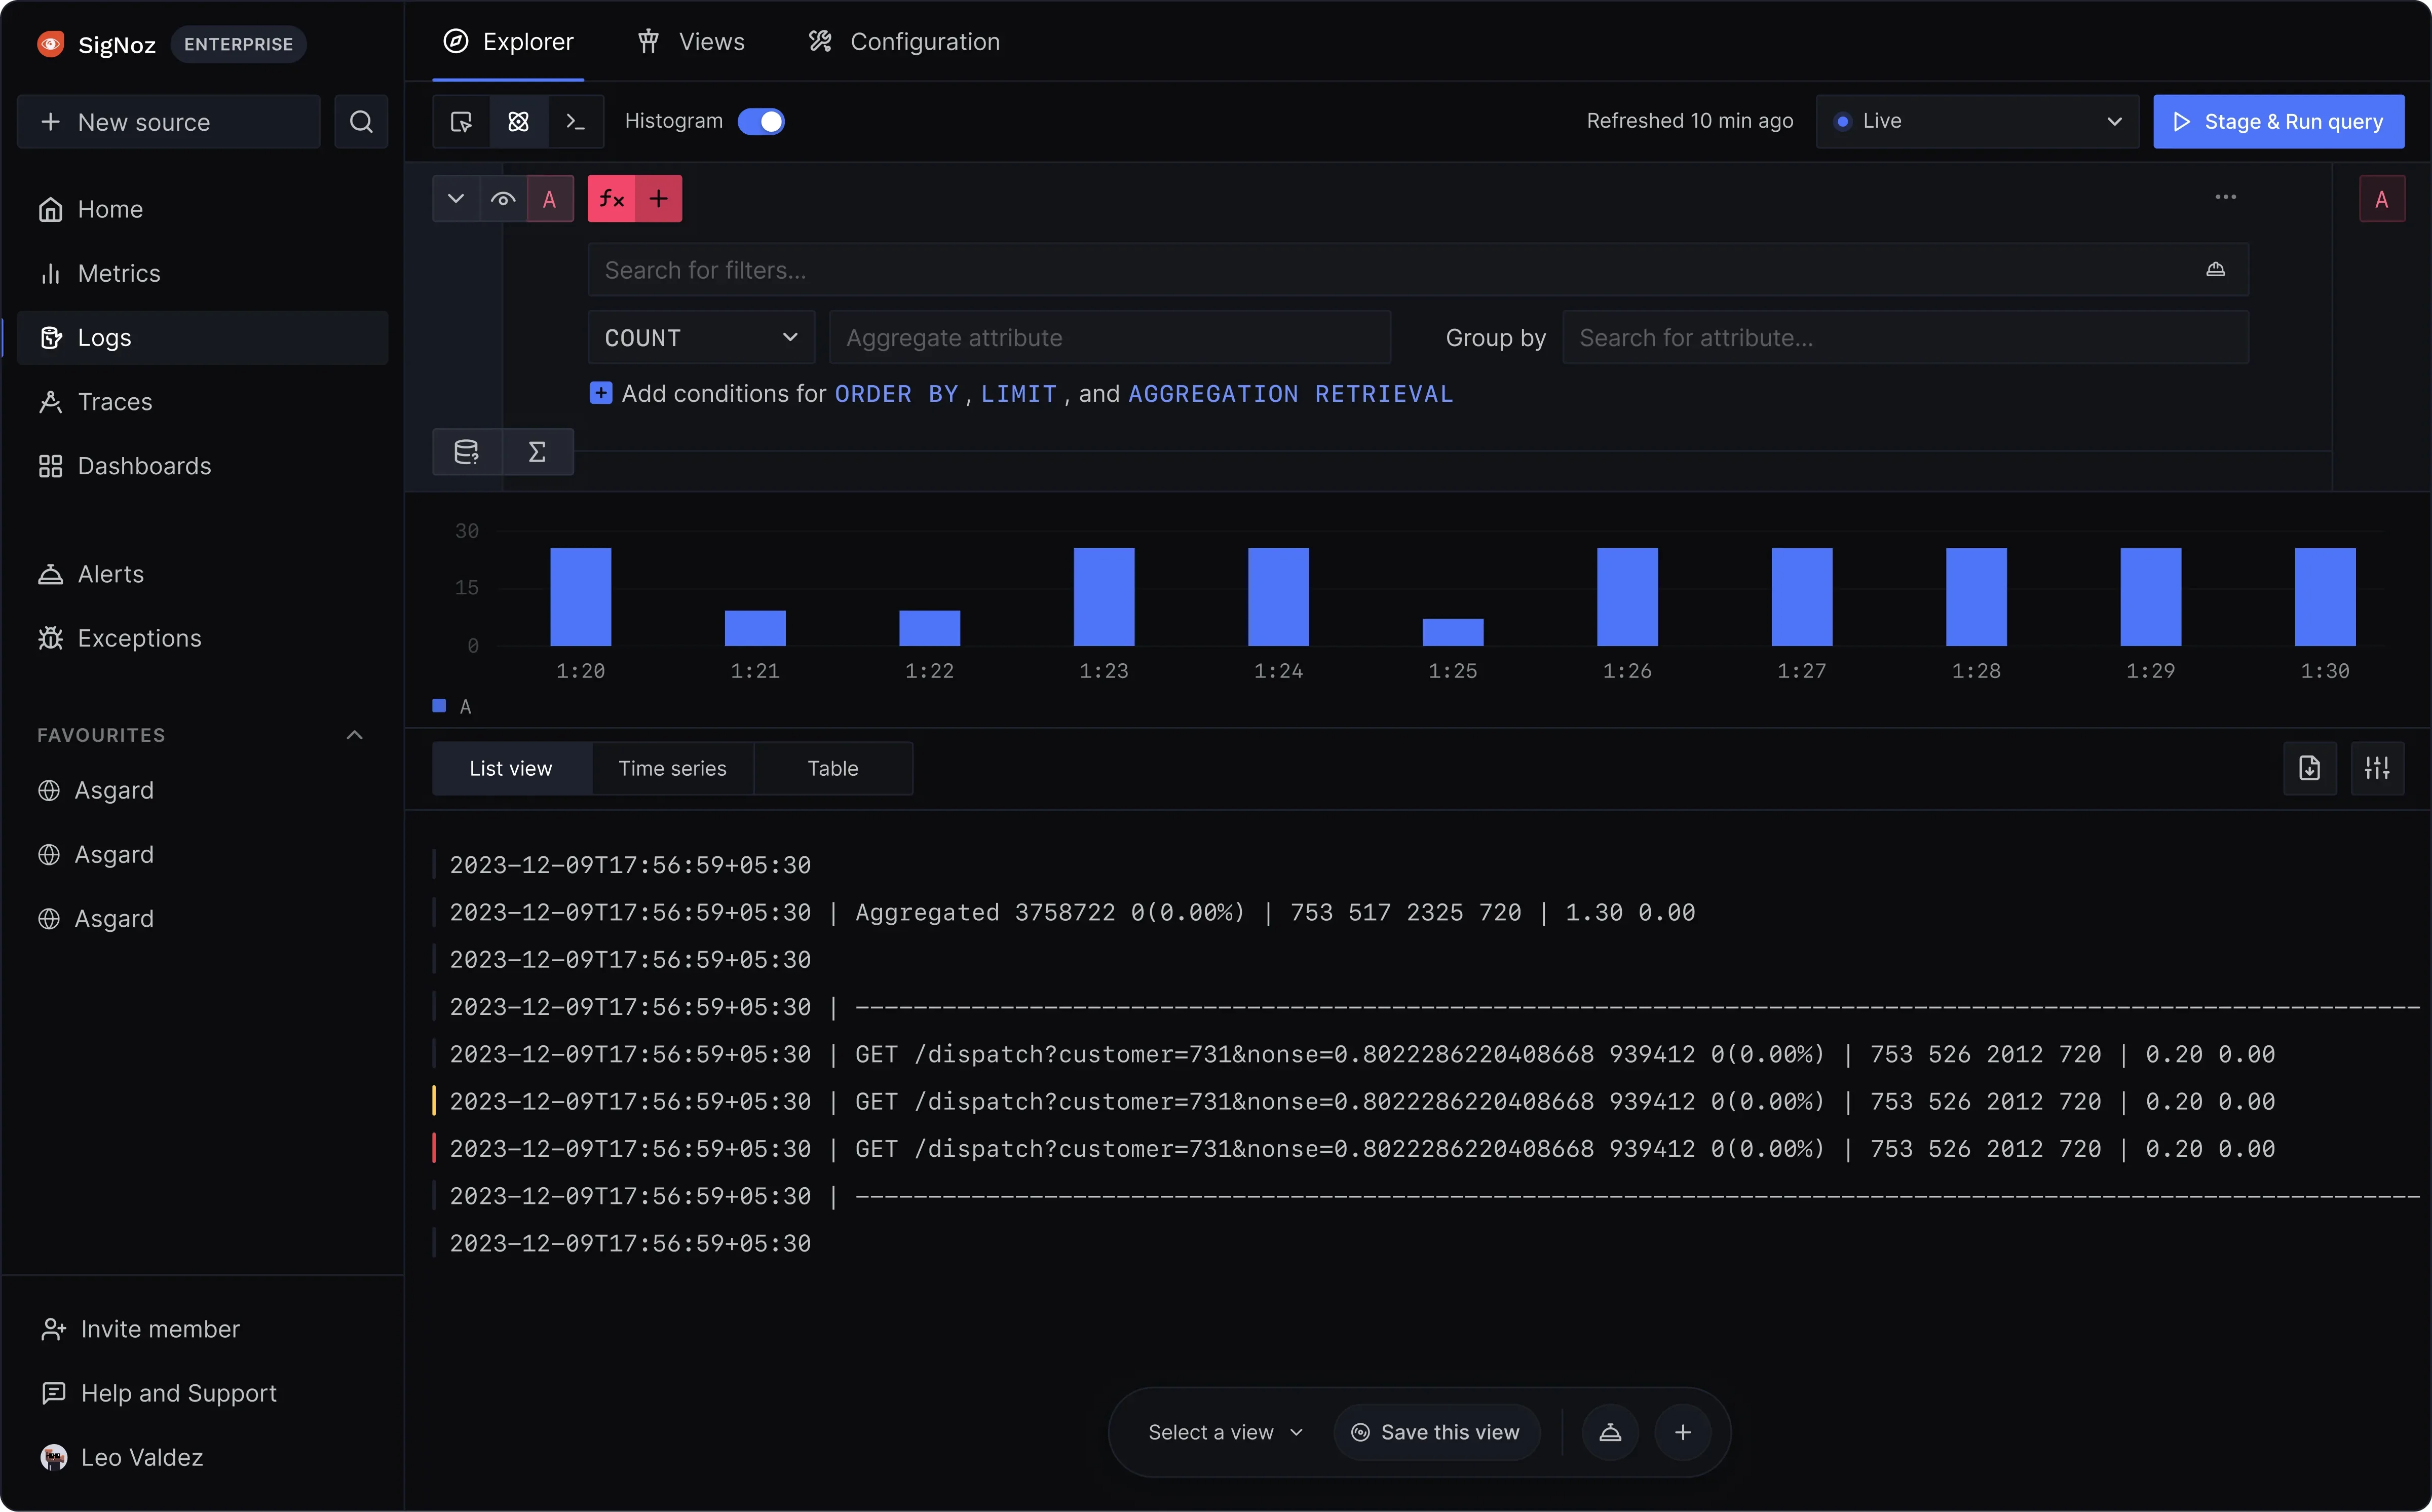
Real-time querying capabilities Built-In Time Range Selectors: With SigNoz, users can easily adjust time ranges within dashboards to pinpoint the exact moment events occurred. This built-in functionality eliminates the need for manual configurations, offering a more streamlined experience.
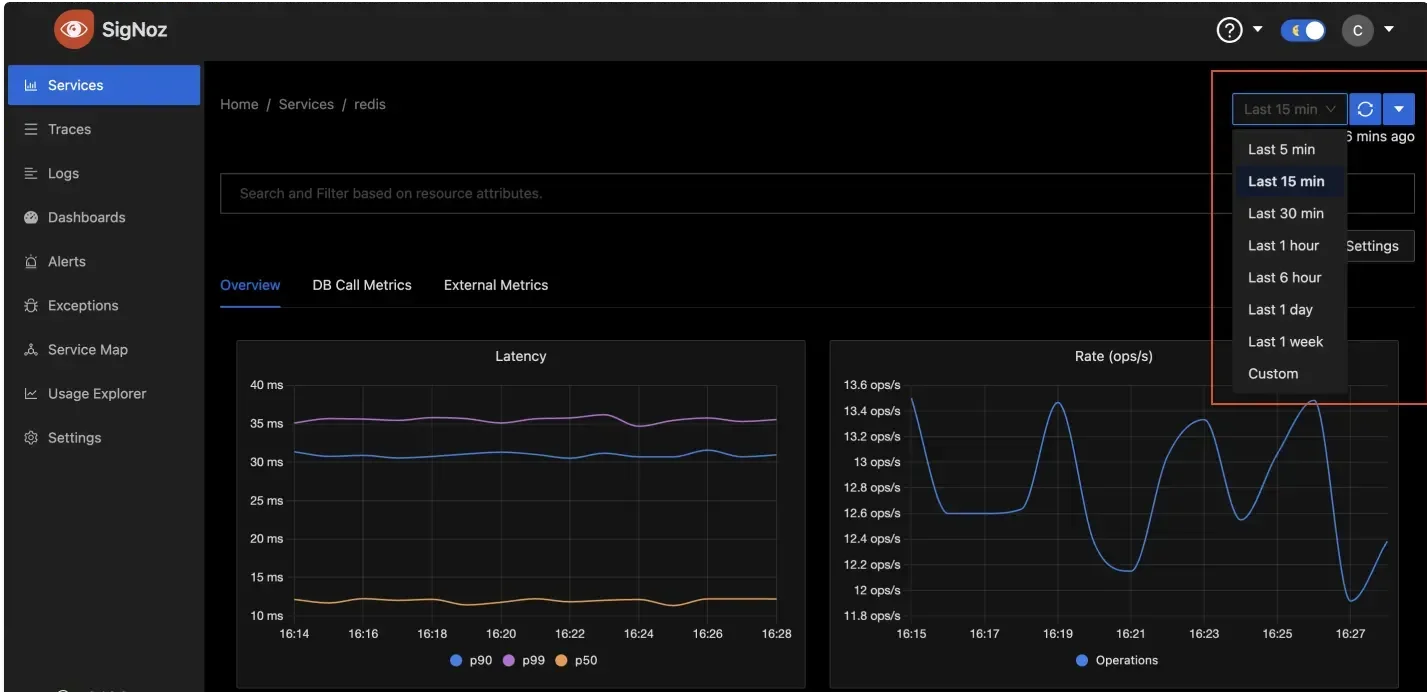
Built-in time range selectors in SigNoz Custom Dashboard Creation: SigNoz simplifies the creation of customized dashboards tailored to your unique monitoring needs. While Grafana provides extensive customization options, SigNoz focuses on reducing complexity and offering a user-friendly design that integrates out-of-the-box observability features. This makes it a great option for teams looking to quickly set up and scale their monitoring systems.
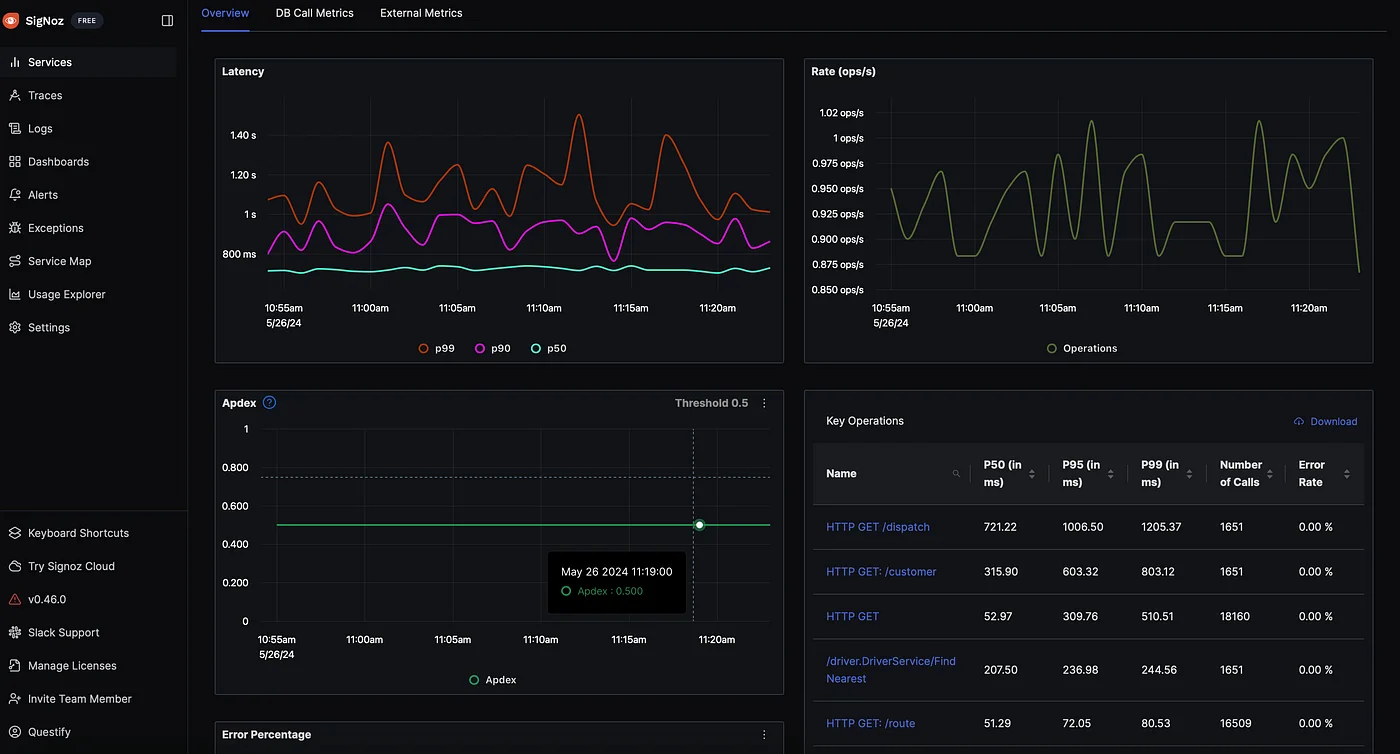
Custom dashboard creation
SigNoz Cloud is the easiest way to run SigNoz. Sign up for a free account and get 30 days of unlimited access to all features.
You can also install and self-host SigNoz yourself since it is open-source. With 24,000+ GitHub stars, open-source SigNoz is loved by developers. Find the instructions to self-host SigNoz.
Common Time Query Patterns
In Grafana, time series data is often analyzed using queries tailored to various time-based patterns. Here are common time query patterns that you can use in Grafana for better insights into your data:
Daily Aggregation Queries: Aggregate the
http_requests_totalmetric by day to track daily traffic.Example:
avg_over_time(prometheus_http_requests_total[1d])
Daily aggregation queries Business Hours Filtering: Filter
http_requests_totalfor data during business hours (9 AM - 5 PM).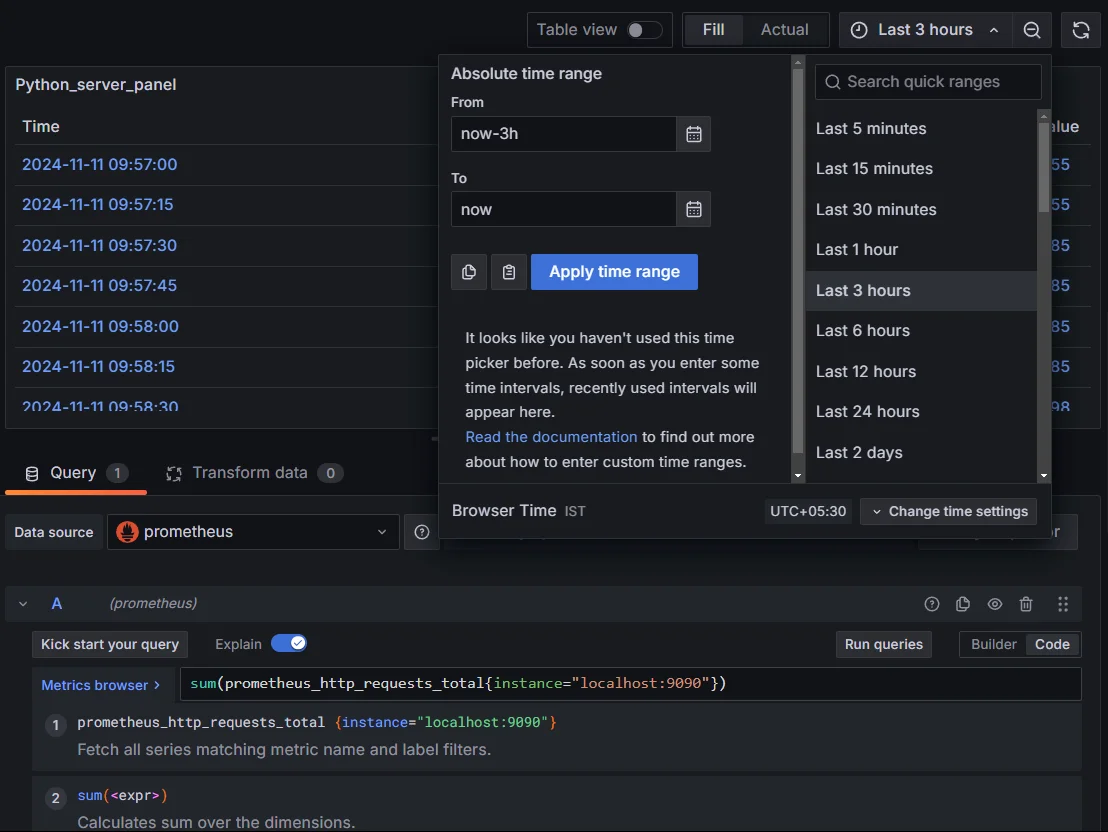
Business hours filtering Time-Based Comparisons: Compare
http_requests_totalfrom different time periods, such as this week vs. last week.Example:
rate(prometheus_http_requests_total[1w] offset 1w) #last week
rate(prometheus_http_requests_total[1w] #current week
The
offsetmodifier takes a time duration as an argument, such as1w(1 week),1d(1 day),5h(5 hours), etc. This allows you to look at data as it was at a specific time in the past.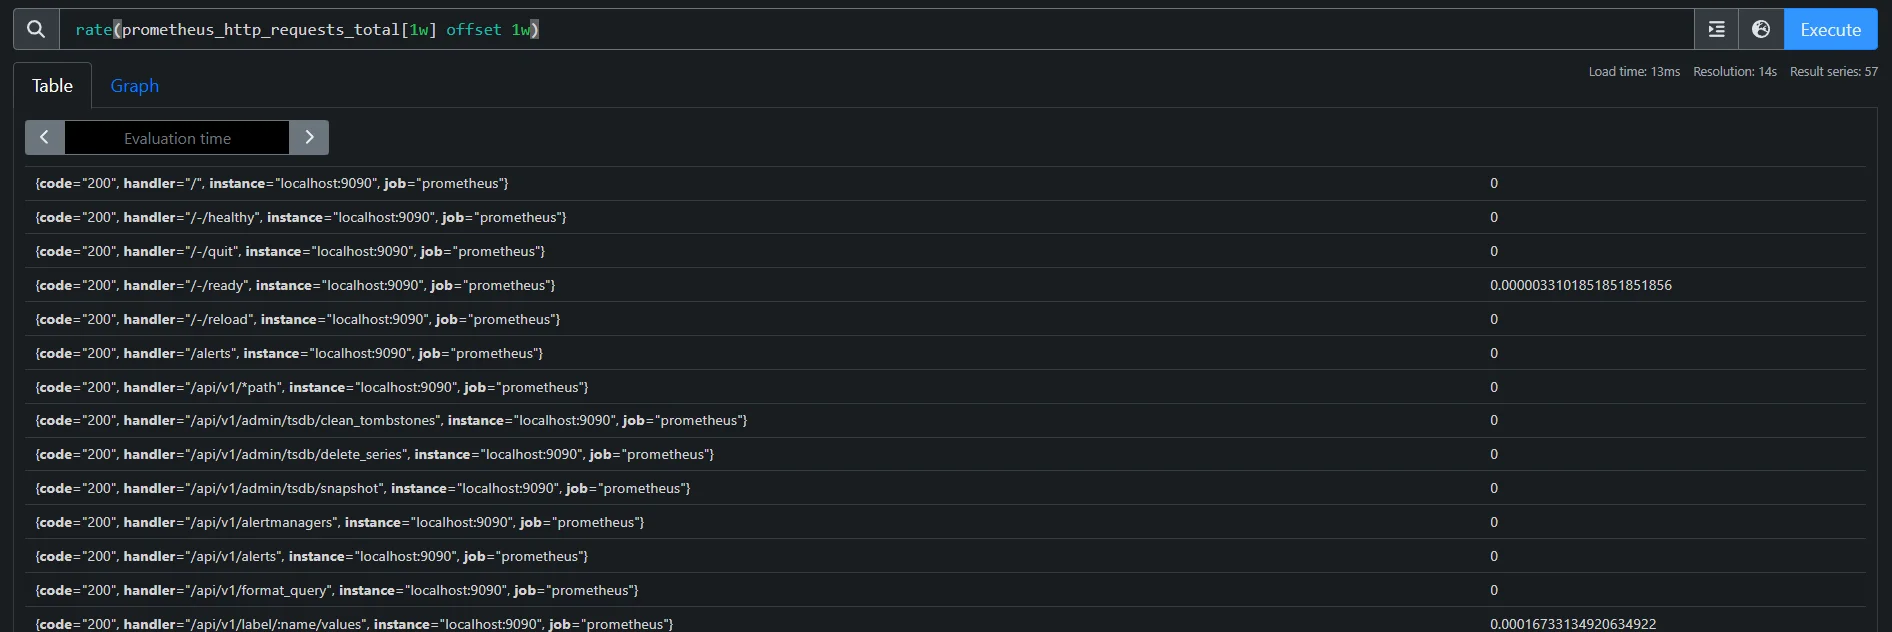
Time-based comparisons Seasonal Analysis Queries: Analyze seasonal trends in
http_requests_total, like yearly or monthly totals.Example:
avg_over_time(prometheus_http_requests_total[1y])
Seasonal analysis queries
Key Takeaways
- Use the right time formats for accurate queries.
- Optimize query performance by limiting time ranges and simplifying aggregations.
- Account for time zone differences using Grafana settings or the
offsetmodifier. - Ensure efficient indexing and avoid high cardinality to improve query speed.
FAQs
How do I query data between specific hours daily?
Prometheus does not natively support querying data for specific hours of the day directly. However, you can use Grafana time filters to select a particular time range that aligns with the specific hours.
What's the best way to handle timezone differences?
Prometheus stores data in UTC, but Grafana allows you to adjust the time zone in dashboard settings. You can also use the offset modifier in Prometheus queries to shift time periods as needed.
How can I compare data across different time periods?
Use the offset modifier in Prometheus, like http_requests_total[1w] offset 1w, to compare data between different periods, such as this week versus last week.
What are the performance considerations for time-based queries?
Time-based queries can be slower with longer durations or high-cardinality metrics. Limit your query range, avoid complex aggregations, and optimize sampling rates to improve performance.
