Mastering Kafka Metrics - A Comprehensive Guide
Apache Kafka is a cornerstone of modern data streaming architectures, acting as the backbone for real-time analytics, event-driven systems, and data pipelines. But even the most robust systems require diligent monitoring to perform at their best, and Kafka is no exception. To ensure smooth operations, Kafka metrics are like the health check for your Kafka cluster. They keep track of how everything is running, spotting any issues early so you can fix them before they become bigger problems.
This guide explores Kafka metrics in detail, their importance, and how they can be leveraged to maintain optimal cluster management. Think of Kafka metrics as the dashboard indicators in a car—they keep you informed about engine health, fuel levels, and performance, allowing you to act before a problem stalls the journey.
What Are Kafka Metrics and Why Are They Important?
Kafka metrics are quantitative indicators that offer a real-time view of how your Kafka cluster is functioning. Just as a fitness tracker monitors your heart rate, step count, and activity levels to provide insights into your health, Kafka metrics monitor the critical aspects of your cluster.
Why Do Kafka Metrics Matter?
Monitoring Cluster Health
Imagine running a manufacturing plant—machines must be checked regularly to avoid sudden breakdowns. Kafka metrics allow you to monitor your cluster's "machines" (brokers, producers, consumers) to detect and resolve issues before they disrupt operations.
Optimizing Performance
Performance tuning is like fine-tuning a musical instrument; every adjustment affects the harmony. Kafka metrics help identify bottlenecks or inefficiencies, allowing you to optimize configurations for smoother performance and better throughput.
Capacity Planning
Think of Kafka metrics as the load gauge on a bridge. They help you understand current usage and predict when additional capacity will be needed to handle increased loads. This proactive approach ensures your cluster can scale seamlessly as demands grow.
Efficient Troubleshooting
When issues arise, metrics act as the breadcrumbs leading to the root cause. Just as a mechanic uses diagnostic codes to identify car issues, Kafka metrics pinpoint where a problem lies, reducing downtime and simplifying fixes.
Kafka metrics fall into four main categories:
- Brokers are like conveyor belts, responsible for moving data efficiently between components.
- Producers are the supply chain, ensuring a steady flow of raw materials (data) into the system.
- Consumers are the workers, processing the data to create meaningful outputs.
- ZooKeeper acts as the foreman, keeping everything synchronized and running smoothly.
Essential Kafka Broker Metrics to Monitor
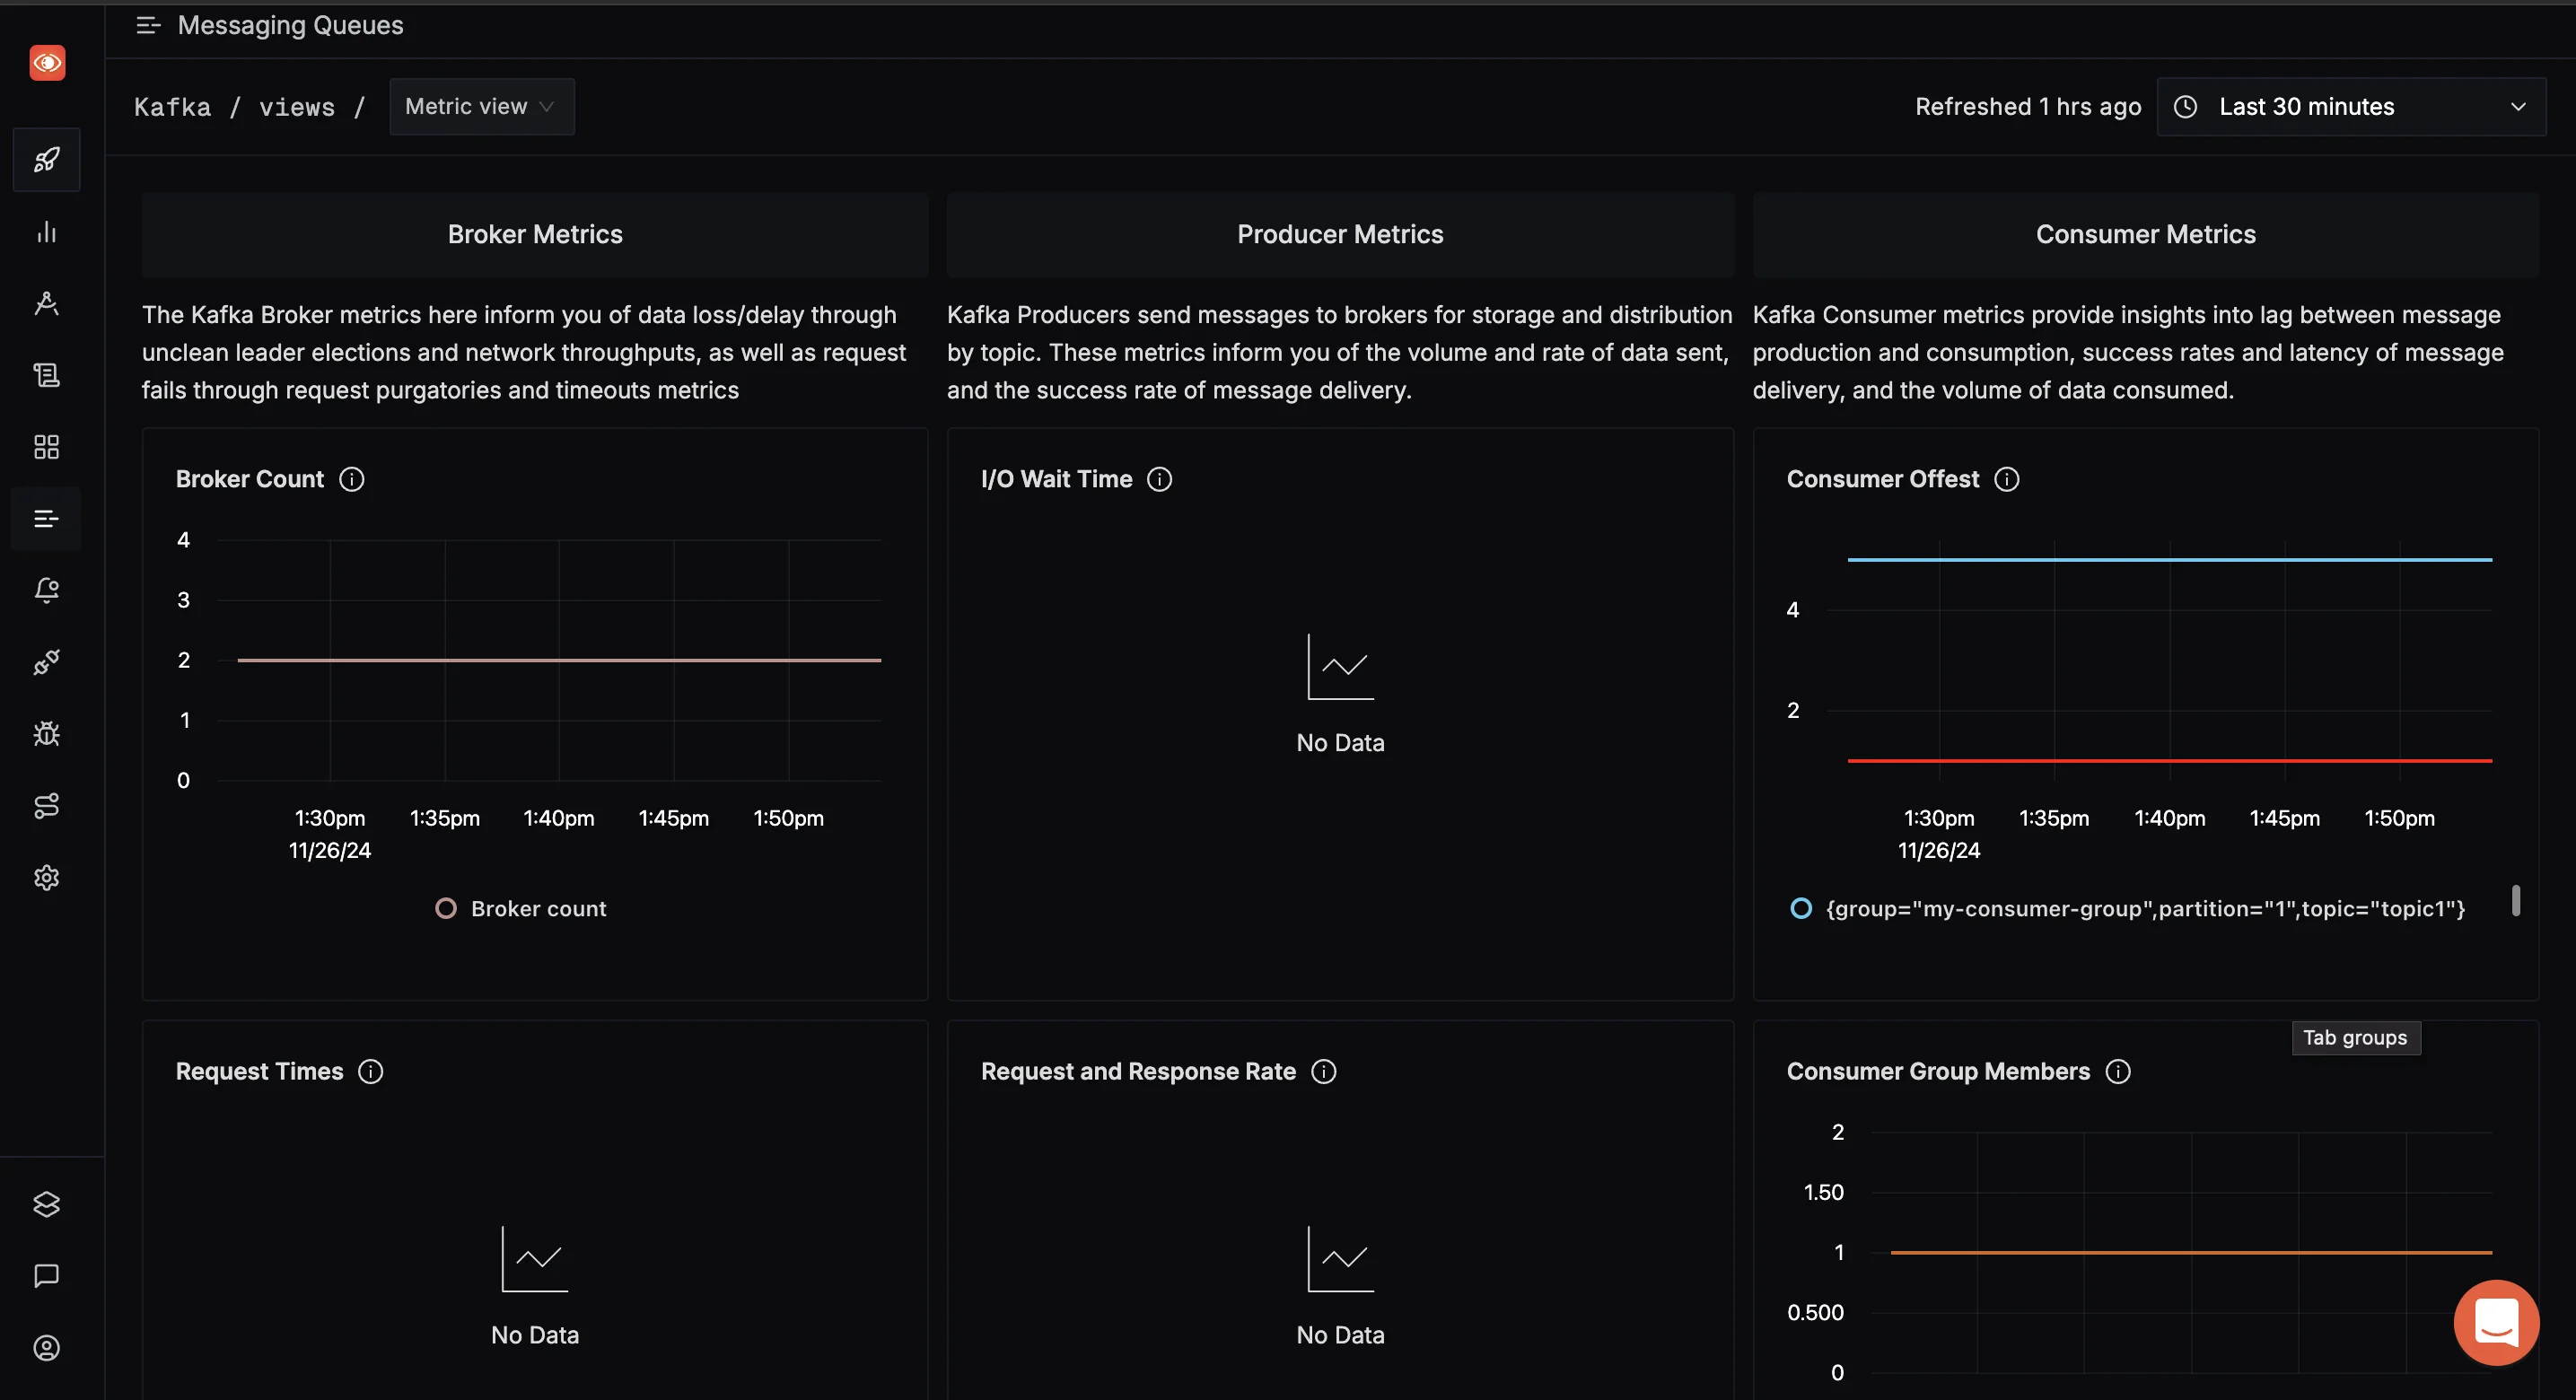
1. Broker Count
This metric represents the total number of active brokers in the Kafka cluster.
Why Monitor This Metric?
- Cluster Stability:
- A drop in the broker count indicates that one or more brokers have become unresponsive or gone offline.
- It is crucial to maintain the expected broker count to ensure data availability and fault tolerance.
- Replication and Partition Distribution:
- A decrease in brokers impacts partition replication and may lead to an increase in under-replicated partitions.
- Uneven partition distribution can arise when brokers go offline, affecting performance.
- Detect Failures Early:
- Monitoring this metric helps detect and address broker crashes or connectivity failures.
Recommended Actions:
- If the broker count drops unexpectedly, check the Kafka logs for errors related to the broker or network connectivity issues.
- Ensure proper monitoring of CPU, memory, and disk usage on the affected broker.
- Use tools like ZooKeeper or Kafka's metadata commands to verify the cluster state.
2. Request Times
This metric measures the time taken to handle requests in the Kafka cluster.
Why Monitor This Metric?
- Identify Latency Issues:
- High request times indicate delays in processing producer, consumer, or admin requests, which could lead to bottlenecks.
- Detect Resource Constraints:
- Spikes in request times might suggest insufficient broker resources (CPU, memory, disk I/O).
- Monitor Cluster Performance:
- Persistent high request times may result in delayed message delivery, affecting downstream systems.
No Data Scenario:
- If no data is shown for request times, it may mean that either:
- No significant requests were made during the monitoring period.
- The monitoring system might not be capturing this metric due to misconfiguration.
Recommended Actions:
- Verify that metrics collection is correctly configured in your Kafka monitoring tool.
- Simulate producer or consumer traffic to observe the impact on request times.
- If request times are high, review broker logs, analyze network latency, and optimize disk I/O.
3. BytesInPerSec and BytesOutPerSec
These metrics represent the rate of incoming and outgoing network traffic in bytes per second for each broker.
Why Are These Metrics Important?
- Cluster Throughput Assessment:
- BytesInPerSec reflects the amount of data being produced to the cluster.
- BytesOutPerSec indicates the data consumed from the cluster.
- Together, they provide a measure of the cluster's throughput, helping you evaluate whether the brokers can handle the current workload.
- Identify Network Bottlenecks:
- Sudden spikes in traffic can overwhelm network interfaces, leading to message delivery delays or dropped messages.
- A persistent high value may suggest the need to optimize the network setup or upgrade bandwidth.
- Capacity Planning:
- Monitoring these metrics over time enables proactive planning for network upgrades to accommodate future traffic growth.
Recommended Actions:
- Monitor Trends: Use these metrics to establish traffic baselines and detect anomalies such as sudden traffic surges.
- Optimize Configuration: Check broker network settings, including
socket.send.buffer.bytesandsocket.receive.buffer.bytes. - Upgrade Infrastructure: If these metrics consistently approach network limits, consider scaling out your brokers or upgrading network capacity.
4. MessagesInPerSec
This metric tracks the number of messages produced to the cluster per second.
Why Is This Metric Important?
- Understand Processing Capacity:
- Monitoring MessagesInPerSec helps gauge your cluster's ability to handle the current load of incoming messages.
- A consistently high rate could indicate the need to scale up resources.
- Identify Traffic Anomalies:
- A sudden spike might indicate a new producer sending excessive messages, while a drop could signal producer issues or reduced application activity.
- Correlate with Other Metrics:
- When analyzed alongside BytesInPerSec, it provides insights into the size of incoming messages.
- A high MessagesInPerSec with low BytesInPerSec might mean smaller message payloads, while the reverse indicates larger payloads.
Recommended Actions:
- Scale Resources: If the metric approaches cluster capacity, consider increasing partition counts or adding brokers.
- Investigate Anomalies: For unexpected spikes, examine producer logs and traffic patterns.
- Optimize Producers: Tune producer configurations like batch size and compression type to handle higher message rates efficiently.
Key Performance Indicators for Kafka Brokers
Monitoring Kafka brokers involves more than just basic metrics. Key Performance Indicators (KPIs) provide in-depth insights into the cluster's health, stability, and performance. Below is a detailed explanation of critical Kafka broker KPIs:
1. ActiveControllerCount
What It Measures:
This metric indicates the number of active controllers in the Kafka cluster. Kafka relies on a single controller to manage administrative tasks, such as partition reassignments and broker state management.
Healthy Value:
- The ActiveControllerCount should always be 1 in a healthy cluster.
Why It Matters:
- Cluster Coordination:
- The controller manages the cluster's metadata and ensures synchronization between brokers.
- Multiple active controllers can lead to split-brain scenarios, where conflicting states arise between brokers.
- Cluster Availability:
- If no active controller exists, Kafka cannot handle partition leadership changes or other administrative tasks, which can cause outages.
- High Availability:
- An active controller ensures that leader elections and partition assignments are performed efficiently during broker failures.
Recommended Actions:
- If ActiveControllerCount is not 1, check:
- The health of ZooKeeper (or KRaft, if used) as it manages controller elections.
- Broker logs for errors indicating controller election failures.
- Configure proper timeouts for controller elections in Kafka settings (
zookeeper.session.timeout.ms).
2. OfflinePartitionsCount
What It Measures:
This metric tracks the number of partitions that are unavailable for reads or writes because no in-sync replicas are available.
Healthy Value:
- The OfflinePartitionsCount should ideally be 0.
Why It Matters:
- Data Availability:
- Offline partitions cannot process messages, causing disruptions for producers and consumers.
- Risk of Data Loss:
- Persistent offline partitions can lead to message loss if the cluster cannot replicate the missing data.
- Cluster Imbalance:
- Offline partitions often indicate broker failures or issues with partition replication.
Recommended Actions:
- Investigate the cause of offline partitions:
- Check broker logs for errors related to storage, memory, or network failures.
- Ensure that brokers hosting the partitions are online and reachable.
- Review replication factors and ensure that critical topics have sufficient redundancy.
- Set up alerts for non-zero OfflinePartitionsCount to address issues promptly.
3. LeaderElectionRate
What It Measures:
This metric shows the frequency of leadership changes for partitions in the Kafka cluster.
Healthy Range:
- LeaderElectionRate should remain relatively low under normal operation. High values are a red flag.
Why It Matters:
- Cluster Stability:
- Frequent leader elections indicate instability caused by broker failures, high network latency, or misconfigurations.
- Performance Impact:
- Leadership changes disrupt partition processing temporarily, increasing producer and consumer latencies.
- Configuration Issues:
- Misconfigured timeout settings can lead to premature leader elections, even when brokers are healthy.
Recommended Actions:
- Identify and resolve causes of frequent leader elections:
- Check broker logs for errors indicating failures or network connectivity issues.
- Review timeout settings (
session.timeout.msandheartbeat.interval.ms) to prevent unnecessary leader changes.
- Scale the cluster if frequent elections occur due to resource contention.
4. UncleanLeaderElectionsPerSec
What It Measures:
This metric tracks the rate of unclean leader elections in the cluster. An unclean leader election occurs when a partition's leader fails, and none of the in-sync replicas (ISRs) are available to take over. Kafka elects an out-of-sync replica, which risks data loss.
Healthy Value:
- UncleanLeaderElectionsPerSec should always be 0.
Why It Matters:
- Data Consistency:
- An unclean leader election can result in data loss because the new leader may not have the latest data.
- Cluster Reliability:
- Frequent unclean elections indicate serious issues with replication, such as insufficient ISRs or slow replica recovery.
- Replication Settings:
- Misconfigured replication settings (e.g., low replication factors or incorrect
min.insync.replicas) increase the risk of unclean elections.
- Misconfigured replication settings (e.g., low replication factors or incorrect
Recommended Actions:
- Prevent unclean elections:
- Set
unclean.leader.election.enable=falseto disable unclean elections entirely. - Increase replication factors for critical topics to ensure more ISRs are available.
- Ensure brokers have sufficient resources (CPU, memory, disk I/O) to handle replication efficiently.
- Set
- Monitor replication lag and troubleshoot brokers with slow replicas.
Critical Kafka Producer Metrics for Optimal Performance
Producer metrics help you understand how efficiently your applications are sending data to Kafka. Key metrics include:
RecordSendRate
This metric measures the rate at which the producer sends records to Kafka brokers. It helps you:
- Gauge producer throughput
- Identify performance bottlenecks in the producing application
RecordErrorRate
This metric tracks the rate of failed record sends. A high error rate may indicate:
- Network issues
- Broker unavailability
- Misconfigured producer settings
BatchSizeAvg
The average batch size affects both latency and throughput. Monitoring this metric allows you to:
- Optimize producer performance
- Balance between latency and throughput requirements
RequestLatency
This metric measures the time taken for a produce request to be acknowledged by the broker. High latency can impact:
- Overall system performance
- End-to-end data processing times
Essential Kafka Consumer Metrics to Track
Consumer metrics are crucial for understanding how efficiently your applications are processing data from Kafka. Key metrics include:
RecordsConsumedRate
This metric measures the rate at which the consumer is processing records. It helps you:
- Assess consumer throughput
- Identify potential processing bottlenecks
FetchRate
The fetch rate indicates how often the consumer is requesting data from Kafka. Monitoring this metric helps you:
- Understand consumer behaviour
- Optimize consumer configurations for better performance
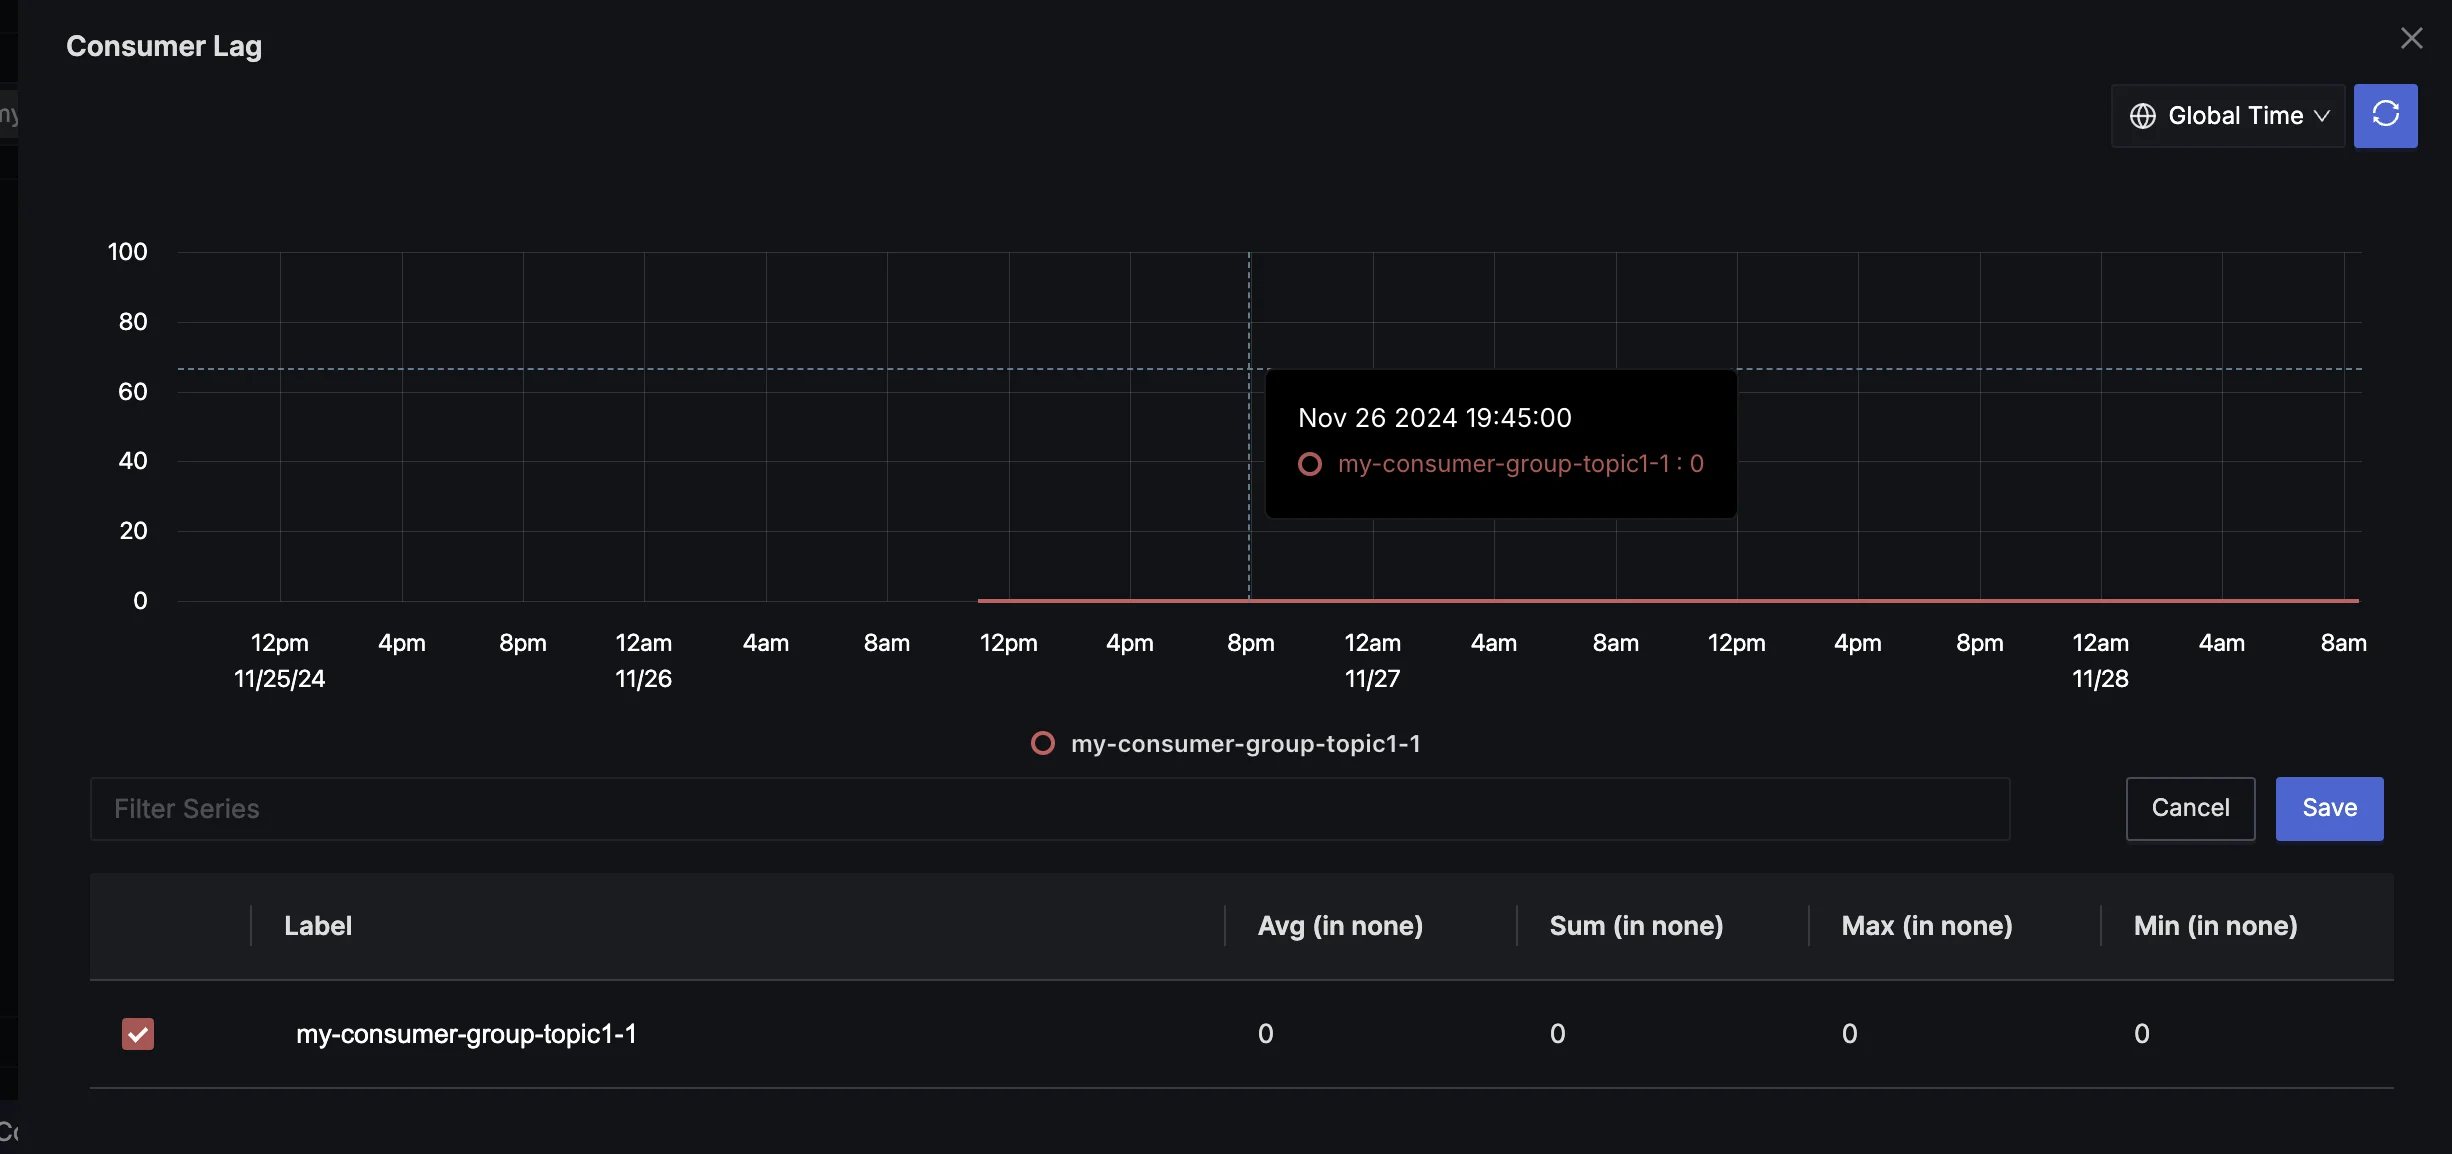
MaxLag and MaxLagConsumer
These metrics show the maximum lag (in terms of messages) for any partition in a consumer group. High lag values may indicate:
- Consumer processing issues
- Need for consumer group scaling
- Potential data freshness problems in downstream applications
RecordsLagMax
This metric represents the maximum lag in terms of the number of records for any partition in a consumer group. It's crucial for:
- Detecting potential data processing delays
- Ensuring timely data consumption in real-time applications
Understanding and Monitoring ZooKeeper Metrics
While Kafka is moving towards removing the ZooKeeper dependency, many clusters still rely on it. Key ZooKeeper metrics include:
ZkRequestLatency
This metric measures the time taken for ZooKeeper to respond to requests. High latency can impact:
- Kafka's overall performance
- Cluster management operations
OutstandingRequests
This metric shows the number of requests waiting to be processed by ZooKeeper. A high value may indicate:
- ZooKeeper overload
- Potential performance issues in Kafka operations
WatchCount
This metric tracks the number of watches placed on ZooKeeper znodes. It helps you:
- Understand client connection patterns
- Identify potential memory pressure on ZooKeeper
NodeCount
This metric shows the total number of znodes in your ZooKeeper ensemble. Monitoring it helps you:
- Track ZooKeeper's data growth
- Plan for potential ZooKeeper scaling needs
How to Collect and Visualize Kafka Metrics
Effective monitoring requires proper collection and visualization of Kafka metrics. Here's how you can set it up:
Use JMX for Kafka Metrics
Kafka exposes metrics via JMX (Java Management Extensions) by default. Ensure your Kafka brokers are configured to enable remote JMX connections.
Collect Metrics with SigNoz
SigNoz provides built-in support for collecting Kafka metrics seamlessly. Set up SigNoz to ingest these metrics through its OpenTelemetry-based architecture.
Visualize Metrics in SigNoz
Leverage SigNoz's intuitive dashboards to monitor Kafka metrics in real-time. These dashboards are customizable, allowing you to focus on the metrics most critical to your operations.
Configure Alerts in SigNoz
Set up intelligent alerts in SigNoz to notify your team when key Kafka metrics exceed predefined thresholds. This ensures proactive identification and resolution of potential issues.
By using SigNoz for Kafka monitoring, you gain a unified solution that combines metric collection, visualization, and alerting with advanced observability capabilities.
Implementing Kafka Metrics Monitoring with SigNoz
SigNoz offers a comprehensive solution for monitoring Kafka metrics. Here's how you can leverage SigNoz for enhanced Kafka observability:
Prerequisites:
- JDK should be installed in your system.
- Clone this repo as here there is a Java producer and consumer.
Step 1: Kafka Setup
To monitor Kafka, ensure your Kafka instance is up and running with proper configurations.
Kafka Installation:
Download Kafka:
Obtain the latest Kafka release and extract it:
tar -xzf kafka-3.9.0-src.tgz
cd kafka-3.9.0-src
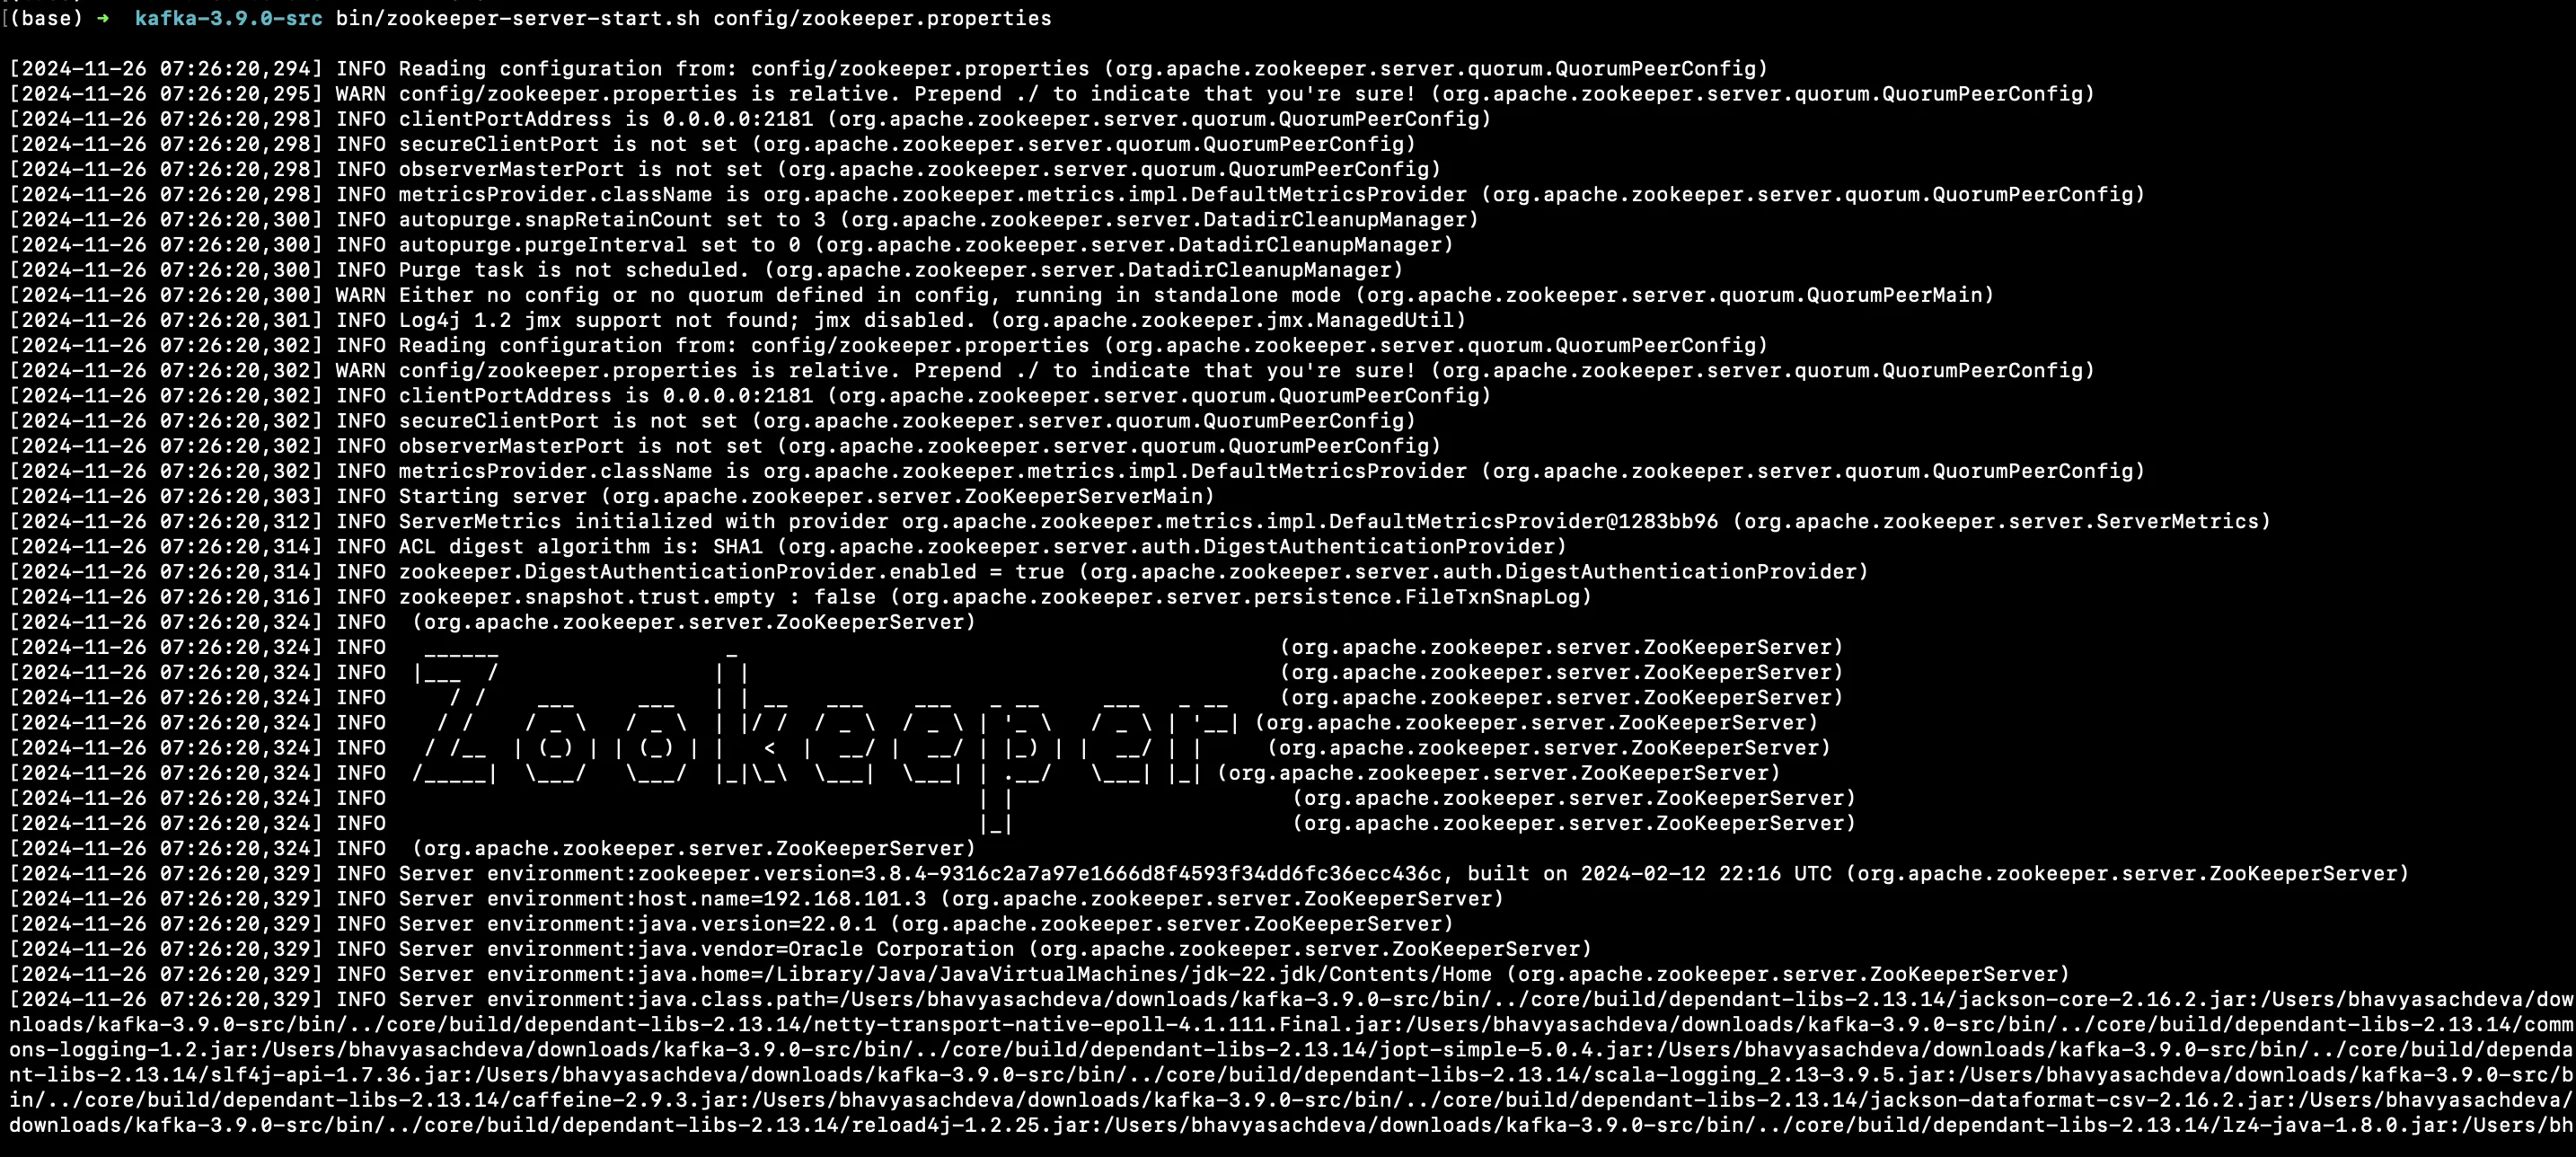
Start ZooKeeper (if not using KRaft):
Kafka requires ZooKeeper for managing brokers:
bin/zookeeper-server-start.sh config/zookeeper.properties3. Configure and Start Two Kafka Brokers:
Copy the default server configuration file and customize it:
cp config/server.properties config/s1.propertiesEdit
s1.propertiesto set the following:broker.id=0 listeners=PLAINTEXT://localhost:9092 logs.dirs=/tmp/kafka-logs-1 zookeeper.connect=localhost:2181Repeat for the second broker (
s2.properties) with:broker.id=1 listeners=PLAINTEXT://localhost:9093 logs.dirs=/tmp/kafka-logs-2 zookeeper.connect=localhost:2181Start both brokers in separate terminals:
JMX_PORT=2020 bin/kafka-server-start.sh config/s1.properties
JMX_PORT=2021 bin/kafka-server-start.sh config/s2.properties
Create Kafka Topics:
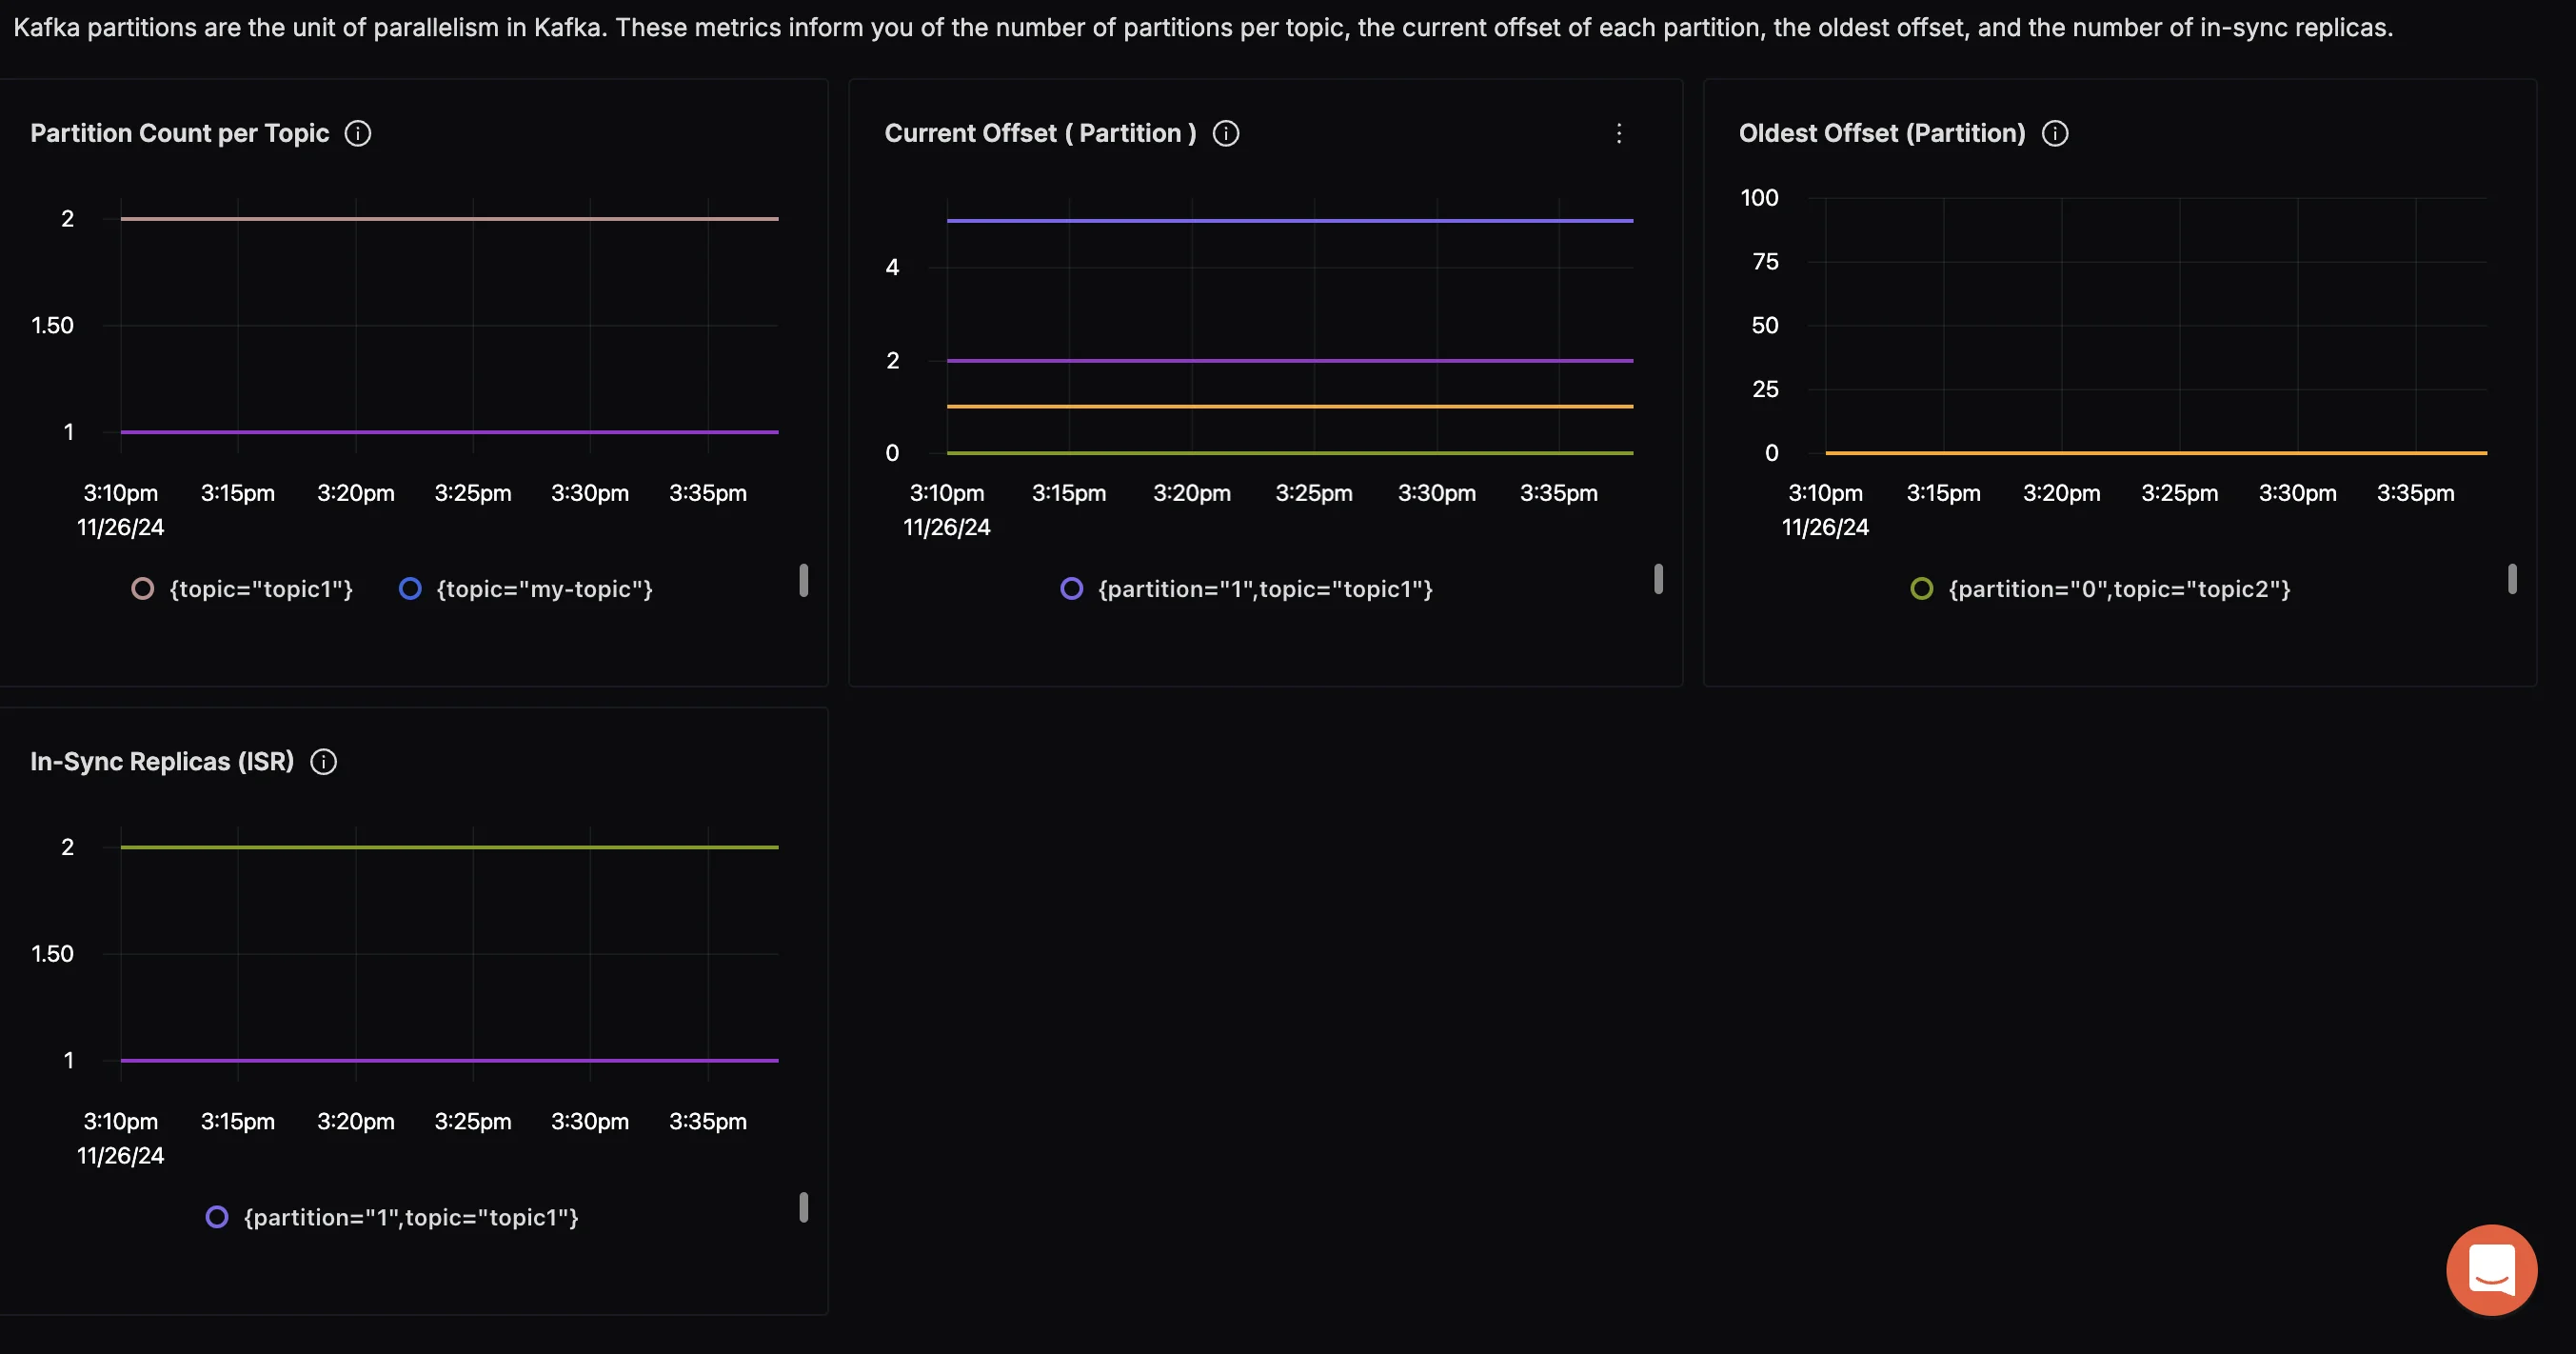
bin/kafka-topics.sh --create --topic topic1 --bootstrap-server localhost:9092 --replication-factor 2 --partitions 2
bin/kafka-topics.sh --create --topic topic2 --bootstrap-server localhost:9092 --replication-factor 2 --partitions 1
Verify the setup:
bin/kafka-topics.sh --describe --topic topic1 --bootstrap-server localhost:9092
bin/kafka-topics.sh --describe --topic topic2 --bootstrap-server localhost:9092
Test Kafka Setup:
Produce and consume messages:
bin/kafka-console-producer.sh --topic topic1 --bootstrap-server localhost:9092
# (Write some messages)
bin/kafka-console-consumer.sh --topic topic1 --from-beginning --bootstrap-server localhost:9092
### Step 2: Install OpenTelemetry Java Agent
Instrument your Kafka clients with OpenTelemetry for traces and metrics.
Verify the Java Agent:
Ensure the agent file exists:
cd kafka-opentelemetry-instrumentation/opentelemetry-javagent
ls | grep opentelemetry-javaagent.jar
(Optional) Download the Latest Agent:
curl -L -o opentelemetry-javaagent.jar https://github.com/open-telemetry/opentelemetry-java-instrumentation/releases/latest/download/opentelemetry-javaagent.jar
Step 3: Set Up Producer and Consumer Apps
Run the producer and consumer apps with OpenTelemetry instrumentation.
Start the Producer App:
java -javaagent:${PWD}/opentelemetry-javagent/opentelemetry-javaagent.jar \
     -Dotel.service.name=producer-svc \
     -Dotel.traces.exporter=otlp \
     -Dotel.metrics.exporter=otlp \
     -Dotel.logs.exporter=otlp \
     -jar ${PWD}/kafka-app-otel/kafka-producer/target/kafka-producer-1.0-SNAPSHOT-jar-with-dependencies.jar
Start the Consumer App:
java -javaagent:${PWD}/opentelemetry-javagent/opentelemetry-javaagent.jar \
     -Dotel.service.name=consumer-svc \
     -Dotel.traces.exporter=otlp \
     -Dotel.metrics.exporter=otlp \
     -Dotel.logs.exporter=otlp \
     -Dotel.instrumentation.kafka.producer-propagation.enabled=true \
     -Dotel.instrumentation.kafka.experimental-span-attributes=true \
     -Dotel.instrumentation.kafka.metric-reporter.enabled=true \
     -jar ${PWD}/kafka-app-otel/kafka-consumer/target/kafka-consumer.-1.0-SNAPSHOT-jar-with-dependencies.jar
Step 4: Install SigNoz
Choose between SigNoz Cloud or a self-hosted deployment for observability.
Install SigNoz:
Follow the instructions from the SigNoz documentation.
Configure Kafka Metrics Collection:
Set up the OpenTelemetry Collector to push Kafka metrics to SigNoz.
Step 5: OpenTelemetry Collector Setup
Download the OpenTelemetry Collector:
Install the
otelcol-contribcollector in the root directory of the project kafka-opentelemetry-instrumentation:wget https://github.com/open-telemetry/opentelemetry-collector-releases/releases/download/v0.114.0/otelcol-contrib_0.114.0_darwin_arm64.tar.gz tar -xzf otelcol-contrib_0.114.0_darwin_arm64.tar.gzUse the Provided Configuration:
Save the configuration file (
collector/collector-contrib-config.yaml) to the root directory.Make sure to modify the collector-contrib-config.yaml if you are using SigNoz Cloud:
receivers:
  # Read more about kafka metrics receiver - https://github.com/open-telemetry/opentelemetry-collector-contrib/blob/main/receiver/kafkametricsreceiver/README.md
  kafkametrics:
    brokers:
      - localhost:9092
      - localhost:9093
      - localhost:9094
    protocol_version: 2.0.0
    scrapers:
      - brokers
      - topics
      - consumers
  # Read more about jmx receiver - https://github.com/open-telemetry/opentelemetry-collector-contrib/blob/main/receiver/jmxreceiver/README.md
  jmx/1:
    # configure the path where you installed opentelemetry-jmx-metrics jar
    jar_path: /Users/bhavyasachdeva/desktop/kafka-opentelemetry-instrumentation/collector/opentelemetry-jmx-metrics.jar #change this to the path to you opentelemetry-jmx-metrics jar file you downloaded above
    endpoint: service:jmx:rmi:///jndi/rmi://localhost:9991/jmxrmi
    target_system: jvm,kafka,kafka-consumer,kafka-producer
    collection_interval: 10s
    log_level: info
    resource_attributes:
      broker.name: broker1
  jmx/2:
    jar_path: /Users/bhavyasachdeva/desktop/kafka-opentelemetry-instrumentation/collector/opentelemetry-jmx-metrics.jar
    endpoint: service:jmx:rmi:///jndi/rmi://localhost:9992/jmxrmi
    target_system: jvm,kafka,kafka-consumer,kafka-producer
    collection_interval: 10s
    log_level: info
    resource_attributes:
      broker.name: broker2
exporters:
  otlp:
    endpoint: "ingest.{region}.signoz.cloud:443"
    tls:
      insecure: false
    headers:
      "signoz-ingestion-key": "<ingestion-key>"
  debug:
    verbosity: detailed

service:
  pipelines:
    metrics:
      receivers: [kafkametrics, jmx/1, jmx/2]
      exporters: [otlp]
Start the Collector:
./otelcol-contrib --config ${PWD}/collector/collector-contrib-config.yaml---
Step 6: Monitor Kafka in SigNoz
Once you have completed setting up the Kafka environment, configured the OpenTelemetry Collector, and run the producer and consumer applications, it's time to monitor and visualize Kafka metrics in SigNoz.


SigNoz provides several advantages for Kafka monitoring:
- End-to-end observability across your entire stack
- Correlation of Kafka metrics with application performance data
- Advanced anomaly detection capabilities
- Customizable dashboards and alerts
By integrating Kafka with SigNoz and OpenTelemetry, you can achieve end-to-end observability and proactively address issues in your Kafka ecosystem. SigNoz provides robust tools for visualizing Kafka's health, analyzing performance, and enhancing reliability.
Advanced Kafka Metrics Analysis Techniques
To extract maximum value from your Kafka metrics, consider these advanced analysis techniques:
- Metric correlation: Analyze relationships between different metrics to gain deeper insights. For example, correlate consumer lag with producer send rates to identify potential bottlenecks.
- Trend analysis: Use historical data to identify long-term trends and predict future resource needs.
- Anomaly detection: Implement machine learning algorithms to detect unusual patterns in your Kafka metrics automatically.
- Custom metric creation: Develop custom metrics that combine existing ones to provide insights specific to your use case.
Best Practices for Kafka Metrics Monitoring
Follow these best practices to ensure effective Kafka metrics monitoring:
- Establish baselines: Determine normal operating ranges for your key metrics to easily spot deviations.
- Implement proper retention policies: Balance between keeping enough historical data for trend analysis and managing storage costs.
- Regularly review and update: As your Kafka usage evolves, periodically review and adjust your monitoring strategy.
- Integrate with DevOps workflows: Incorporate Kafka metrics monitoring into your CI/CD pipelines and incident response processes.
- Document metric interpretations: Create clear guidelines on how to interpret different metrics and what actions to take based on their values.
By mastering Kafka metrics, you'll be well-equipped to maintain a healthy, high-performing Kafka cluster. Remember that effective monitoring is an ongoing process — continuously refine your approach as you gain more insights into your specific Kafka deployment.
FAQs
What are the most important Kafka metrics to monitor?
The most critical Kafka metrics include:
- Broker metrics: BytesInPerSec, BytesOutPerSec, UnderReplicatedPartitions
- Producer metrics: RecordSendRate, RequestLatency
- Consumer metrics: RecordsConsumedRate, MaxLag
- ZooKeeper metrics: ZkRequestLatency, outstanding requests
Prioritize these metrics for a comprehensive view of your Kafka cluster's health.
How often should I collect Kafka metrics?
The frequency of metric collection depends on your specific use case. For most scenarios:
- Collect high-priority metrics (e.g., UnderReplicatedPartitions) every 10-30 seconds
- Gather general performance metrics every 1-5 minutes
- Collect long-term trend metrics hourly or daily
Adjust these intervals based on your cluster's size and criticality.
Can Kafka metrics help in capacity planning?
Yes, Kafka metrics are invaluable for capacity planning. Key metrics for this purpose include:
- BytesInPerSec and BytesOutPerSec: For network capacity planning
- DiskUsage: For storage capacity planning
- RequestHandlerAvgIdlePercent: For CPU capacity planning
Analyze these metrics over time to predict future resource needs and plan upgrades accordingly.
What tools are best for visualizing Kafka metrics?
Popular tools for visualizing Kafka metrics include:
- SigNoz: Offers comprehensive observability with custom Kafka dashboards
- Grafana: Offers flexible, customizable dashboards
- Prometheus + Grafana: Powerful combination for metric collection and visualization
- Datadog: Provides pre-built Kafka dashboards and easy integration
Choose a tool that integrates well with your existing infrastructure and meets your specific visualization needs.
