Top SQL Server Monitoring Tools - A Comprehensive Guide
SQL Server monitoring is a critical aspect of database management that ensures optimal performance, prevents issues, and maintains the health of your database systems. As a database administrator or developer, you need to stay on top of your SQL Server's performance to guarantee smooth operations and minimize downtime. This comprehensive guide will walk you through the essentials of SQL Server monitoring, introduce you to built-in tools like SQL Server Profiler, as well as third-party solutions like SigNoz, and provide best practices for implementation.
What is SQL Server Monitoring and Why is it Crucial?
SQL Server monitoring is the process of tracking, analyzing, and managing the performance and health of your SQL Server databases. It involves collecting and interpreting data about various aspects of your database system.
Key areas of SQL Server monitoring include:
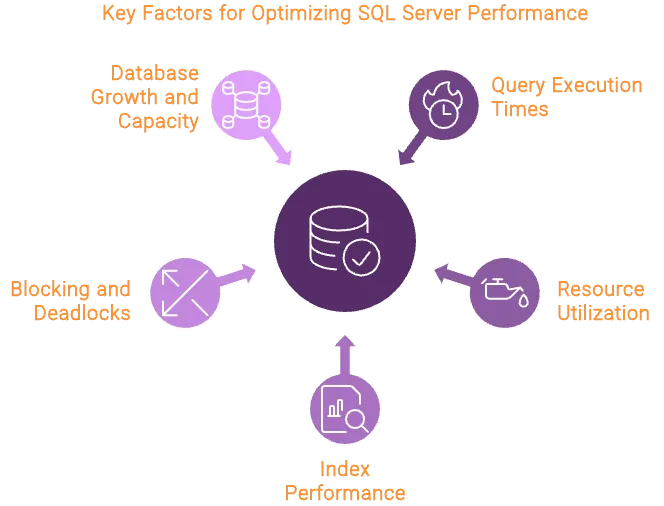
- Query Execution Times: Monitoring the time it takes for queries to execute helps identify slow-running queries that may need optimization. This can improve overall application performance and user experience.
- Resource Utilization: Keeping an eye on CPU, memory, and disk I/O usage ensures that your SQL Server is operating within its capacity. Overutilization of resources can lead to performance bottlenecks, while underutilization may indicate that resources are not being used efficiently.
- Index Performance: Indexes play a crucial role in speeding up query performance. Monitoring index usage and identifying missing or unused indexes can help optimize database performance.
- Blocking and Deadlocks: Monitoring for blocking sessions and deadlocks is vital to ensure that transactions are processed smoothly. Addressing these issues promptly can prevent disruptions in database operations.
- Database Growth and Capacity: Tracking the growth of your databases and ensuring sufficient storage capacity helps avoid unexpected outages or performance degradation due to space constraints.
Effective SQL Server monitoring is crucial for several reasons:
- Proactive issue detection: Identify and address potential problems before they impact users or business operations.
- Performance optimization: Pinpoint bottlenecks and inefficiencies to improve overall database performance.
- Capacity planning: Forecast resource needs and plan for future growth based on historical data.
- Compliance and security: Ensure adherence to regulatory requirements and detect suspicious activities.
Without proper monitoring, you risk experiencing:
- Unexpected downtime
- Poor application performance
- Data loss or corruption
- Inefficient resource utilization
- Frustrated users and potential revenue loss
Essential Features of SQL Server Monitoring Tools
When evaluating SQL Server monitoring tools, look for these key features:
- Real-time performance tracking: Monitor critical metrics in real-time to quickly identify and respond to issues.
- Query analysis and optimization: Analyze query execution plans and identify slow-running queries for optimization.
- Resource utilization monitoring: Track CPU, memory, and disk I/O usage to ensure efficient resource allocation.
- Alerting and reporting: Receive timely notifications for predefined thresholds and generate comprehensive reports for analysis.
- Historical data analysis: Store and analyze historical performance data to identify trends and plan for future needs.
- Customizable dashboards: Create tailored monitoring views that focus on the metrics most important to your organization.
- Predictive analytics: Leverage machine learning algorithms to forecast potential performance issues before they occur.
Top Built-in SQL Server Monitoring Tools
SQL Server includes several built-in tools that offer valuable monitoring capabilities, helping administrators manage and optimize database performance. Here are the key tools:
SQL Server Management Studio (SSMS) Activity Monitor:
Activity Monitor is a user-friendly tool within SSMS that provides a quick snapshot of the current state of your SQL Server instance.
Key Features:
- Displays real-time information on active processes, resource utilization (CPU, memory, disk I/O), and recent expensive queries.
- Helps in identifying performance bottlenecks, such as high CPU usage or long-running queries.
- Allows quick access to detailed information about specific processes, such as blocking sessions.
Extended Events:
Extended Events is a highly customizable and lightweight event-handling system built into SQL Server.
Key Features:
- Allows for fine-grained monitoring of specific events, such as query execution, deadlocks, or errors.
- Provides a more efficient alternative to SQL Server Profiler, with less performance overhead.
- Enables the creation of custom event sessions to track and log specific actions or conditions within SQL Server.
- Supports integration with tools like SSMS and SQL Server Data Tools for advanced monitoring and analysis.
Dynamic Management Views (DMVs) and Functions (DMFs):
DMVs and DMFs are powerful tools that expose detailed server state information, allowing administrators to monitor the health, diagnose issues, and tune performance. Examples include
sys.dm_exec_query_statsfor query performance statistics andsys.dm_os_wait_statsfor identifying wait types affecting server performance.Key Features:
- Provide insights into a wide range of metrics, including session activity, query performance, index usage, and resource allocation.
- Allow for real-time performance monitoring as well as historical analysis by querying the views.
- Offer a programmatic way to access detailed information that can be used in scripts or automated monitoring solutions.
SQL Server Profiler:
SQL Server Profiler is a legacy tool that captures and analyzes SQL Server events, such as query execution, transaction start/end, and login/logout activities.
Key Features:
- Useful for troubleshooting complex performance issues by capturing detailed event traces.
- Enables deep analysis of specific queries or workloads to identify causes of performance degradation.
- Supports security auditing by capturing login attempts and permission changes.
While these built-in tools are powerful, they often require significant expertise to use effectively and may not provide the comprehensive monitoring capabilities that third-party solutions offer. It is generally recommended to use Extended Events for most scenarios due to Profiler's higher resource consumption.
Popular Third-Party SQL Server Monitoring Solutions
For those seeking advanced monitoring capabilities beyond the built-in tools provided by SQL Server, several third-party solutions offer robust features tailored to a variety of needs.
SigNoz:
SigNoz is an open-source application performance monitoring (APM) tool that includes comprehensive database monitoring capabilities, including support for SQL Server.
Key Features:
- Provides real-time performance tracking, allowing for immediate detection and resolution of issues.
- Includes detailed query analysis tools to help identify and optimize slow-performing queries.
- Offers customizable dashboards that enable users to focus on the most critical metrics relevant to their environment.
- Supports both cloud-based and self-hosted deployments, offering flexibility depending on organizational needs.
- Integrates seamlessly with other parts of the infrastructure, providing a unified view of application and database performance.
SolarWinds Database Performance Analyzer:
SolarWinds Database Performance Analyzer (DPA) is a widely used tool focused on improving query performance and optimizing database operations.
Key Features:
- Emphasizes query performance analysis with detailed wait-time data, helping to pinpoint the root cause of slowdowns.
- Uses machine learning to detect anomalies, allowing for proactive management of potential issues before they impact performance.
- Offers a user-friendly interface with visualizations that make complex performance data easier to understand and act upon.
- Supports multiple database platforms, making it a good choice for heterogeneous environments.
Redgate SQL Monitor:
Redgate SQL Monitor is a specialized tool for monitoring SQL Server and Azure SQL Database environments, providing detailed insights into performance and health across your database estate.
Key Features:
- Estate-wide monitoring allows for centralized management of all SQL Server instances, making it easier to manage large environments.
- Customizable alerts and dashboards provide targeted monitoring and quick access to critical information.
- Detailed reporting capabilities support performance reviews, audits, and compliance efforts.
- Integrates with other Redgate tools, offering a comprehensive solution for database management and DevOps practices.
IDERA SQL Diagnostic Manager:
IDERA SQL Diagnostic Manager offers comprehensive performance monitoring and diagnostics for SQL Server, with a focus on deep-dive analytics and proactive management.
Key Features:
- Provides real-time monitoring of SQL Server performance, with detailed insights into query execution, resource utilization, and more.
- Includes advanced diagnostic tools such as query plan analysis and index optimization recommendations.
- Offers capacity planning and forecasting tools, helping organizations plan for future growth and avoid resource shortages.
- Supports a wide range of SQL Server environments, including on-premises, cloud, and hybrid setups.
Considerations for Choosing a Third-Party Tool
When selecting a third-party SQL Server monitoring solution, it's important to consider the following factors:
- Ease of Use and Setup: How quickly can the tool be implemented and used effectively? Look for solutions with intuitive interfaces and good documentation.
- Scalability: Ensure the tool can scale with your organization's needs, whether you're managing a single server or a large estate.
- Integration Capabilities: Consider how well the tool integrates with your existing IT infrastructure, including other monitoring solutions, automation tools, and DevOps workflows.
- Pricing Models and Total Cost of Ownership: Evaluate the cost structure of the tool, including licensing, maintenance, and any additional costs. Open-source solutions like SigNoz may offer cost advantages over commercial tools.
- Support and Community Resources: Assess the availability of vendor support, community forums, and other resources to assist with troubleshooting and optimization.

Best Practices for Effective SQL Server Monitoring
To get the most out of your SQL Server monitoring efforts, follow these best practices:
- Establish baseline performance metrics:
- Measure normal performance levels during peak and off-peak hours
- Use these baselines to identify deviations and potential issues
- Set up proactive alerts and thresholds:
- Configure alerts for critical performance indicators
- Use intelligent thresholds that adapt to your server's typical behavior
- Regularly review and analyze monitoring data:
- Schedule time to review performance trends and reports
- Look for patterns that may indicate emerging issues or areas for optimization
- Implement a continuous improvement process:
- Use monitoring insights to drive ongoing performance optimization
- Regularly update monitoring configurations to align with changing business needs
- Monitor from the application perspective:
- Track end-user experience and application performance
- Correlate database performance with overall application health
- Balance monitoring overhead:
- Ensure that monitoring activities don't significantly impact server performance
- Use lightweight monitoring methods for continuous tracking and more intensive tools for deep-dive analysis
Implementing SQL Server Monitoring with SigNoz
SigNoz offers a comprehensive solution for SQL Server monitoring, combining powerful features with ease of use. Key benefits include:
- Unified monitoring platform: Monitor SQL Server alongside other applications and infrastructure components
- Open-source flexibility: Customize and extend monitoring capabilities to fit your specific needs
- Cloud-native architecture: Easily scale your monitoring solution as your database environment grows
- Advanced analytics: Leverage machine learning for anomaly detection and performance prediction
To get started with SigNoz for SQL Server monitoring:
SigNoz Cloud is the easiest way to run SigNoz. Sign up for a free account and get 30 days of unlimited access to all features.

You can also install and self-host SigNoz yourself since it is open-source. With 24,000+ GitHub stars, open-source SigNoz is loved by developers. Find the instructions to self-host SigNoz.
- Install the SigNoz agent on your SQL Server hosts
- Configure data collection for your SQL Server instances
- Set up custom dashboards and alerts tailored to your monitoring needs
SigNoz's cloud offering provides a hassle-free setup and managed infrastructure, while the open-source version offers maximum control and customization options.
Challenges in SQL Server Monitoring and How to Overcome Them
Despite its importance, SQL Server monitoring comes with several challenges:
Dealing with large volumes of monitoring data:
Solution:
- Use efficient data storage and aggregation techniques
- Implement data retention policies to manage historical data effectively
Balancing monitoring overhead with performance impact:
Solution:
- Use lightweight monitoring methods for continuous tracking
- Schedule resource-intensive monitoring tasks during off-peak hours
Interpreting complex monitoring metrics:
Solution:
- Invest in training for your database team
- Use monitoring tools that provide clear visualizations and explanations of metrics
Addressing security concerns in monitoring practices:
Solution:
- Implement robust access controls for monitoring tools
- Ensure sensitive data is masked or encrypted in monitoring outputs
Future Trends in SQL Server Monitoring
The field of SQL Server monitoring is experiencing rapid advancements, driven by emerging technologies and evolving best practices. Here are some key trends to watch:
- AI and Machine Learning in Predictive Monitoring:
- Automated Anomaly Detection and Root Cause Analysis: AI-driven tools are increasingly being used to detect anomalies in SQL Server performance metrics automatically. These systems can identify unusual patterns or deviations from normal behavior, helping administrators address potential issues before they escalate. Additionally, AI can assist in pinpointing the root cause of performance problems, reducing the time spent on troubleshooting.
- Predictive Capacity Planning and Performance Optimization: Machine learning models are being leveraged to predict future resource needs based on historical data. This allows organizations to plan for capacity upgrades and optimize performance proactively, ensuring that their SQL Server environments can handle growing workloads without performance degradation.
- Cloud-Based and Hybrid Monitoring Solutions:
- Seamless Monitoring of On-Premises, Cloud, and Hybrid SQL Server Environments: As more organizations adopt cloud and hybrid infrastructures, the demand for monitoring solutions that can seamlessly track performance across different environments is increasing. These tools provide a unified view of SQL Server performance, whether the database is hosted on-premises, in the cloud, or in a hybrid setup.
- Integration with Cloud-Native Monitoring and Observability Platforms: Cloud-native monitoring platforms, such as those provided by major cloud service providers (e.g., Azure Monitor), are becoming more integrated with SQL Server monitoring. This integration allows for enhanced observability, combining application performance monitoring (APM) with database metrics to provide a comprehensive view of system health.
- Integration with DevOps and Continuous Deployment Practices:
- Incorporation of Database Performance Metrics into CI/CD Pipelines: As DevOps practices become more prevalent, there is a growing trend to include database performance monitoring as part of the continuous integration and deployment (CI/CD) pipeline. This integration ensures that performance issues are detected early in the development process, reducing the risk of deploying problematic code to production.
- Automated Performance Testing and Validation: Tools are being developed to automate performance testing as part of the deployment process. These tools validate that new code or database changes do not negatively impact performance, ensuring that only optimized, high-performing configurations are released.
- Automated Remediation and Self-Healing Database Systems:
- Intelligent Systems that Can Automatically Resolve Common Issues: Advances in AI and automation are leading to the development of self-healing systems that can automatically resolve common SQL Server issues. For example, these systems might automatically restart a service, reallocate resources, or apply a hotfix when an issue is detected, reducing the need for manual intervention.
- Self-Tuning Databases that Optimize Performance Based on Monitoring Insights: Self-tuning databases are becoming more sophisticated, using continuous monitoring data to adjust configurations, optimize queries, and manage resources dynamically. This leads to improved performance and efficiency without the need for constant manual tuning by database administrators.
By staying informed about these trends and adopting advanced monitoring practices, you can ensure that your SQL Server environments remain performant, reliable, and ready to meet future challenges.
FAQs
What are the most important metrics to monitor in SQL Server?
Key metrics to monitor include:
- CPU utilization
- Memory usage (buffer cache hit ratio, page life expectancy)
- Disk I/O (read/write latency, queue length)
- Query performance (execution time, plan cache hit ratio)
- Wait statistics
- Database growth and free space
How often should I review my SQL Server monitoring data?
Review high-level metrics daily, conduct weekly in-depth analysis of performance trends, and perform monthly or quarterly comprehensive reviews of long-term patterns and capacity planning.
Can SQL Server monitoring tools impact database performance?
Yes, monitoring tools can impact performance, especially if not configured properly. Choose lightweight monitoring methods for continuous tracking and use more intensive monitoring judiciously during off-peak hours.
What's the difference between reactive and proactive monitoring?
Reactive monitoring involves responding to issues after they occur, while proactive monitoring aims to identify and address potential problems before they impact users or operations. Proactive monitoring typically involves setting up alerts, analyzing trends, and taking preventive actions based on monitoring data.
