10 Essential SRE Metrics for Reliable Systems
Site Reliability Engineering (SRE) metrics guide your system's performance and reliability. In the fast-paced world of DevOps, success begins with effective monitoring. By blending software development with IT operations, SRE builds resilient, scalable systems that balance speed with reliability. SRE ensures visibility into system health and performance through data-driven metrics and cross-team collaboration.
As systems grow more complex, accurate, actionable metrics become essential. But which metrics truly matter? And how can they be implemented effectively? This guide dives into these questions, equipping you with the tools to enhance reliability and take your systems to the next level.
What are SRE Metrics and Why Are They Important?
Site Reliability Engineering (SRE) is a discipline that bridges software development and IT operations, applying engineering principles to improve system reliability, scalability, and efficiency. At its core, SRE focuses on automation, observability, and continuous improvement to ensure seamless operations.
SRE metrics are quantifiable measures that provide actionable insights into a system’s health, performance, and reliability. They serve as critical tools for identifying potential issues, guiding proactive management, and driving informed decision-making.
Why Are SRE Metrics Crucial?
- Objective Insights: Enable teams to rely on data, not intuition, for decision-making.
- Proactive Management: Highlight potential risks before they impact end users.
- Continuous Improvement: Track the effectiveness of changes and optimizations over time.
- Business Alignment: Directly correlate technical performance with user experience and business outcomes.
By fostering a data-driven culture, SRE metrics empower teams to communicate effectively and prioritize reliability without compromising development speed. This approach has been popularized by companies like Google, where SRE originated in 2003 under Ben Treynor, who described it as:
“What happens when you ask a software engineer to design an operations function.”
Modern SRE practices leverage tools to monitor Service-Level Indicators (SLIs), Service-Level Objectives (SLOs), and Service-Level Agreements (SLAs)—the pillars of measuring system reliability. By embedding these metrics into DevOps workflows, organizations can better navigate the complexities of distributed systems and ensure long-term resilience.
The Four Golden Signals: Foundation of SRE Metrics
Google's SRE team introduced the concept of Four Golden Signals — a set of metrics that provide a holistic view of system health. These signals form the cornerstone of effective SRE practices:

- Latency: How long does it take to serve a request?
- Traffic: How many requests is your system handling?
- Errors: How often do requests fail?
- Saturation: How close is your system to its capacity?
Let's dive deeper into each of these signals:
Latency
Latency measures the time it takes for a system to respond to a request. High latency can frustrate users and lead to churn, especially in applications like e-commerce or streaming, where speed is crucial.
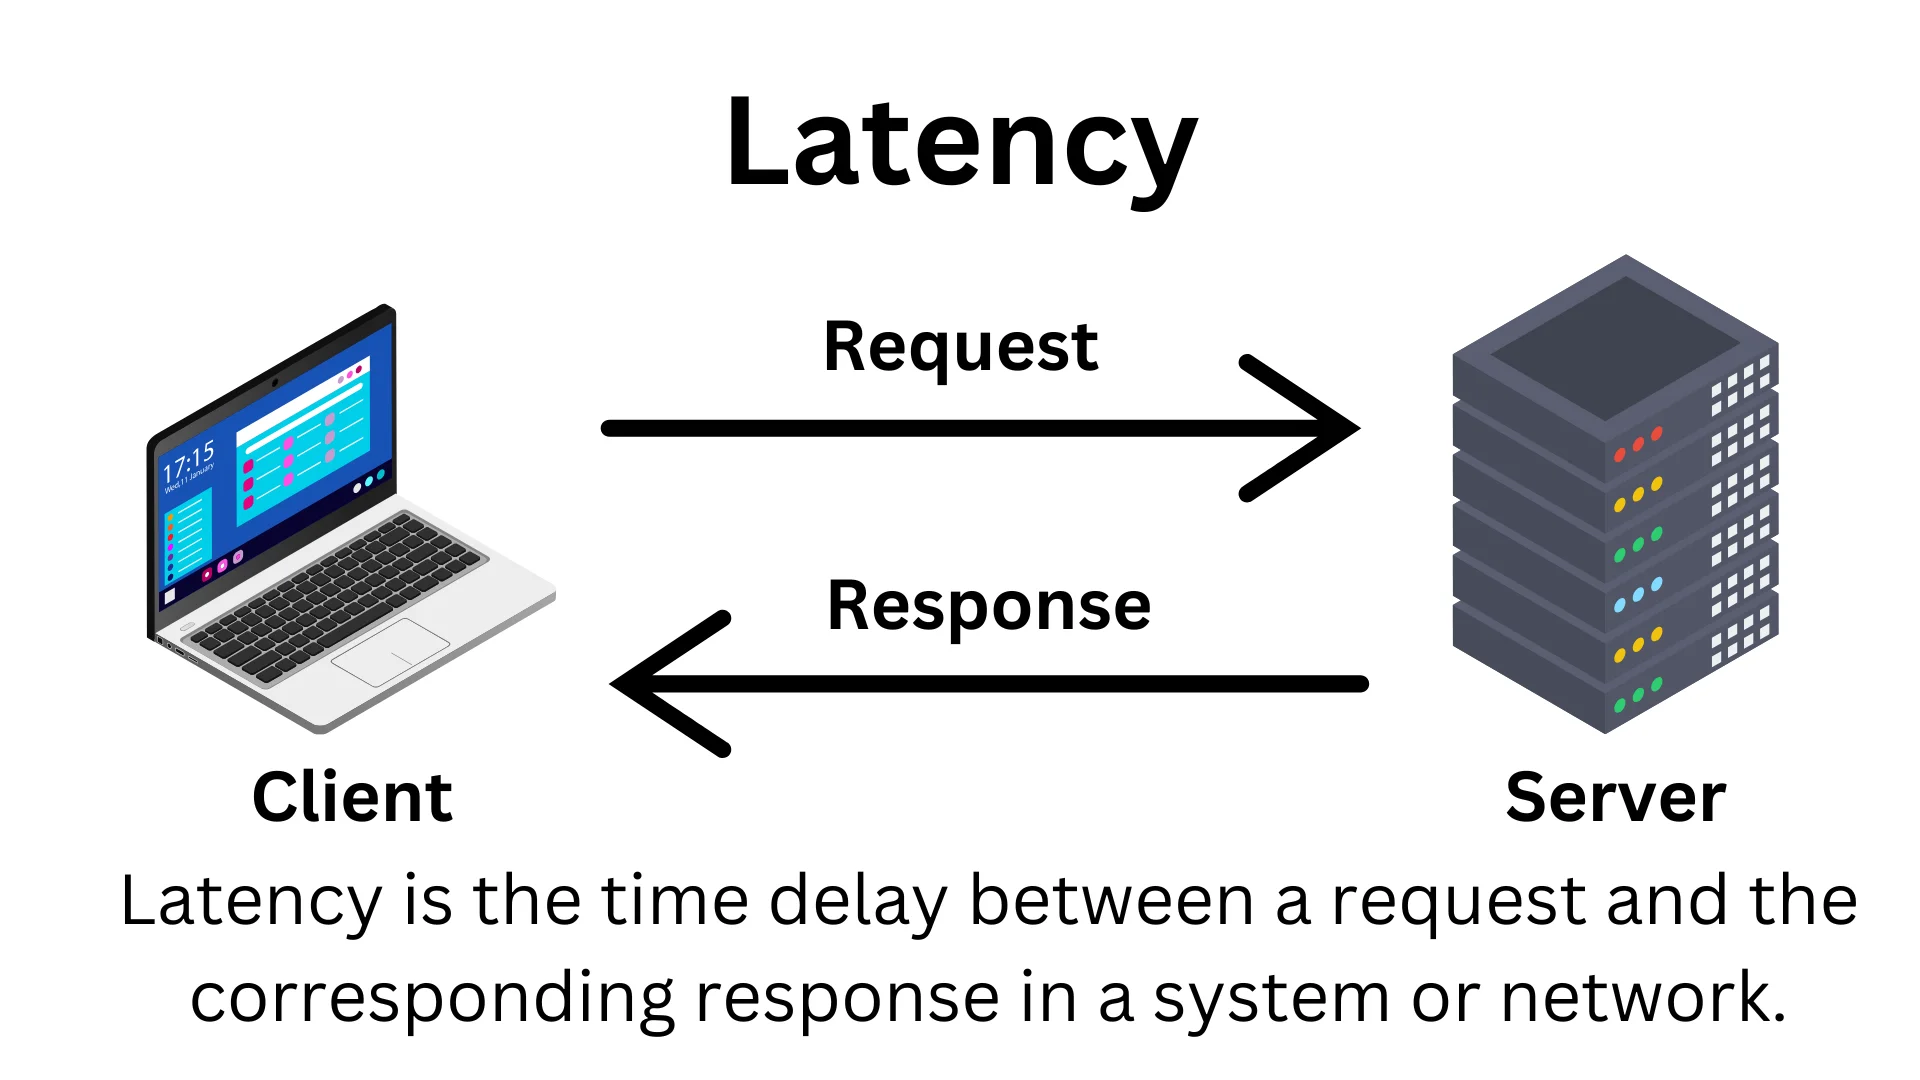
Imagine a streaming service with latency exceeding 3 seconds. Users may perceive buffering as a failure, leading to subscription cancellations. It's critical to monitor average latency and focus on percentiles (e.g., 95th or 99th) to capture edge cases that affect user experience.
Key Considerations:
- Measure both successful and failed requests separately, as failures can skew the average.
- Use percentiles (e.g., 95th or 99th) instead of averages to capture a more accurate range of user experiences.
- Establish baselines and thresholds based on application type and user expectations.
Tools & Implementation:
- SigNoz: Set up latency metrics for your endpoints and visualize trends with real-time dashboards. SigNoz offers detailed insights into transaction latency, allowing you to track both average and percentile latency for various endpoints.
- New Relic or DataDog: Monitor transaction-level latency in real-time.
- Configure alerts for thresholds like response times exceeding 500ms for critical endpoints.
- Correlate latency spikes with other metrics like traffic or saturation to diagnose root causes.
Example: A surge in latency during peak traffic might reveal the need for database query optimization or scaling.
Traffic
Traffic reflects the volume of demand on your system, such as API requests or active users. Monitoring traffic helps identify trends, anticipate scaling needs, and detect anomalies like traffic surges due to DDoS attacks or misconfigurations.
A sudden 5x increase in API requests during a flash sale could crash the system without adequate preparation. Understanding traffic patterns allows teams to plan capacity and maintain uptime during such spikes.
Key Considerations:
- Define what "traffic" means for your system—this could range from API calls to active user sessions.
- Monitor real-time and historical traffic to detect usage patterns and anomalies.
- Use monitoring tools like Prometheus or Datadog to correlate traffic with latency and saturation, identifying how rising demand impacts system performance. This helps pinpoint bottlenecks, such as CPU limits or database locks, and enables optimized scaling and resource allocation to prevent degradation.
Tools & Implementation:
- SigNoz: Monitor traffic, latency, and errors with integrated dashboards that provide actionable insights into system performance.
- Grafana Dashboards: Visualize request rates and identify peak times.
- Google Cloud Monitoring: Analyze historical traffic trends for capacity planning.
- AWS Auto Scaling: Configure autoscaling for application servers based on traffic data.
- PagerDuty: Receive real-time alerts when traffic surges are detected.
Example: Configuring autoscaling for application servers based on traffic patterns ensures your system adapts to demand fluctuations.
.webp)
Auto-Scaling
Errors
Errors track the rate of failed requests, whether they’re caused by server-side issues (500-level errors), client errors (400-level), or third-party integrations. Monitoring errors helps teams prioritize fixes and maintain user trust.
A 5% error rate in payment gateway requests can lead to significant revenue loss and user dissatisfaction. Categorizing errors (e.g., payment failures vs. UI glitches) helps in prioritizing resolutions effectively.
.webp)
Error Rate
Key Considerations:
- Categorize errors (e.g., client-side, server-side, or third-party dependency failures).
- Set up error budgets to balance reliability with feature delivery velocity.
- Use logs and metrics to pinpoint failure causes and prioritize fixes.
Tools & Implementation:
- ELK Stack or Splunk: Aggregate and analyze logs to pinpoint error causes.
- Sentry: Track errors in real time and alert teams with detailed stack traces.
- Set error budgets (e.g.,
<2% errors per month) to align reliability with development velocity. - Implement automated retries for transient errors and configure alerts for consistent spikes in failures.
Example: Integrating automated incident response workflows for error spikes can significantly reduce downtime.
Saturation
Saturation measures resource usage, such as CPU, memory, and disk space, relative to their capacity. Overloaded resources can lead to degraded performance or system crashes.
A database server operating at 90% disk I/O capacity may slow down application queries, causing latency spikes and failed transactions. Proactive monitoring of saturation can prevent such issues.
.webp)
Saturation
Key Considerations:
- Track key resources like CPU, memory, disk throughput, and network bandwidth.
- Proactively set thresholds for resource usage to prevent degradation before reaching full capacity.
- Monitor saturation trends to anticipate scaling needs.
Tools & Implementation:
- Nagios or CloudWatch: Monitor CPU, memory, and storage metrics.
- Set resource utilization thresholds (e.g., 80% for CPU or memory).
- Use Kubernetes HPA (Horizontal Pod Autoscaler) to scale resources dynamically.
- Create dashboards to track saturation alongside latency and traffic for a holistic view.
Example: Scaling up a database cluster during high write operations ensures consistent performance under load.
How to Implement the Four Golden Signals
Implementing the Four Golden Signals requires a systematic approach:
- Choose the right tools: Select monitoring and observability platforms that can collect and visualize these metrics effectively.
- Instrument your code: Add appropriate logging and metric collection points throughout your application.
- Set baselines: Establish normal operating ranges for each metric based on historical data.
- Configure alerts: Create alerting rules that trigger when metrics deviate significantly from baselines.
- Integrate with incident management: Ensure that alerts are routed to the appropriate teams and tied into your incident response workflows.
- Visualize data: Create dashboards that provide at-a-glance views of system health based on these signals.
Remember, the goal is not just to collect data, but to make it actionable. Regular reviews and refinements of your metrics and alerting strategies are essential.
Beyond the Golden Signals: Additional SRE Metrics
While the Four Golden Signals provide a solid foundation, additional metrics can offer deeper insights into your system's reliability:
Availability
Availability measures the percentage of time your system is operational and accessible to users. It's often expressed as a number of nines (e.g., 99.9% uptime). Availability directly impacts user trust and business reputation. High availability ensures minimal disruption, especially for mission-critical applications.
To calculate availability:
Availability = (Total Time - Downtime) / Total Time * 100
Set clear Service Level Objectives (SLOs) for availability and track your performance against these targets.
Throughput
Throughput measures the rate at which your system processes requests. It's closely related to traffic but focuses on the system's output rather than input. Monitoring throughput helps teams assess system performance under varying loads, ensuring scalability and optimal resource allocation.
Key considerations for throughput:
- Measure in relevant units (e.g., requests per second, transactions per minute).
- Monitor trends to identify capacity needs and performance improvements.
- Correlate with resource utilization to optimize efficiency.
Mean Time to Detect (MTTD)
MTTD measures how quickly you become aware of issues in your system. Reducing MTTD is crucial for minimizing the impact of incidents. Reducing MTTD minimizes the impact of system failures by enabling faster incident resolution.
To understand MTTD, have a look at the below example:
Consider three incidents:
- Incident 1: Occurred at 8:00 AM, detected at 8:30 AM (30 minutes).
- Incident 2: Occurred at 3:00 PM, detected at 3:20 PM (20 minutes).
- Incident 3: Occurred at 11:00 PM, detected at 12:00 AM (60 minutes).
Calculation:

To improve MTTD:
- Implement comprehensive monitoring and alerting.
- Use anomaly detection and AI-powered analytics.
- Foster a culture of vigilance and quick communication.
Mean Time to Resolve (MTTR)
MTTR tracks how long it takes to resolve issues once they're detected. It's a key indicator of your team's incident response effectiveness. Lower MTTR reflects a team's efficiency in mitigating downtime and restoring normalcy, which is vital for customer satisfaction.
Strategies to reduce MTTR:
- Develop and refine incident response playbooks. For example, create a database outage playbook that includes steps for failing over to a replica and notifying stakeholders.
- Implement automation for common remediation tasks. For instance, automatically restart a crashed service when CPU utilization exceeds a defined threshold.
- Conduct thorough post-mortems to prevent recurring issues. For example, after a server crash caused by memory leaks, deploy monitoring to alert the team when memory usage spikes.
Change Failure Rate
This metric measures the percentage of changes (e.g., deployments, updates) that result in degraded service or require remediation. A lower change failure rate indicates a more robust development pipeline and fewer disruptions due to updates.
To use change failure rate effectively:
- Track all changes and their outcomes.
- Analyze failures to identify common causes.
- Use the insights to improve your development and deployment processes.
How to Choose the Right SRE Metrics for Your System
Selecting the right metrics for your system requires careful consideration:
- Align with business objectives: Metrics should reflect what matters to your business and customers. For example, a high-frequency trading platform would prioritize metrics like extremely high uptime (e.g., 99.999%) over broader measures like reliability growth.
- Consider your architecture: Metrics like latency, availability, and error rates should be assessed from the user's perspective to ensure they improve user satisfaction and the system's overall dependability.
- Balance leading and lagging indicators: Use a mix of metrics that predict potential issues (leading indicators) and those that measure past performance (lagging indicators). For instance, tracking error budgets as a leading indicator can help avoid breaches of service-level agreements (SLAs).
- Start small and iterate: Metrics should be specific to your system’s design. For instance, containerized applications may benefit from metrics like pod restarts or Kubernetes resource utilization.
- Involve all stakeholders: As your system evolves, revisit and update your metrics to reflect current reliability needs, new technologies, or changing business priorities.
- Prioritize Actionable Metrics: Choose metrics that not only indicate problems but also provide insights into how to fix them. Metrics like mean time to repair (MTTR) or error rates can guide actionable responses.
- Benchmarking and Coverage: Ensure your metrics are comprehensive, covering all critical components of your infrastructure. Use them to benchmark against industry standards while maintaining alignment with internal goals.

Remember, the goal is to have a set of metrics that provide actionable insights, not just data for data's sake.
Best Practices for Measuring and Improving SRE Metrics
To get the most value from your SRE metrics:
| Practice | Key Action | Example/Benefit |
|---|---|---|
| Implement Monitoring & Observability | Use tools like Prometheus, Datadog, Grafana for tracking metrics, logs, and traces. | Get real-time system visibility and early issue detection. |
| Set Clear SLOs | Define realistic Service Level Objectives aligned with business goals. | Example: Set a 99.9% uptime SLO for critical services. |
| Regular Post-Mortems & Improvement Cycles | Analyze incidents, identify root causes, and adjust processes. | Review trends to improve response and reduce bottlenecks. |
| Automate Monitoring | Automate data collection, metric analysis, and incident responses. | Example: Auto-remediate memory issues by restarting services. |
| Foster a Blameless Culture | Encourage open discussions on failures without assigning blame. | Focus on solutions and collective ownership of reliability. |
| Provide Continuous Education | Train the team on SRE tools, practices, and techniques regularly. | Access resources like SRE books, blogs, and workshops. |
| Encourage Shared Responsibility | Promote collaboration between development and operations teams. | Adopt a DevOps mindset; developers monitor their apps in production. |
Following these practices creates a feedback loop that continuously improves your system's reliability.
Leveraging SRE Metrics to Enhance DevOps Practices
SRE metrics can significantly enhance DevOps workflows by driving data-driven decisions:
- Inform capacity planning: Use traffic and saturation metrics with tools like AWS CloudWatch or Prometheus to forecast resource needs and avoid bottlenecks.
- Enhance CI/CD pipelines: Integrate error and performance metrics into deployment pipelines using Jenkins or GitHub Actions to ensure only stable builds are deployed.
- Drive automation: Define thresholds for key metrics like latency or error rates to trigger auto-scaling or failovers in Kubernetes or AWS.
- Facilitate better communication: Shared dashboards in tools like Grafana or Splunk align development and operations teams with a common understanding of system health.
By embedding metrics into DevOps, you enable a resilient and efficient development lifecycle.
Common Challenges in SRE Metric Implementation
While implementing SRE metrics, teams often face these challenges:
- Data overload: Avoid analysis paralysis by prioritizing actionable metrics like the "Four Golden Signals" (latency, traffic, errors, saturation).
- Alert fatigue: Tackle alert desensitization with best practices like deduplication, grouping alerts, and escalation policies.
- Metric accuracy: Ensure reliable data collection with consistent sampling intervals and robust error correction mechanisms.
- Cultural resistance: Combat skepticism with workshops or demos that show how metrics can drive informed decisions and faster resolution times.
- Tool complexity: Start small, using essential tools like Prometheus and Grafana, before scaling to more advanced stacks.
Addressing these challenges requires a mix of technical solutions and fostering a metrics-driven culture.
Emerging Trends in SRE Metrics
SRE practices are evolving rapidly. Stay ahead with these emerging trends:
- AI-driven analytics: Tools like Dynatrace and Splunk Observability use machine learning to predict failures and optimize reliability.
- User-centric metrics: RUM tools like Google Lighthouse and New Relic measure real-time user experience, driving customer satisfaction.
- Security integration: DevSecOps practices increasingly monitor security metrics like vulnerability scans and threat detection.
- Distributed tracing: Tools like Jaeger and OpenTelemetry enable end-to-end request tracing, critical for troubleshooting microservices.
- Chaos engineering: Platforms like Gremlin and Chaos Monkey simulate failures to test and improve system resilience.
Adopting these trends helps refine your SRE strategy and ensures your system meets modern demands.
Visualizing the SRE Metrics with SigNoz
Visualizing SRE metrics is crucial for making informed, data-driven decisions. SigNoz provides an intuitive and unified platform to monitor the Four Golden Signals—Latency, Traffic, Errors, and Saturation—alongside other key metrics. Here's how SigNoz helps you effectively visualize and manage these metrics:
SigNoz Cloud is the easiest way to run SigNoz. Sign up for a free account and get 30 days of unlimited access to all features.
You can also install and self-host SigNoz yourself since it is open-source. With 24,000+ GitHub stars, open-source SigNoz is loved by developers. Find the instructions to self-host SigNoz.
Latency
SigNoz allows you to track latency across various endpoints and services in real-time. You can set up detailed dashboards to monitor:
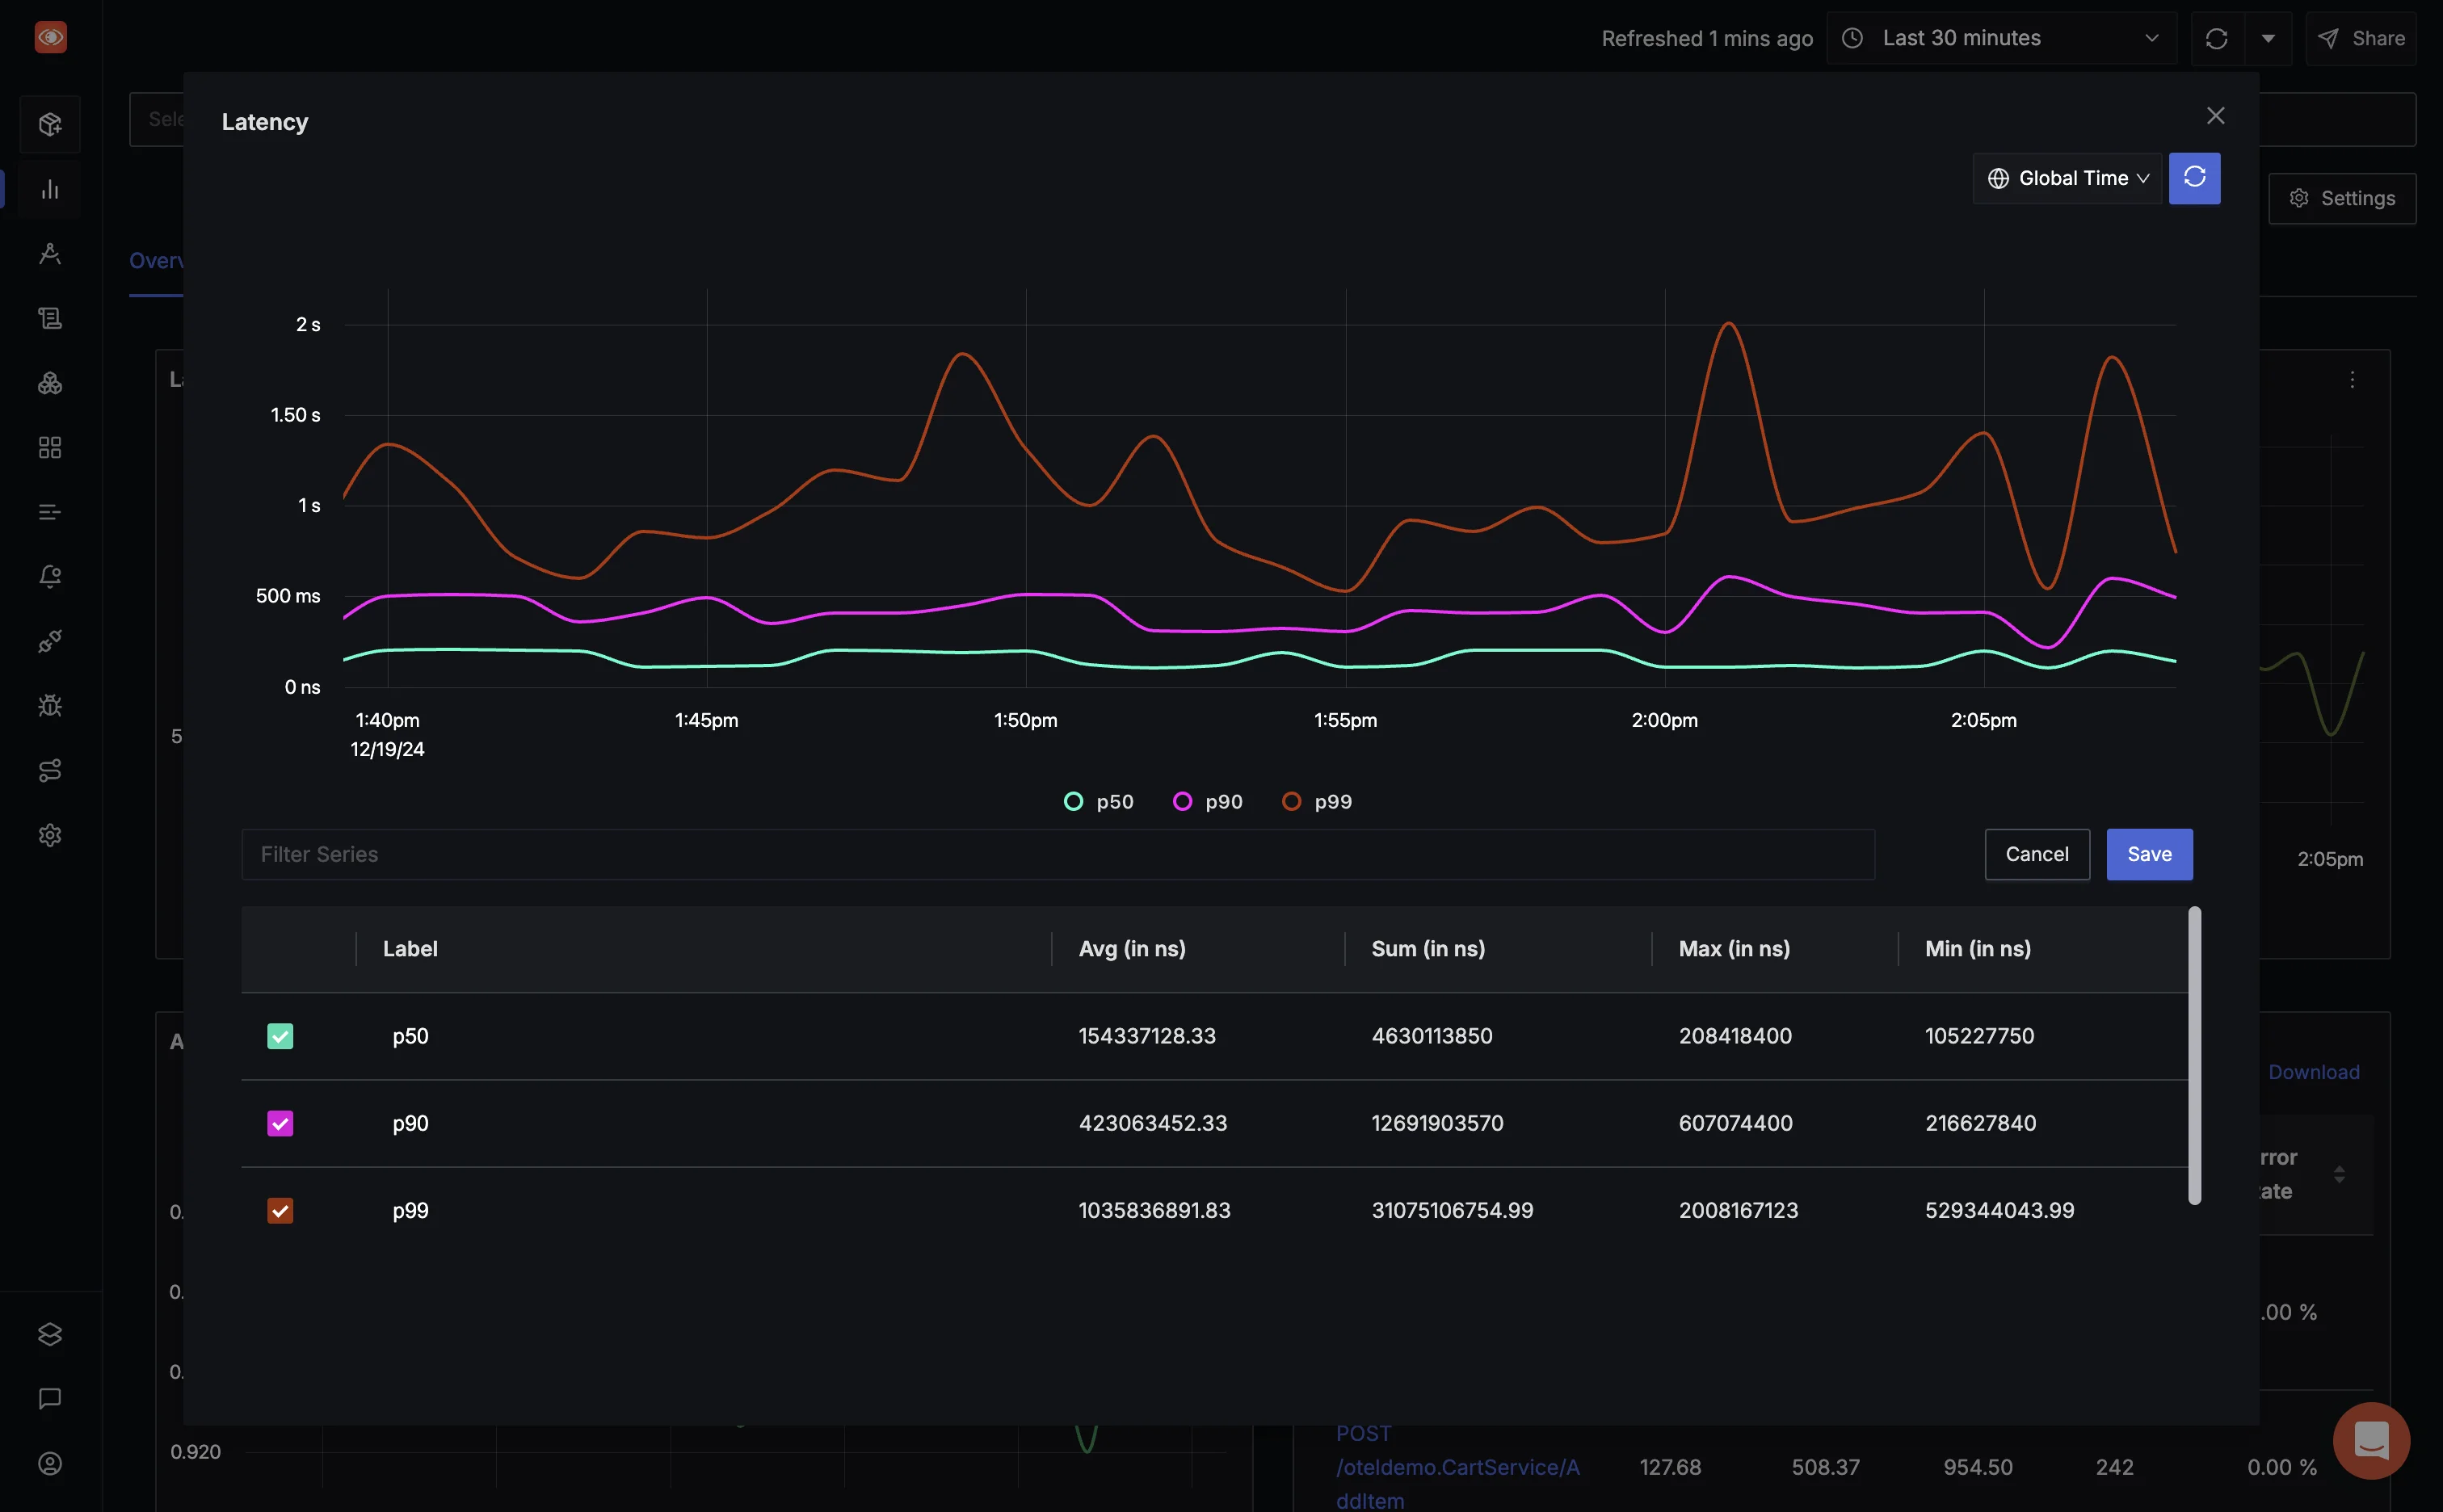
- Percentile Metrics (e.g., 95th, 99th): Focus on edge cases that might negatively impact user experience.
Using SigNoz, you can create alerts for latency thresholds, such as response times exceeding 500ms for critical services. With its OpenTelemetry integration, you can pinpoint high-latency endpoints and analyze distributed traces to identify bottlenecks.
Traffic
Monitor system traffic to understand the volume of requests and user interactions. SigNoz enables you to:
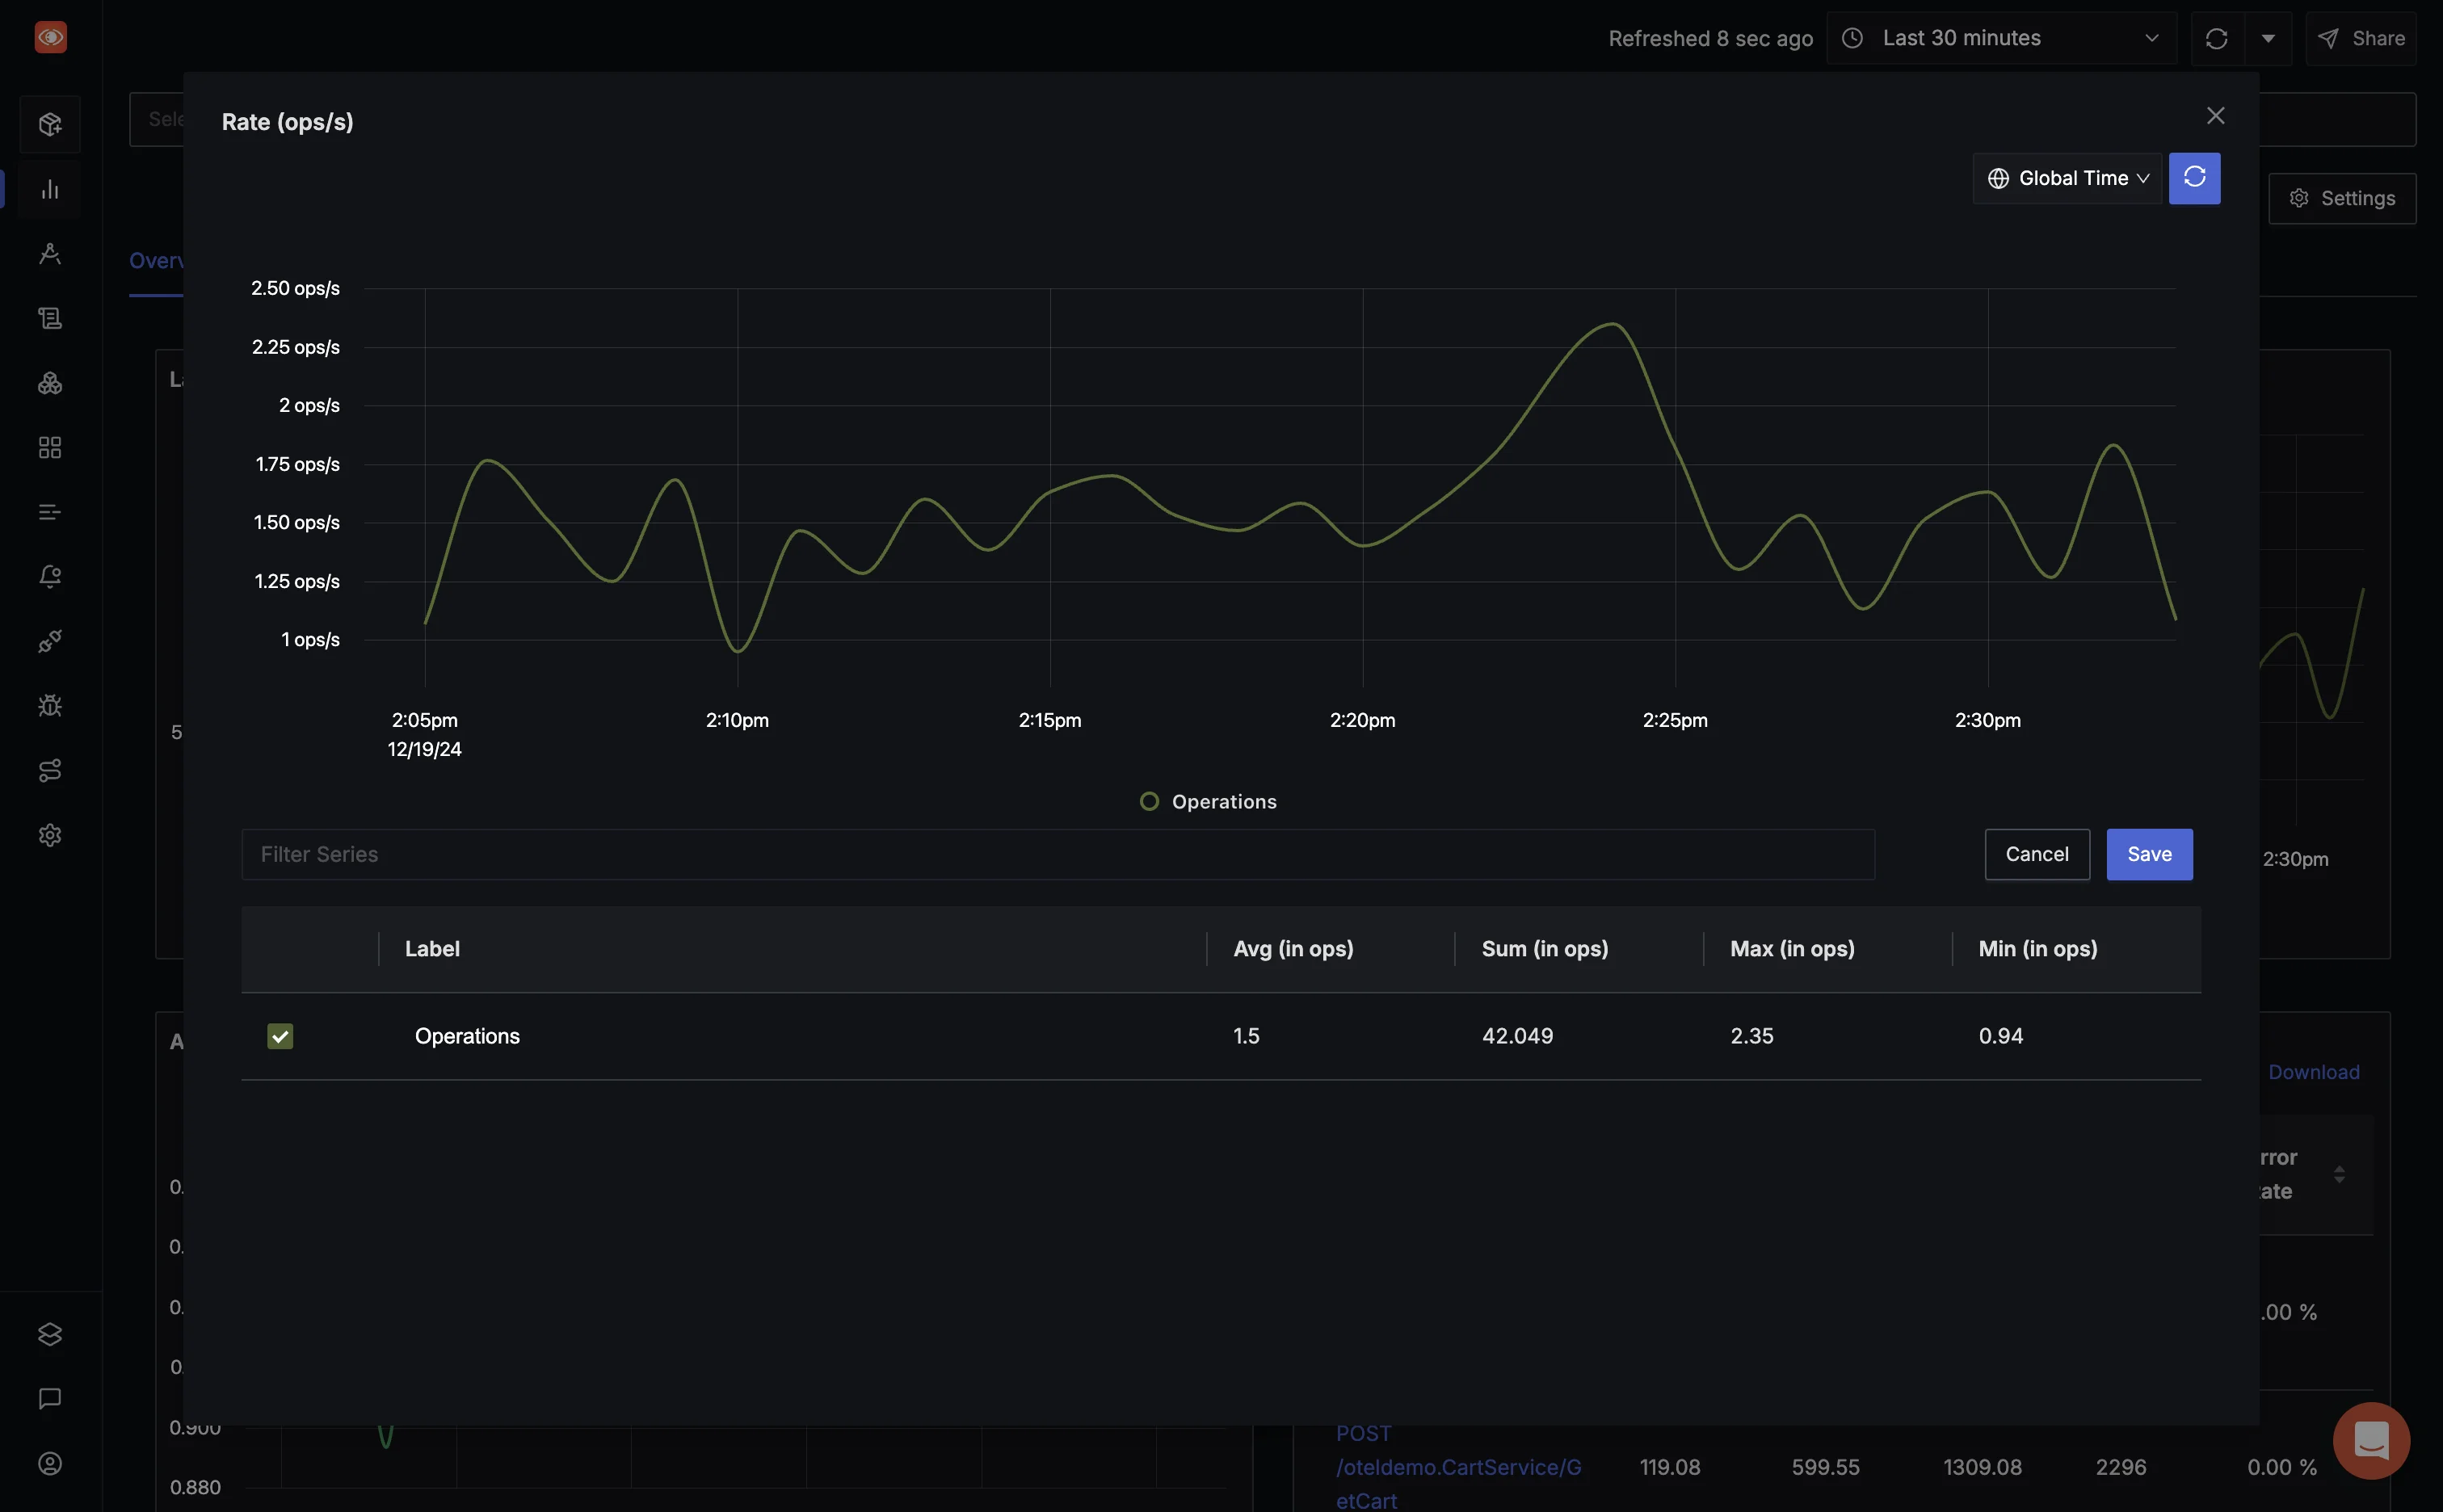
- Correlate Metrics: Connect traffic patterns with other metrics like latency and saturation to diagnose issues.
For example, during a flash sale, use SigNoz to ensure your system scales dynamically and handles increased demand seamlessly.
Errors
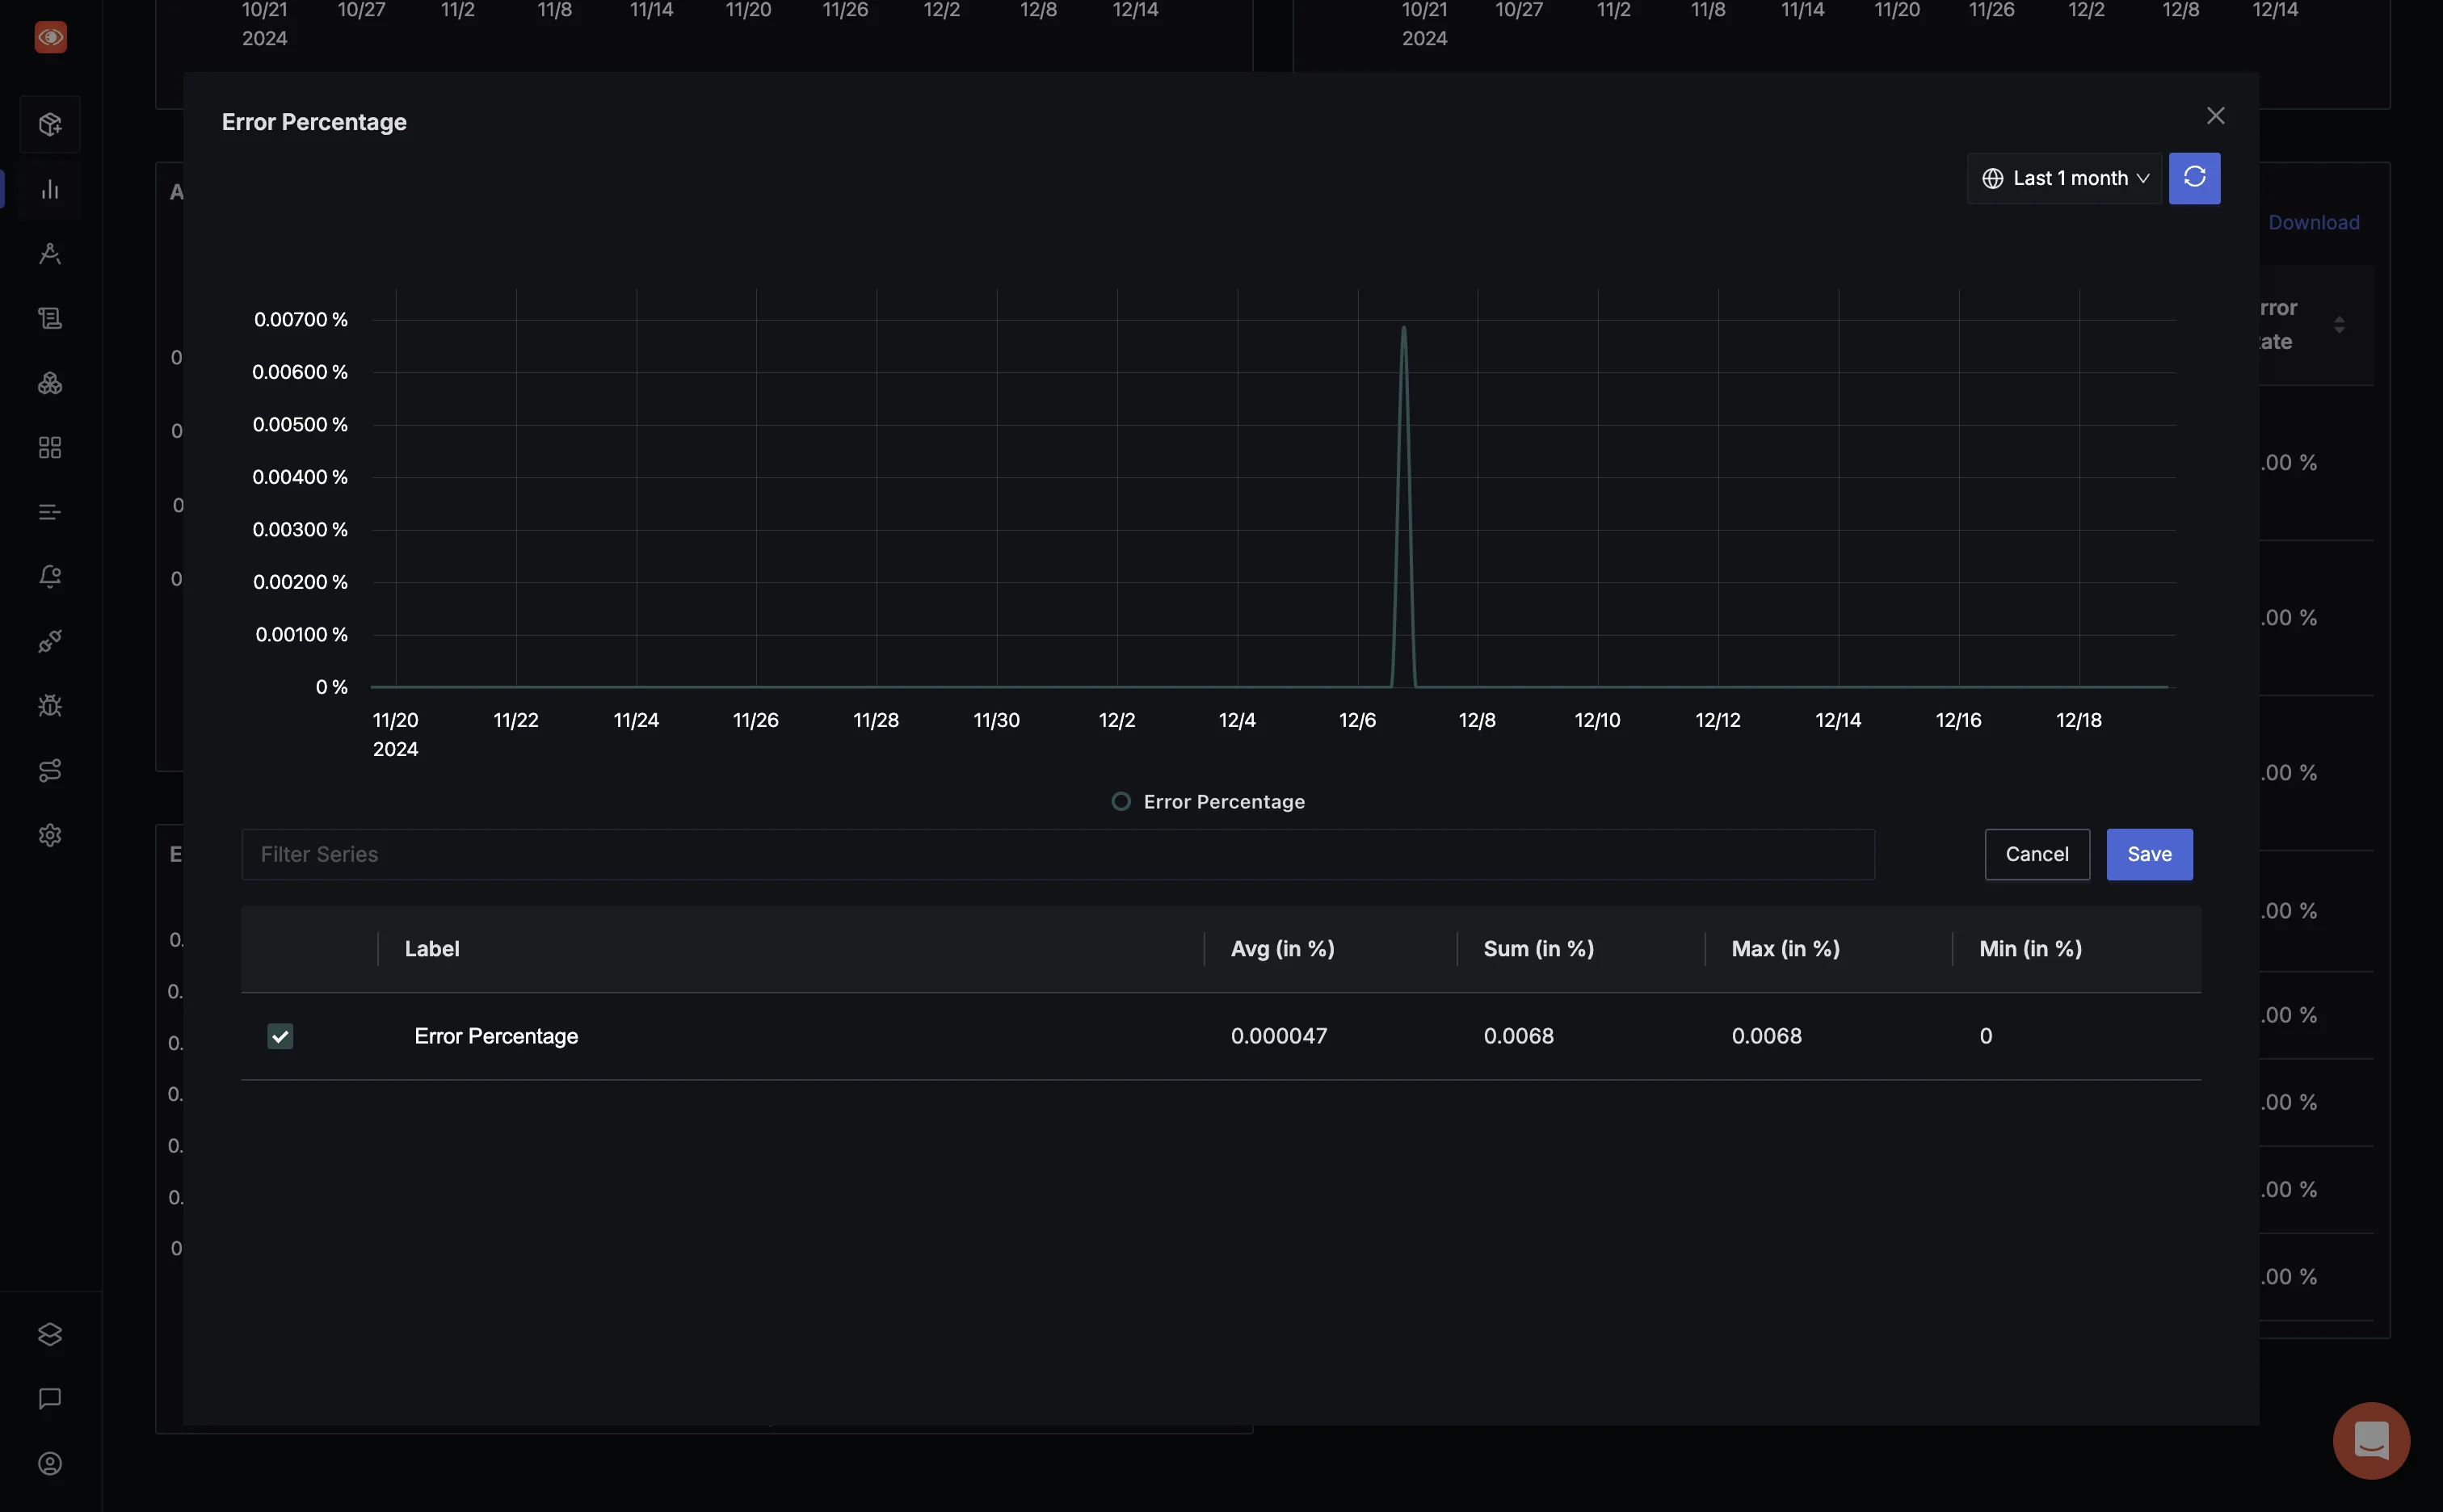
- Categorize Errors: Distinguish between client-side, server-side, and third-party issues.
- Analyze Trends: Identify recurring error patterns over time to proactively resolve issues.
- Set Error Budgets: Track error rates and ensure they align with your defined error budget policies.
With its detailed logs and trace data, SigNoz helps you trace the root cause of errors quickly, minimizing downtime and improving reliability.
Saturation
Stay ahead of resource exhaustion by monitoring saturation metrics such as CPU, memory, and disk utilization.
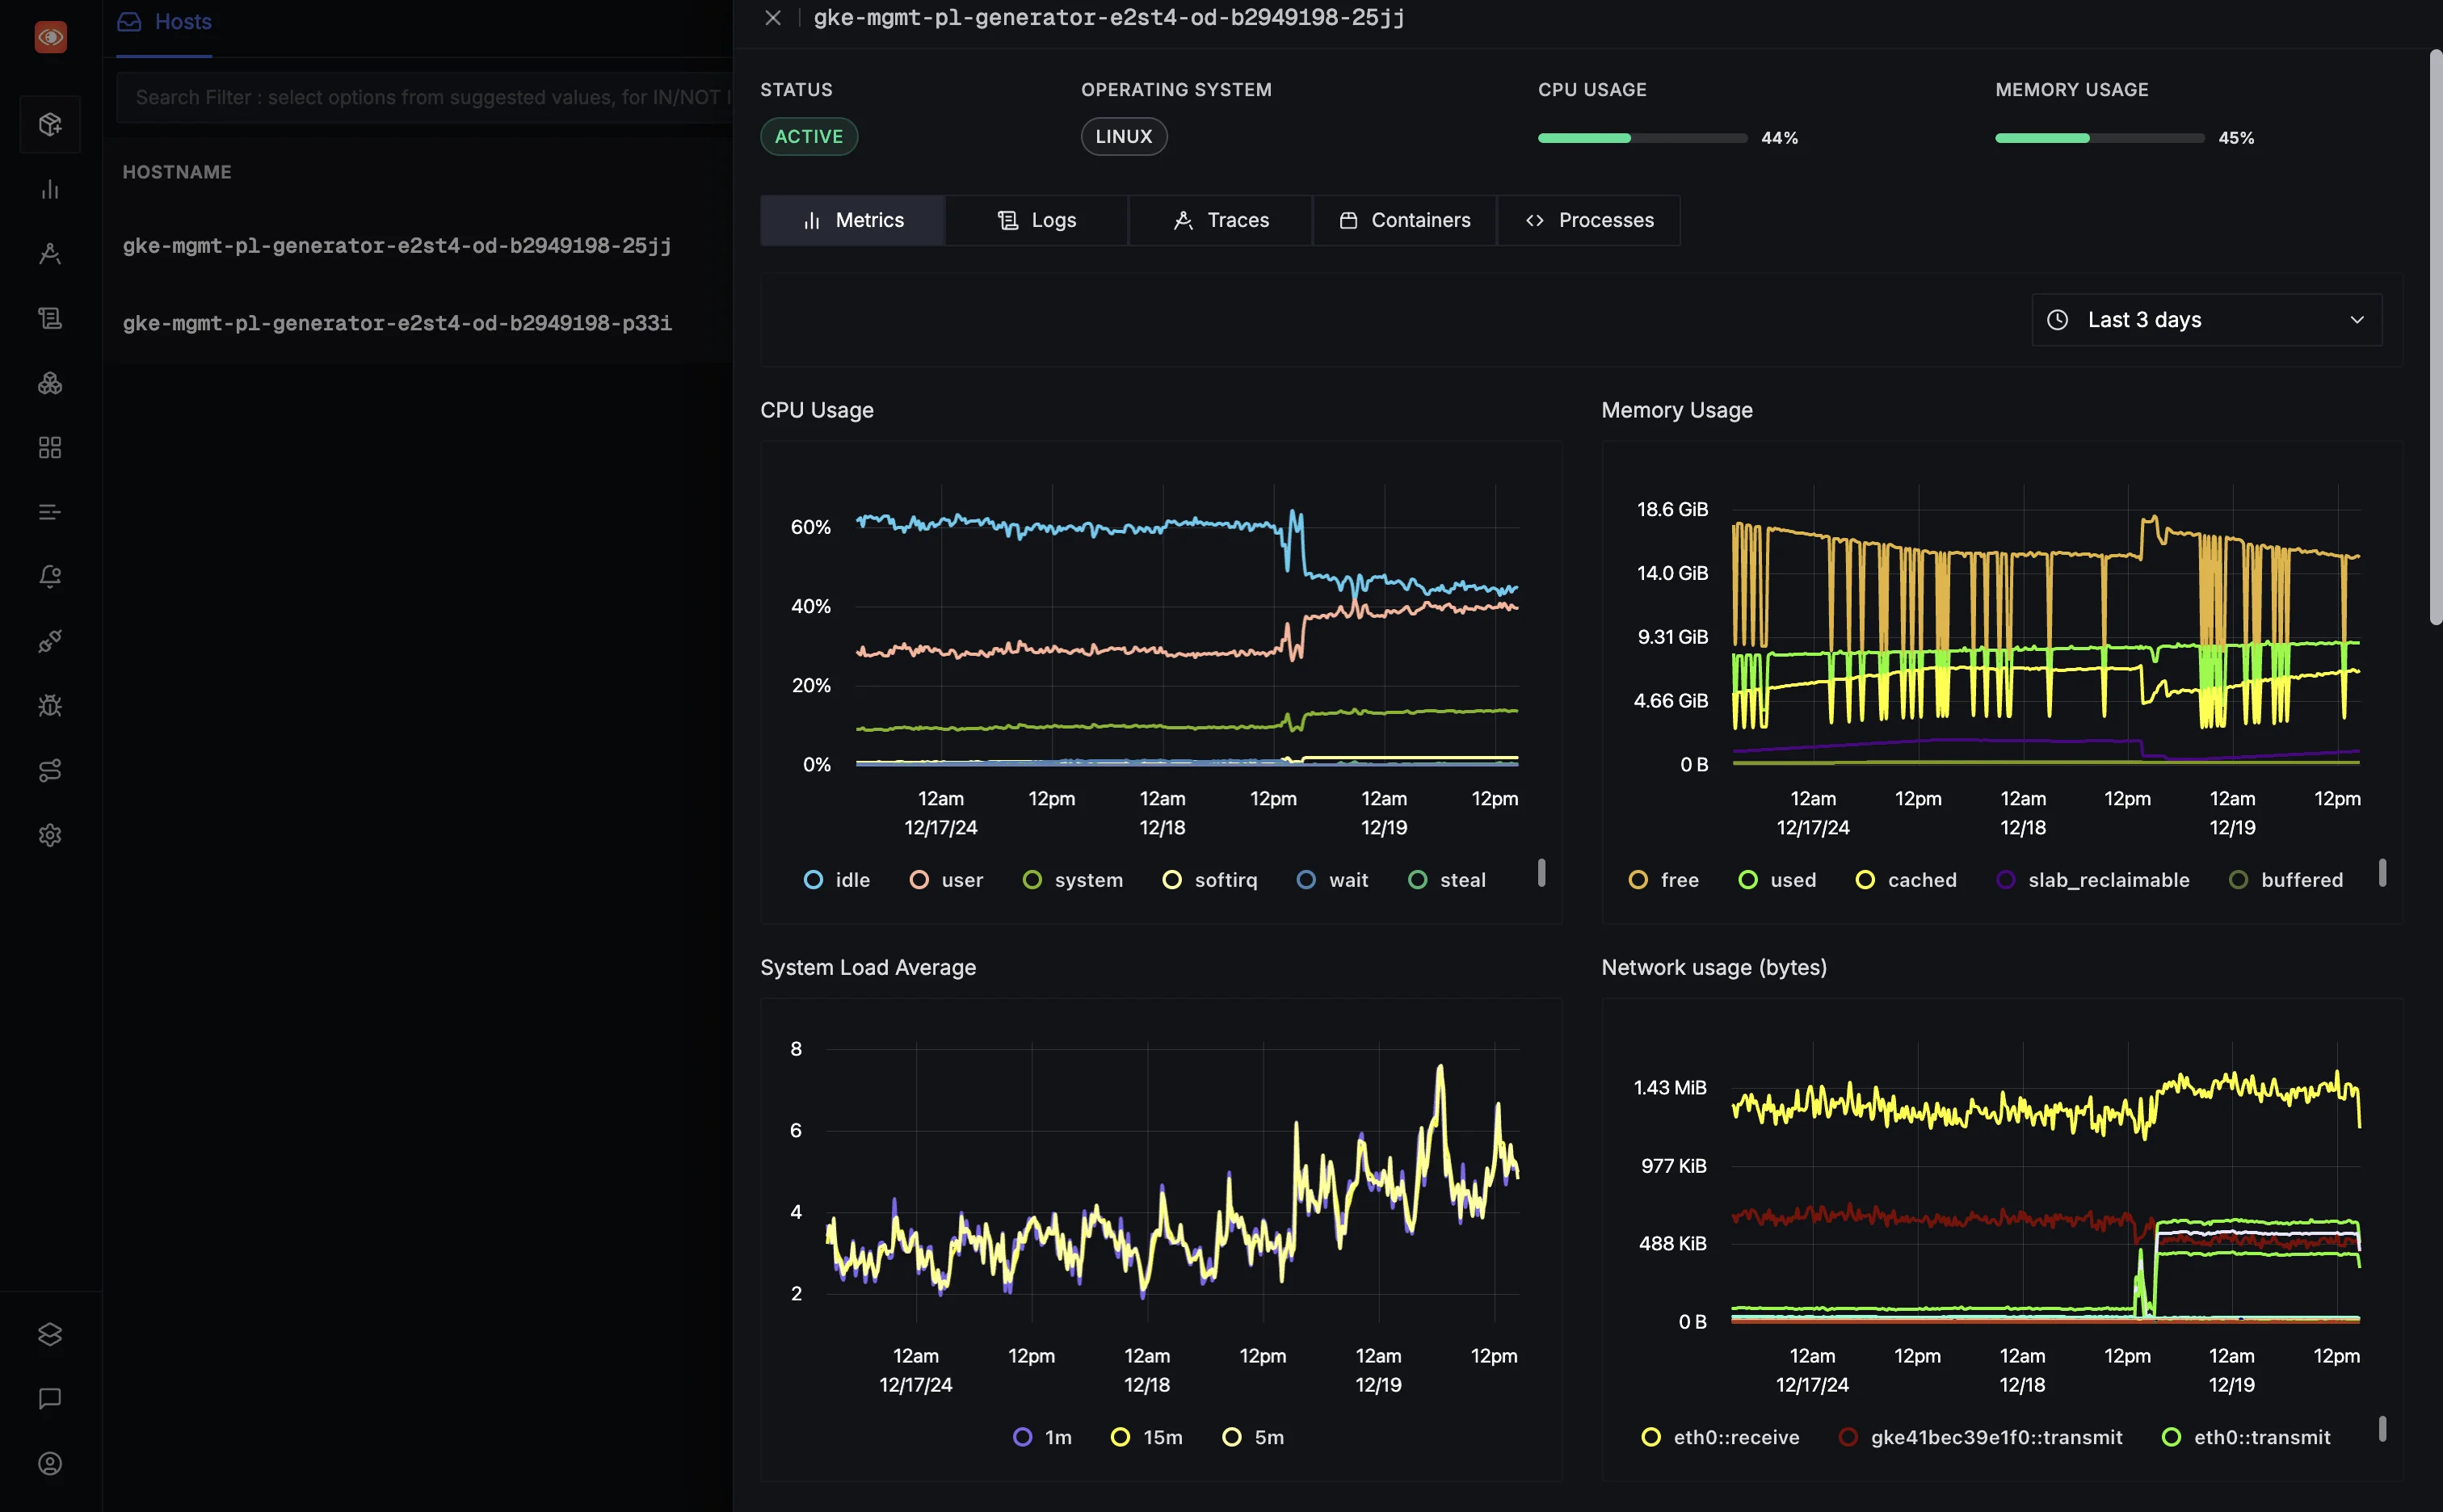
- Set Resource Alerts: Receive notifications when resources approach critical thresholds (e.g., 80% CPU usage).
- Plan for Scaling: Use saturation trends to forecast capacity needs and plan resource allocation effectively.
- Correlate with Traffic and Errors: Understand how saturation impacts other metrics and optimize system performance.
Custom Dashboards and Alerts
SigNoz's custom dashboard capabilities allow you to combine metrics into a unified view. This holistic perspective ensures your team has all the necessary insights at their fingertips. Additionally, SigNoz supports:
- Real-Time Alerts: Notify teams about anomalies via email, Slack, or other communication tools.
- Historical Data Analysis: Dive deep into historical trends to inform capacity planning and system optimization.
Getting Started with SigNoz
To begin visualizing your SRE metrics with SigNoz:
- Setup SigNoz: Follow the installation guide to deploy SigNoz on your preferred environment.
- Integrate OpenTelemetry: Set up instrumentation for your applications using OpenTelemetry SDKs.
- Define Metrics and Alerts: Configure custom dashboards and alerts tailored to your system’s needs.
- Monitor and Optimize: Use SigNoz's insights to continuously improve system reliability and performance.
By leveraging SigNoz, you gain a powerful tool to transform raw data into actionable insights, enhancing both system reliability and user experience.
Key Takeaways
- SRE metrics are essential for maintaining reliable, high-performance systems.
- The Four Golden Signals provide a solid foundation for SRE practices.
- Additional metrics like availability, throughput, and MTTR offer deeper insights.
- Choosing the right metrics requires alignment with business goals and system architecture.
- Implement best practices like establishing clear SLOs and fostering a blameless culture.
- Tools like SigNoz can significantly simplify SRE metric implementation and analysis.
FAQs
What's the difference between SRE metrics and traditional IT monitoring?
SRE metrics focus on user-centric, service-level indicators that directly impact reliability and performance. Traditional IT monitoring often emphasizes system-level metrics that may not directly correlate with user experience.
How often should we review and update our SRE metrics?
Review your metrics at a minimum quarterly. However, in fast-paced environments, monthly reviews can help you stay ahead of emerging issues and opportunities for improvement.
Can small teams or startups benefit from implementing SRE metrics?
Absolutely. SRE metrics can help teams of any size improve their system reliability and efficiency. Start with the core metrics and scale your practices as your team and system grow.
How do SRE metrics relate to customer satisfaction and business outcomes?
SRE metrics directly impact user experience. For example, low latency and high availability translate to satisfied customers, while frequent errors can lead to frustration and churn. By improving these metrics, you directly enhance customer satisfaction and business outcomes.
