What is APM - Implementation and Best Practices
Application Performance Monitoring (APM) is a critical tool in modern software development and operations. It helps ensure your applications run smoothly, and efficiently, and meet user expectations. APM provides real-time insights into your application's performance, allowing you to identify and resolve issues quickly. This article explores APM's core concepts, implementation strategies, and best practices to help you optimize your software performance.
What is Application Performance Monitoring (APM)?
APM is a comprehensive approach to tracking, analyzing, and optimizing the performance of software applications. It involves collecting and analyzing data from various components of your application stack to ensure optimal performance and user experience. APM is not just a single tool or practice; it's an integrated set of strategies and tools designed to give a holistic view of an application's performance. This comprehensive approach means monitoring everything from server resources to application code execution and user interactions. By considering the entire application stack, APM ensures that every potential performance issue is visible and manageable. Unlike general system monitoring, which focuses on hardware and network metrics, APM provides deeper insights into application-specific performance, offering a more detailed understanding of user experience and behavior.
Key components of APM include:
- Metrics: Metrics are quantitative metrics that provide different aspects of an application's performance in a numerical representation. They provide a high-level overview of the functionality and state of the system. Common metrics include resource utilization (CPU, memory, and disc usage), error rates (the frequency of errors occurring), and response times (the amount of time it takes for the program to react to a request).
- Traces: Traces provide detailed records of transactions as they flow through an application. They track the path of individual requests and show how they interact with various system components. Traces can show how a user request moves through different services, databases, and third-party APIs. They highlight the duration of each step, helping to identify slow or failing components.
- Logs: Logs are text-based records of events and errors within an application. They provide a chronological record of what has happened within the system. Logs can include error messages, debug information, and audit trails. They record events such as user logins, database queries, and application errors.
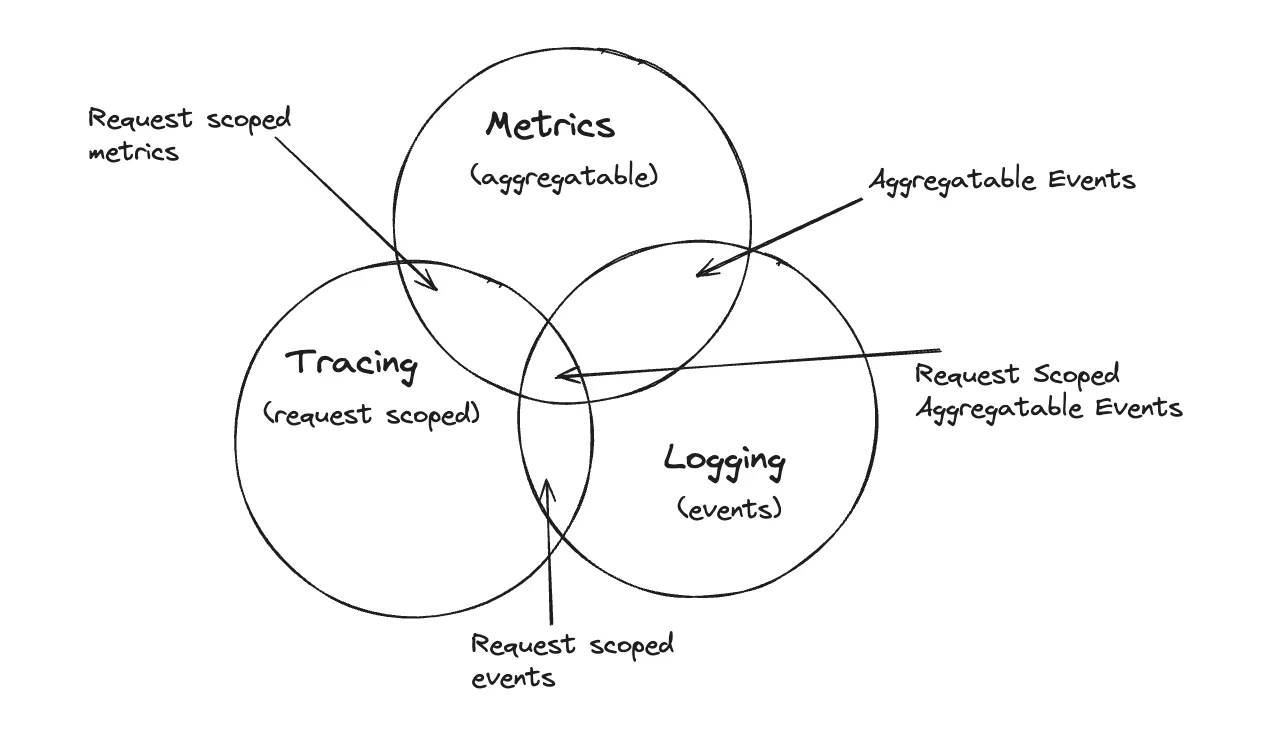
APM has evolved significantly with modern software development practices. It now encompasses not just server-side monitoring but also client-side performance, distributed systems, and cloud-native architectures. Combining metrics, traces, and logs provides a comprehensive view of application performance. We at SigNoz don’t think logs, metrics and traces as different pillars but as mesh working together, thinking of them as isolated pillars can create a false dichotomy. To know more about it, you can visit the Olly Beginner's Guide .
Core Features of APM Solutions
Modern APM solutions offer a range of features to help you monitor and optimize your applications effectively. These features are designed to provide comprehensive insights into your application's performance, ensuring that any issues are quickly identified and resolved to maintain a seamless user experience. Some core features of APM solutions are:
- Real-time performance tracking and alerting: It is a core feature of Application Performance Monitoring (APM) solutions, enabling continuous surveillance of an application's performance metrics and immediate response to any issues that arise. It involves continuously monitoring various performance metrics of an application as it runs. These metrics include response times, throughput, error rates, and resource utilization. Real-time tracking ensures that performance issues are detected as soon as they occur, often before they impact end-users. This allows for quicker resolution and minimizes downtime.
- End-user experience monitoring: End-user experience monitoring involves tracking and analyzing the interactions of actual users with an application. This includes capturing data on user behavior, performance metrics experienced by users, and any errors or issues they encounter. The goal is to gain insights into the user experience and identify areas for improvement. Some functionality includes Page Load Times, Transaction Times, Session Recordings, Clickstream Events, etc.
- Application dependency mapping: Application dependency mapping involves creating a detailed map that shows how different parts of an application interact with each other. This includes the flow of data, service calls, and dependencies between components. It identifies critical components that are essential for the application's operation. These are components that, if they fail, could cause significant disruptions. It also highlights potential bottlenecks and points of failure within the application, helping teams to proactively address performance issues.
- Root cause analysis: Root cause analysis is a methodical approach that aims to pinpoint the underlying causes of an issue's existence. To find the source of performance problems, RCA tools examine logs, traces, performance measurements, and other data in the context of APM. This procedure looks behind the obvious symptoms to identify the underlying problems influencing the functionality of the program.
Why is APM Critical for Modern Businesses?
In today's digital-first business environment, APM is more than just a nice-to-have; it's a critical component of ensuring business success and continuity. If your product or business has a large customer base, it is highly advisable to monitor your application and the infrastructure on which the app is running. Some use cases include:
- Optimal user experience: APM ensures that apps function smoothly and efficiently, giving users a seamless experience. Fast load speeds, fast interfaces, and little downtime all lead to increased user happiness. In a competitive market, offering an excellent user experience may set a company apart from its competition. Superior application performance can help attract and retain clients.
- Proactive issue detection: APM tools continuously monitor application performance, enabling the early detection of issues before they impact users. This proactive approach helps in addressing problems quickly, reducing the risk of major disruptions. Proactive issue detection and resolution enhance the overall reliability of applications, fostering trust among users and stakeholders.
- Cost optimization: APM provides insights into resource usage, helping businesses allocate resources more efficiently. By understanding the actual needs of the application, businesses can optimize server usage, memory allocation, and network bandwidth. Optimizing application performance and resource usage improves cost management and return on investment (ROI) for IT infrastructure and development efforts.
- Digital transformation support: APM provides the data and insights needed to support digital transformation initiatives. By understanding how applications perform under different conditions, businesses can make informed decisions about modernization and scaling efforts. Modern applications often leverage cloud infrastructure and microservices architectures. APM tools are essential for monitoring and managing the performance of these distributed and complex systems.
How Does APM Work?
APM systems work by collecting and analyzing data from various components of your application stack. This data collection is crucial for understanding how your application performs and identifying potential issues. Here's a detailed look at how APM systems operate:
- Data Collection Methods:
- Agents: Agents are software components installed on application servers. They collect detailed performance data, such as response times, error rates, memory usage, and transaction traces. Agents provide deep insights into the performance of individual components and services within your application.
- APIs: Application Programming Interfaces (APIs) are integration points that allow APM tools to gather data from various parts of your application which enables APM tools to access metrics, logs, and other performance data from third-party services, databases, and custom application components.
- Instrumentation: Instrumentation involves code-level modifications to track specific application behaviors. By inserting monitoring code into the application, developers can capture detailed information about the execution of functions, methods, and transactions. Instrumentation provides granular visibility into the application's performance, helping to identify bottlenecks and optimize critical paths.
- Data Aggregation and Analysis:
- Centralized Data Aggregation: The collected data from agents, APIs, and instrumentation is aggregated in a central repository. This centralized approach ensures that all performance data is available in one place for comprehensive analysis.
- Real-Time Analysis: APM tools analyze the data in real time, providing immediate insights into application performance. This real-time analysis is crucial for detecting and resolving performance issues as they occur.
- Visualization and Reporting: APM tools use advanced visualization techniques to present performance data in an easily understandable format. Dashboards, graphs, and heatmaps help visualize metrics, trends, and anomalies. Detailed reports summarize the performance data, highlighting key metrics, trends, and potential issues. These reports are valuable for periodic reviews and decision-making.
- Integration with CI/CD and DevOps:
- Continuous Integration/Continuous Deployment (CI/CD): APM tools integrate with CI/CD pipelines to monitor application performance throughout the development lifecycle. Continuous performance monitoring during development, testing, and deployment helps identify and resolve issues early, ensuring that performance standards are maintained.
- DevOps Practices: APM supports DevOps practices by fostering collaboration between development and operations teams. Shared insights from APM tools help teams work together to optimize application performance. : APM tools often integrate with automation frameworks, enabling automated performance testing and monitoring as part of the deployment process.
Implementing APM: A Step-by-Step Guide
Implementing Application Performance Monitoring (APM) is essential for maintaining and improving the performance of your applications. Here’s a detailed step-by-step guide to help you set up an effective APM system:
- Assess your application landscape: Determine which applications are crucial for your business operations. Focus on those that directly impact user experience and business outcomes. Establish the key performance indicators (KPIs) and performance requirements for each application. This may include response times, error rates, throughput, and resource usage. Gain a thorough understanding of your application architecture, including dependencies, microservices, databases, and third-party integrations.
- Choose an APM solution: Research and compare several APM solutions depending on your technological stack and business requirements. Consider considerations such as usability, scalability, integration capabilities, and cost. Consider trying out a couple of APM solutions to determine how well they satisfy your needs and integrate into your existing workflows. In this guide, we will use SigNoz Cloud.
- Set up instrumentation: Install APM agents on your application servers. These agents collect performance data and send it to the APM system for analysis. If needed, add code-level instrumentation to track specific application behaviors. This may involve modifying your application code to include monitoring hooks. For applications and services that support it, configure API integrations to gather performance data.
- Configure data collection: Identify the specific metrics you need to track, such as response times, error rates, transaction traces, and resource usage. Ensure these metrics align with your performance requirements. Determine how often to collect data. Real-time or near-real-time data collection is typically preferred for timely insights, but it should be balanced against the overhead it may introduce. Establish baselines for normal performance and set thresholds for alerts. These thresholds will help in detecting anomalies and performance issues.
- Set up alerts and dashboards: Design dashboards that visually represent crucial performance information. Use charts, graphs, and heatmaps to make data simpler to understand and actionable. Create alert rules for crucial metrics. Configure notifications to be sent via email, SMS, or other channels when performance thresholds are exceeded. Create custom views for specific stakeholders, such as developers, operations teams, and business leaders, to deliver relevant insights to each group.
- Train your team: By providing training sessions, you can make sure that your staff is proficient in using APM tools. Team members should be able to analyze the metrics and logs gathered by the APM tools, which should address how to evaluate performance data.
Best Practices for APM Implementation
- Start with Critical Applications: Focus on monitoring your most critical applications first. Once these are well-monitored, gradually expand coverage to other applications.
- Establish Performance Baselines and SLAs: Define what normal performance looks like for your applications and set clear Service Level Agreements (SLAs) to establish performance expectations.
- Foster Continuous Monitoring and Improvement: Implement ongoing monitoring of your applications and regularly review performance data to identify areas for improvement.
- Regularly Update APM Strategies: Continuously adapt your APM strategies to keep up with changing business needs and new technologies.
- Involve Key Stakeholders: Engage developers, operations teams, and business stakeholders in the APM process to ensure everyone has the insights they need.
- Use Real-time Alerts and Dashboards: Configure real-time alerts for critical performance issues and create intuitive dashboards for easy monitoring and quick decision-making.
- Leverage Automation: Automate the collection of performance data, the triggering of alerts, and the generation of reports to save time and improve accuracy.
- Train Your Team: Ensure your team is proficient in using APM tools and interpreting the data they collect to effectively manage application performance.
Overcoming Common APM Challenges
Implementing APM is not without its challenges:
- Data overload: Prioritise the most important metrics that have a direct impact on user experience and business results. Set up filters and criteria to prevent alert fatigue and make sure alerts are actionable.
- Complex architectures: Use distributed tracing to track and control the performance of microservices and cloud-native apps. This provides end-to-end visibility into transaction flows, assisting in the identification of bottlenecks across distributed systems.
- Security concerns: Make sure that your APM implementation balances performance monitoring and security requirements. Collect and transfer data securely, and use role-based permissions to limit access to sensitive information.
- Privacy concerns: Ensure that your APM data gathering techniques adhere to applicable privacy requirements such as GDPR or CCPA. Anonymise or conceal sensitive data, and inform users about the information being collected.
APM in Cloud-Native and Microservices Environments
Adapting APM strategies for cloud-native and microservices architecture is crucial for effective performance monitoring and optimization. Here’s a comprehensive explanation of how to tailor APM for these modern environments:
- Containerized applications: Containerized applications are short-lived and can be run in isolated containers that can be created and destroyed dynamically. Traditional APM tools can not keep up with which is why it’s essential to have APM tools that can monitor these instances in real time. This includes capturing metrics such as CPU and memory usage, response times, and error rates, even for containers that exist only for a few seconds. Container-aware APM technologies are intended to follow these ephemeral instances and provide specific performance information for each container. This allows you to monitor the health and performance of applications running on Docker, Kubernetes, or other container orchestration platforms.
- Distributed tracing: In a microservices architecture, a single user request may trigger a series of interactions across multiple services. Distributed tracing allows you to track the entire transaction flow, providing visibility into each microservice involved. This helps identify performance bottlenecks and latency issues within the service mesh. This granular level of insight is critical for effective troubleshooting and maintaining the overall health of the application.
- Serverless monitoring: Serverless architectures, where code is executed in response to events without managing the underlying servers, pose unique challenges for APM. Monitoring serverless functions (e.g., AWS Lambda, Azure Functions) involves tracking invocation times, resource usage, and error rates. APM tools need to capture these metrics to ensure that serverless functions perform optimally. New APM tools are now capable of seamlessly gathering performance data from cloud-native services, providing a unified view of serverless function performance within the broader application context.
- Cloud-native observability: Cloud-native observability platforms integrate APM with logs, metrics, and traces, offering a holistic view of application performance. This comprehensive insight allows you to understand the full context of performance issues, combining different data types to form a complete picture.
Implementing APM with SigNoz
To effectively monitor APM, using an advanced observability platform like SigNoz can be highly beneficial. SigNoz is an open-source observability tool that provides end-to-end monitoring, troubleshooting, and alerting capabilities for your applications and infrastructure.
Here's how you can leverage SigNoz for APM solutions:
- Create a SigNoz Cloud Account
SigNoz Cloud provides a 30-day free trial period. This demo uses SigNoz Cloud, but you can choose to use the open-source version.
- Clone sample Flask app repository
From your terminal use the following command to clone sample Flask app from the GitHub repository.
git clone https://github.com/SigNoz/sample-flask-app.git
- Add .env File to the Root Project Folder
In the root directory of your project folder, create a new file named .env and paste the below details into it:
OTEL_COLLECTOR_ENDPOINT=ingest.{region}.signoz.cloud:443
SIGNOZ_INGESTION_KEY=***
OTEL_COLLECTOR_ENDPOINT: Specifies the address of the SigNoz collector where your application will send its telemetry data.SIGNOZ_INGESTION_KEY: Authenticates your application with the SigNoz collector.
Note: Replace {region} with your SigNoz region and SIGNOZ_INGESTION_KEY with your actual ingestion key.
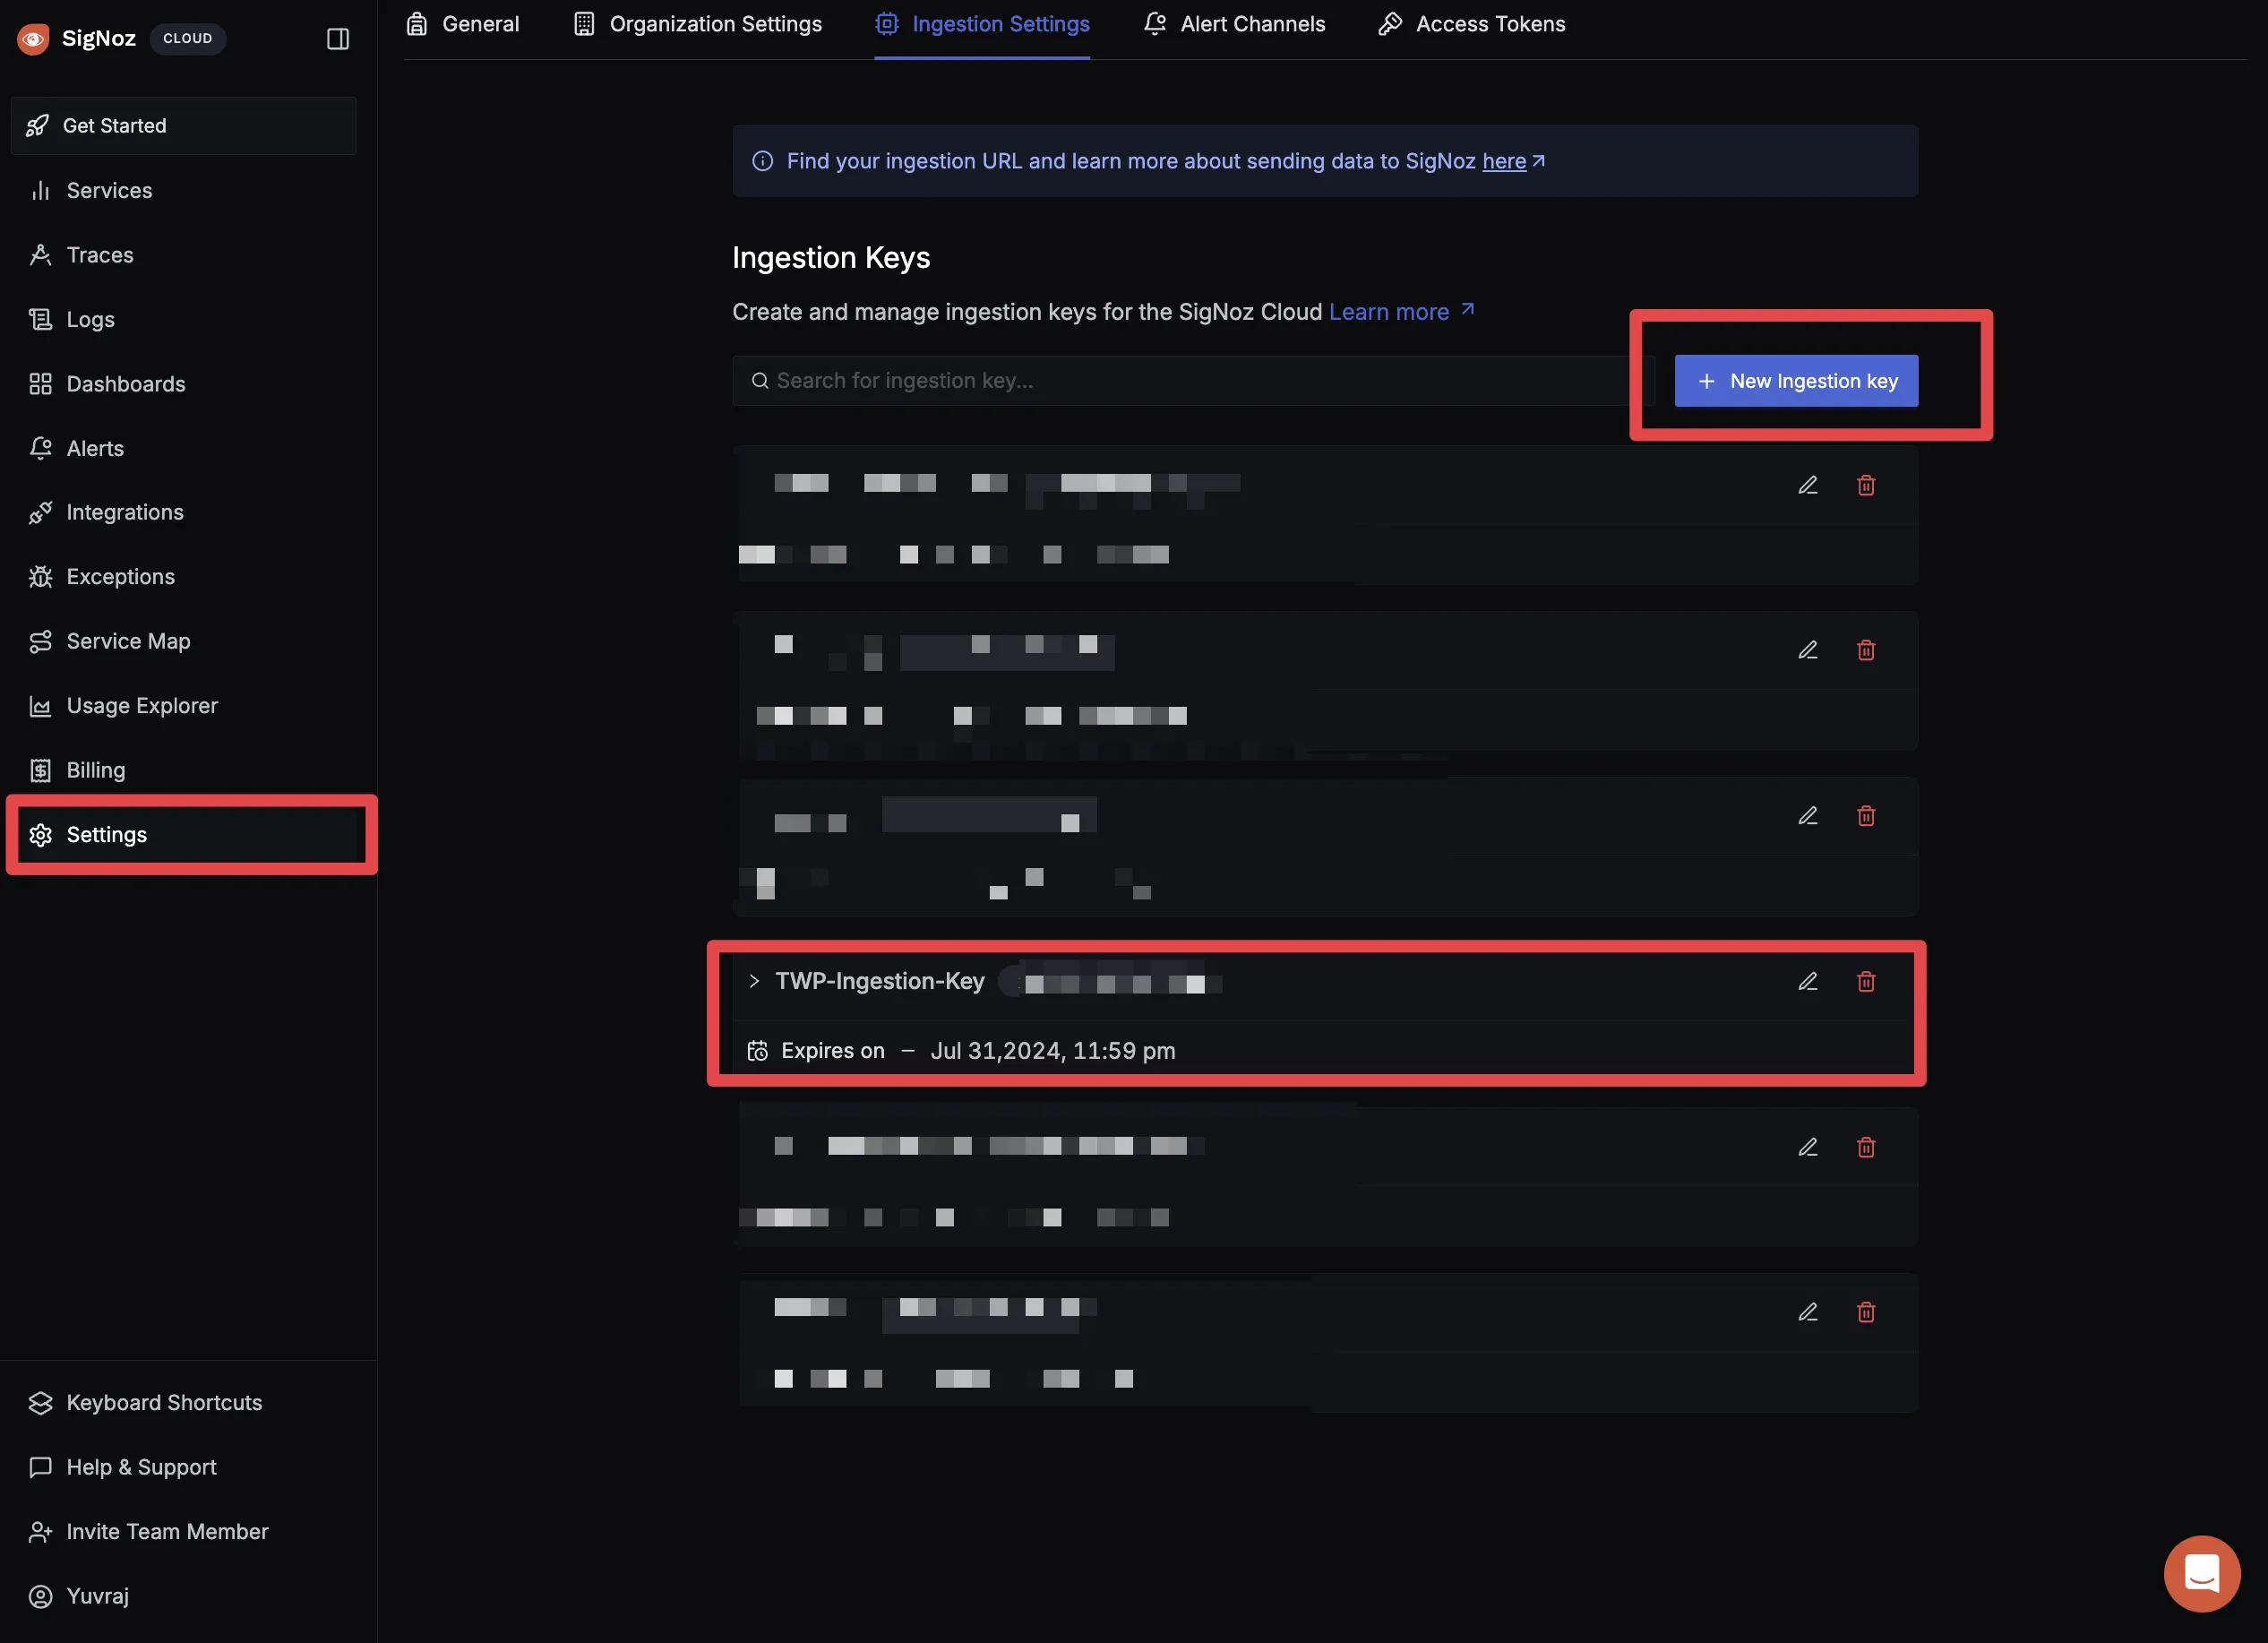
To obtain the SigNoz ingestion key and region, navigate to the “Settings” page in your SigNoz dashboard. You will find the ingestion key and region under the “Ingestion Settings” tab.
- Using SigNoz Application Monitoring:
In the top left corner, click on getting started.
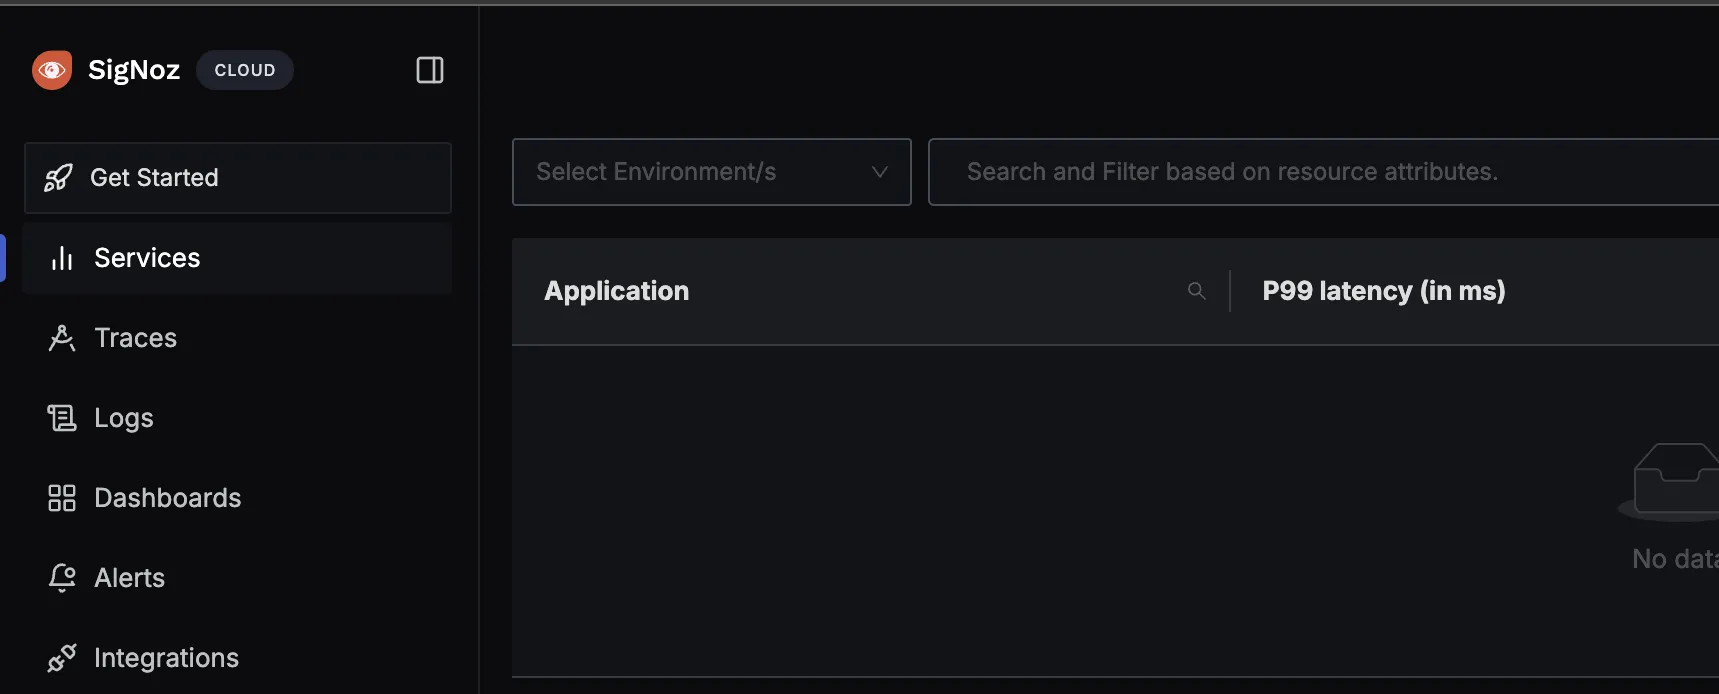
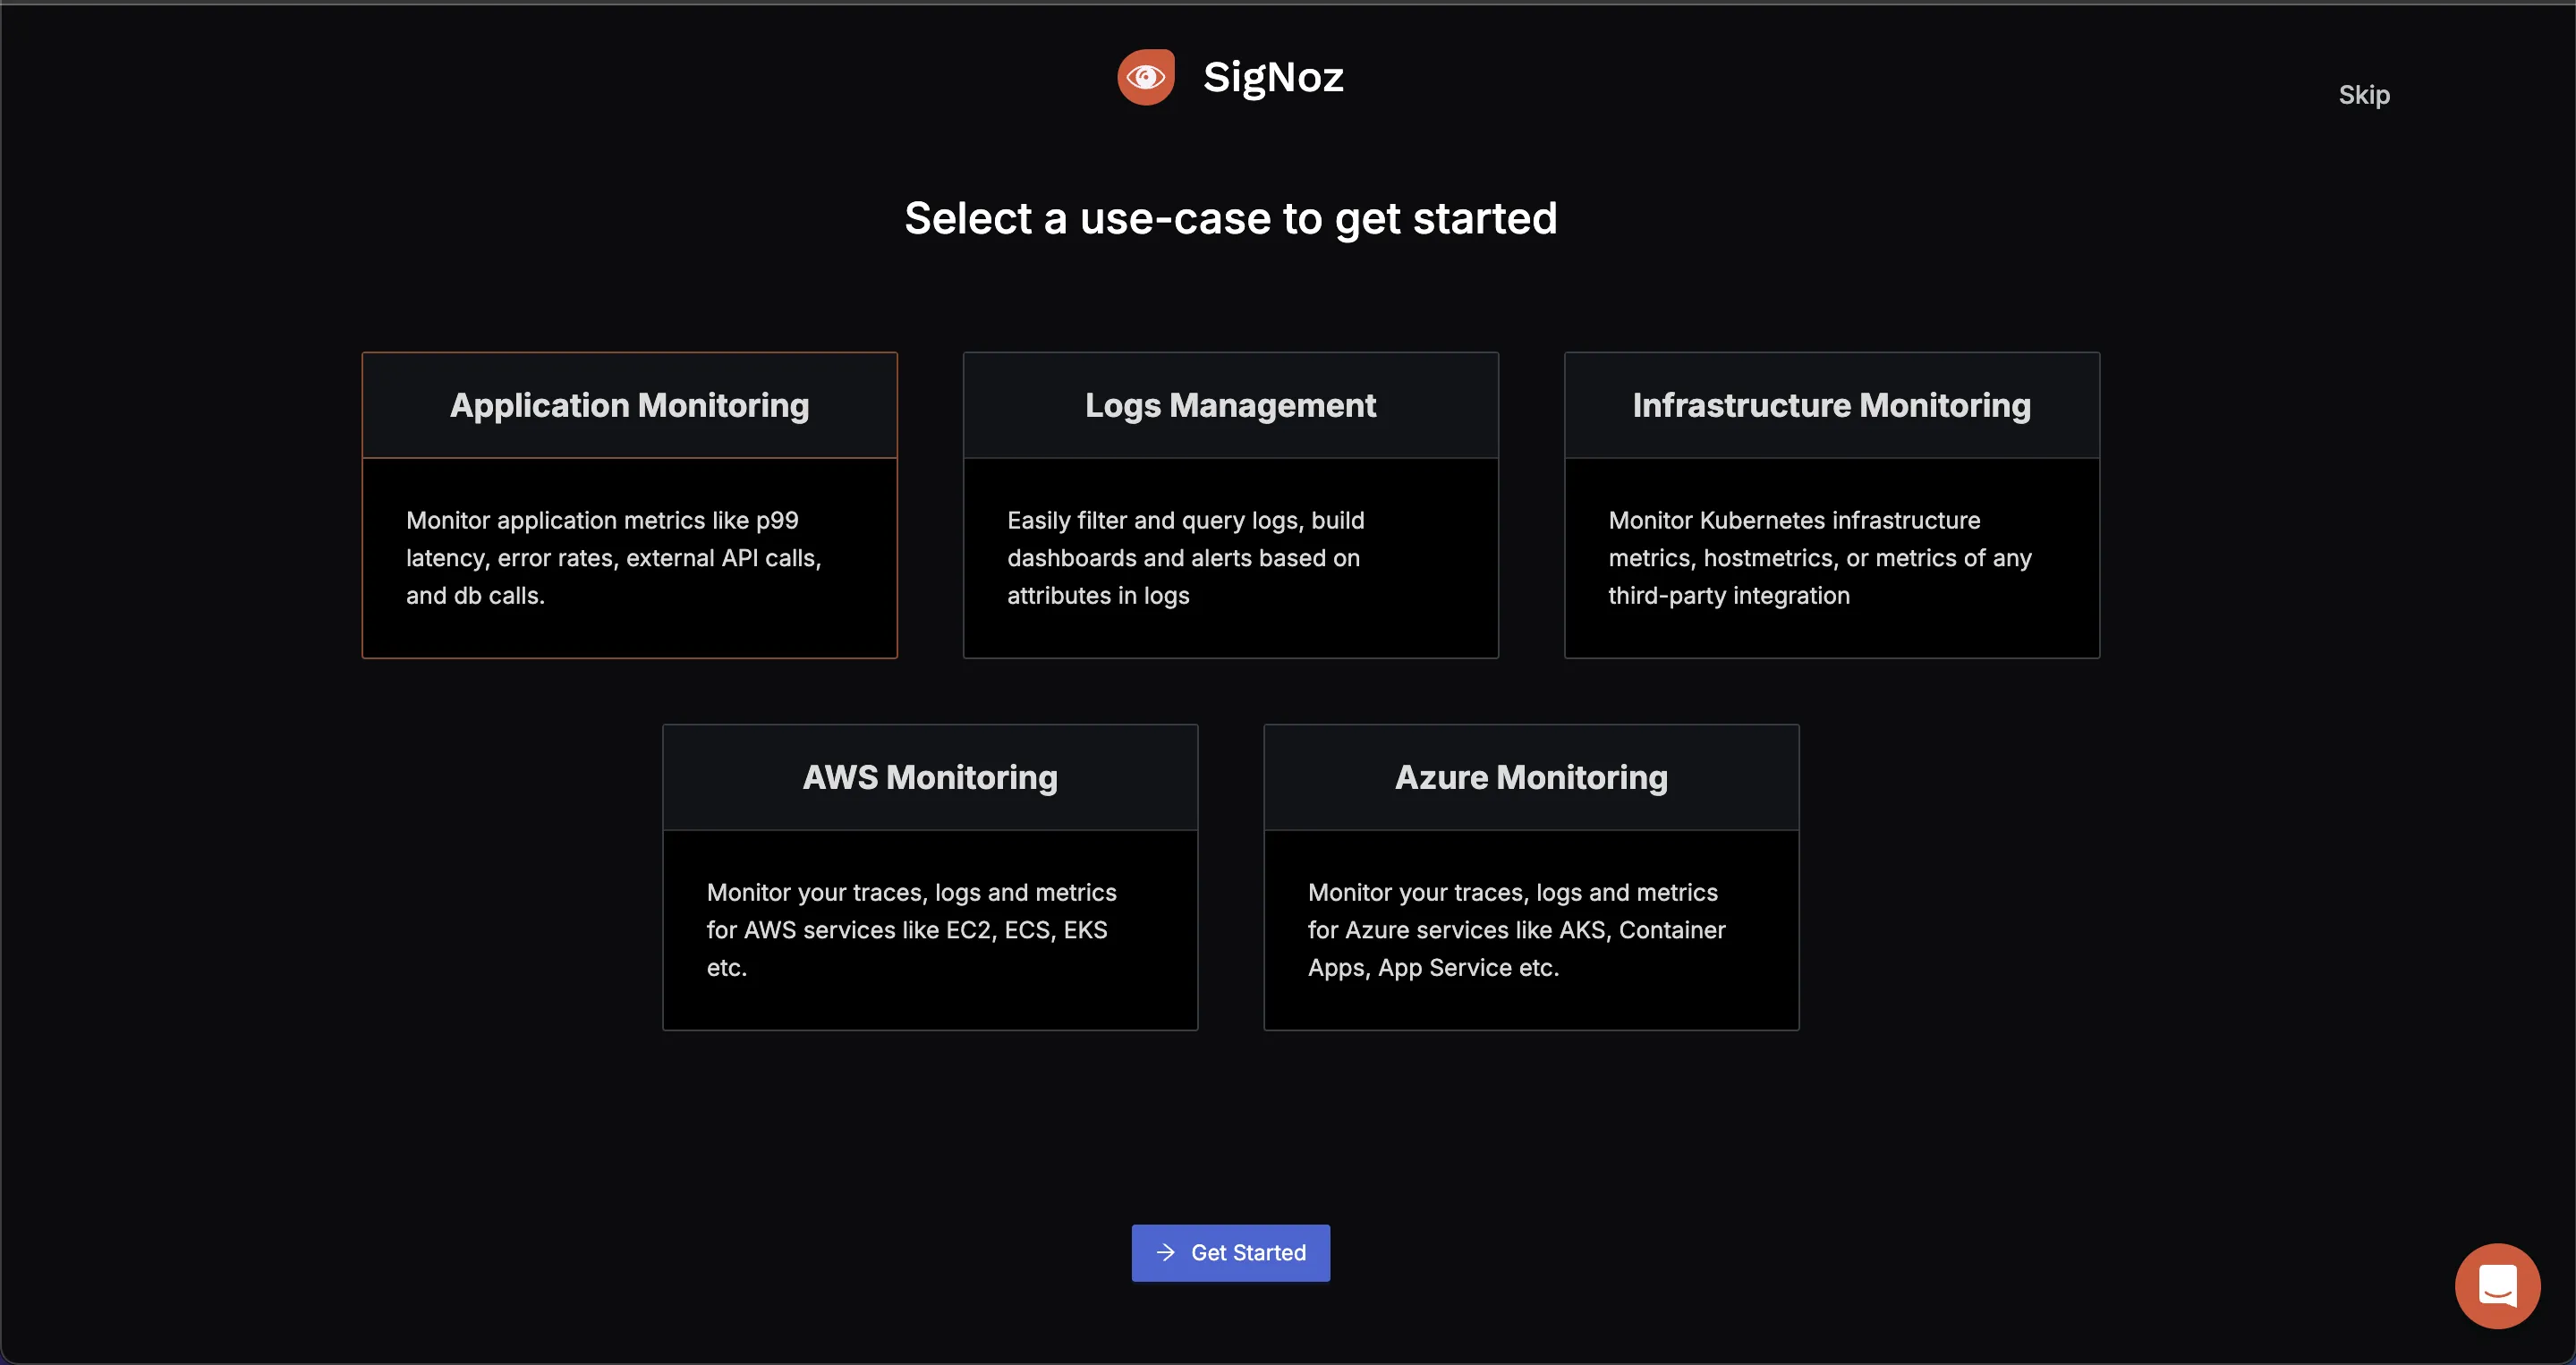
You will be redirected to “Get Started Page”. Choose Application Monitoring to check latency and how your application is performing.
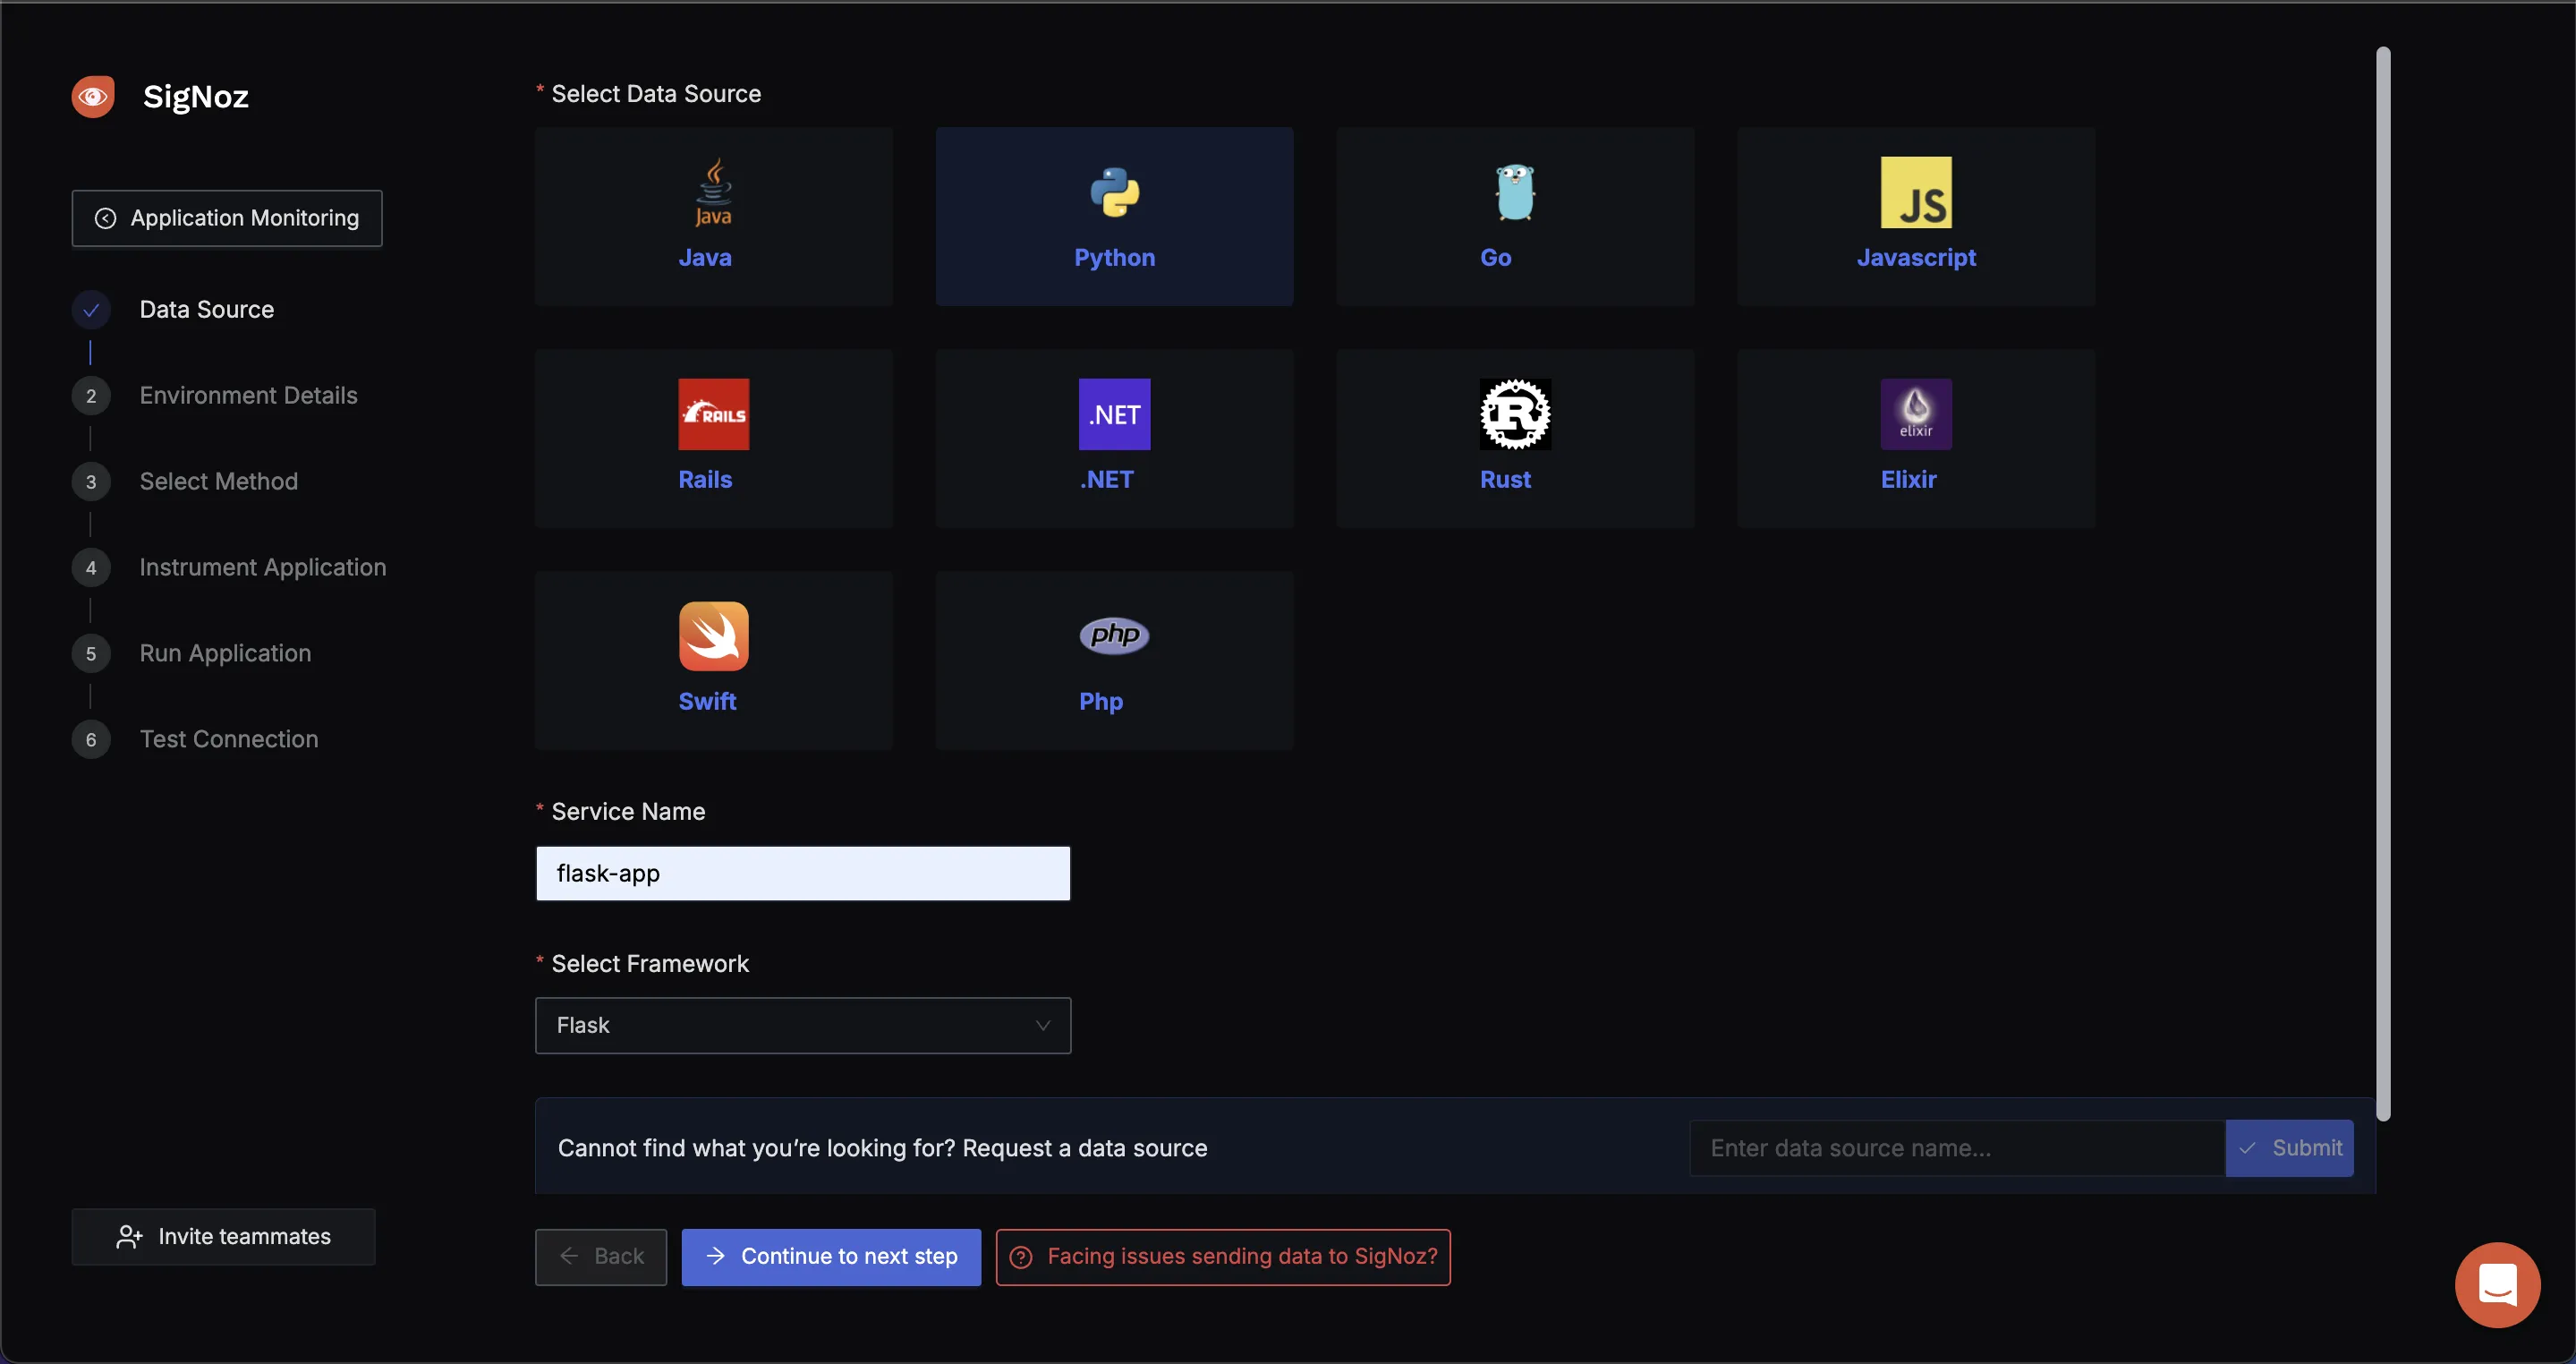
- Select the language and framework of the application
We are using a Python Application which we want to monitor. Select Python with framework as flask. You can write service name as you want, we are using flask-app.
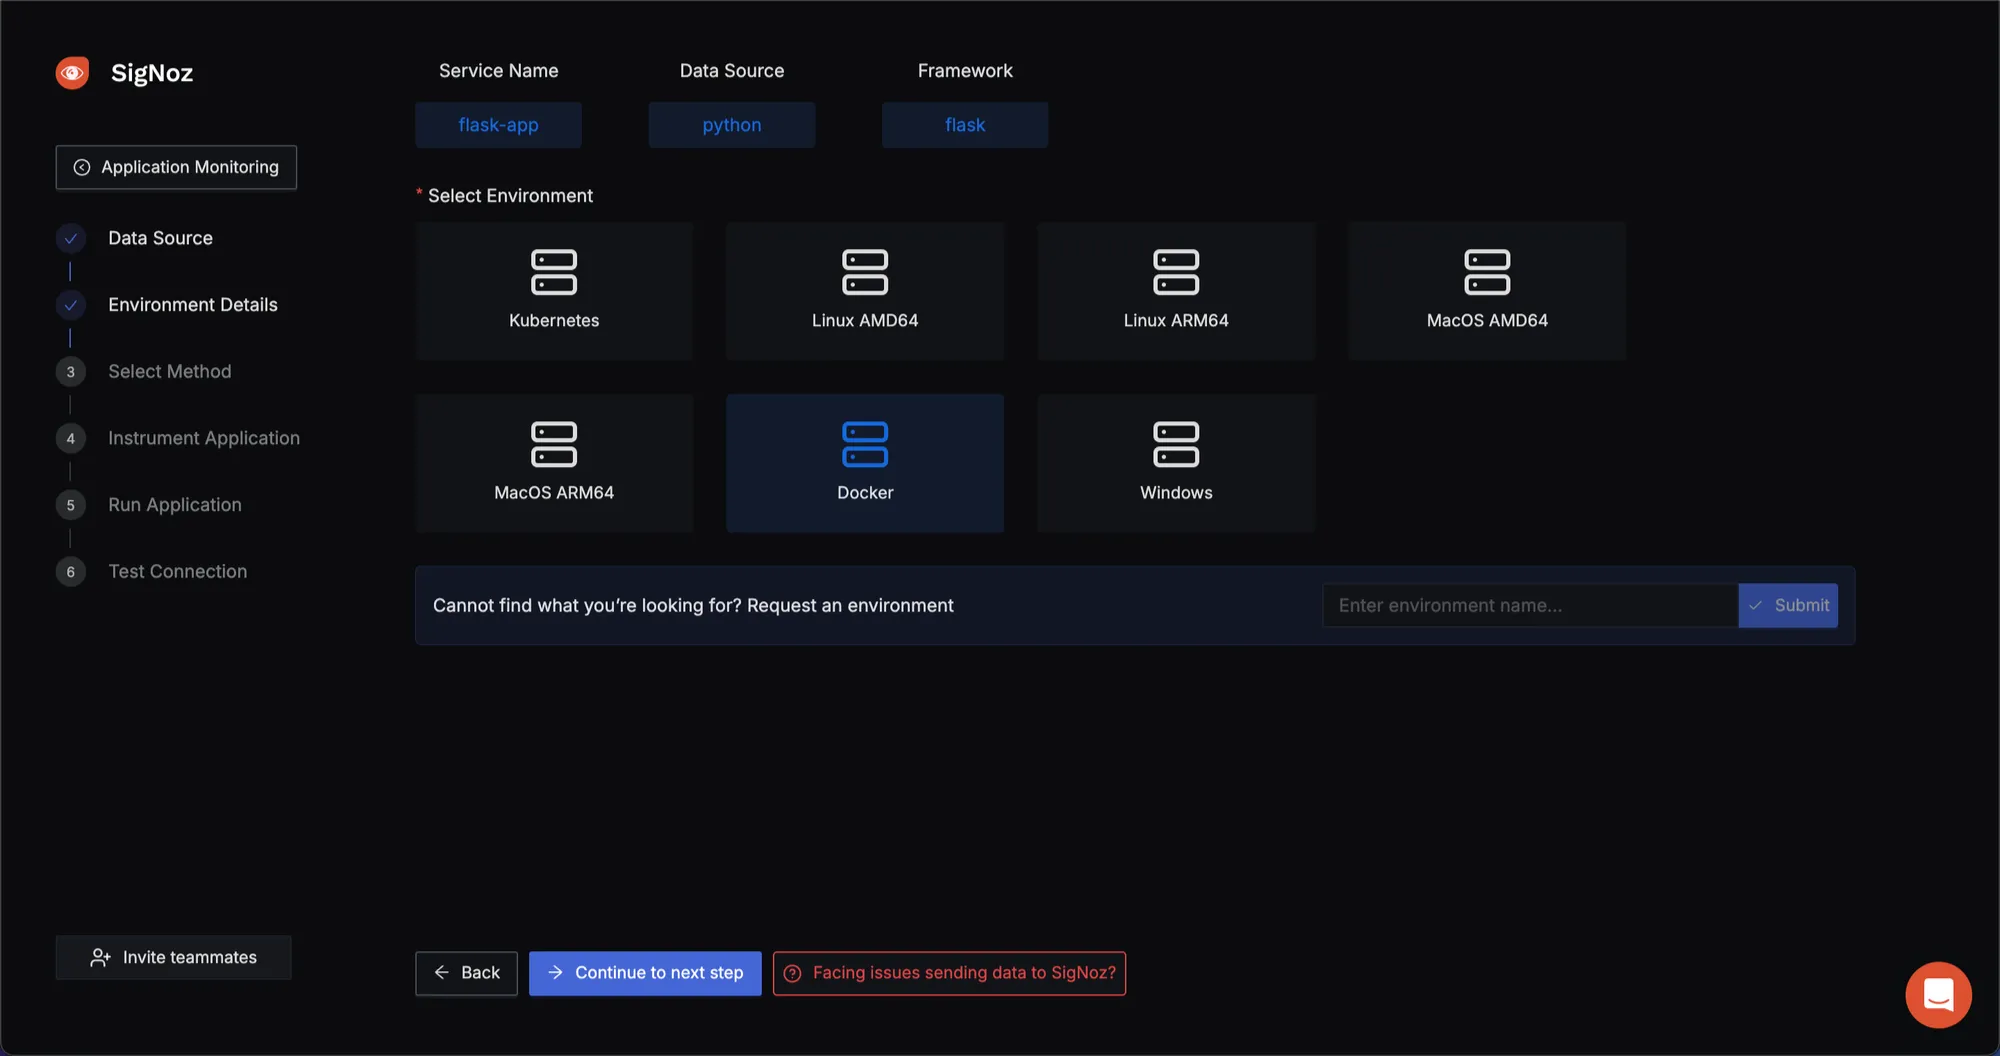
- Choose environment your app is running on
Since we are going to run our app using Docker. Select Docker for a Docker-based applications.
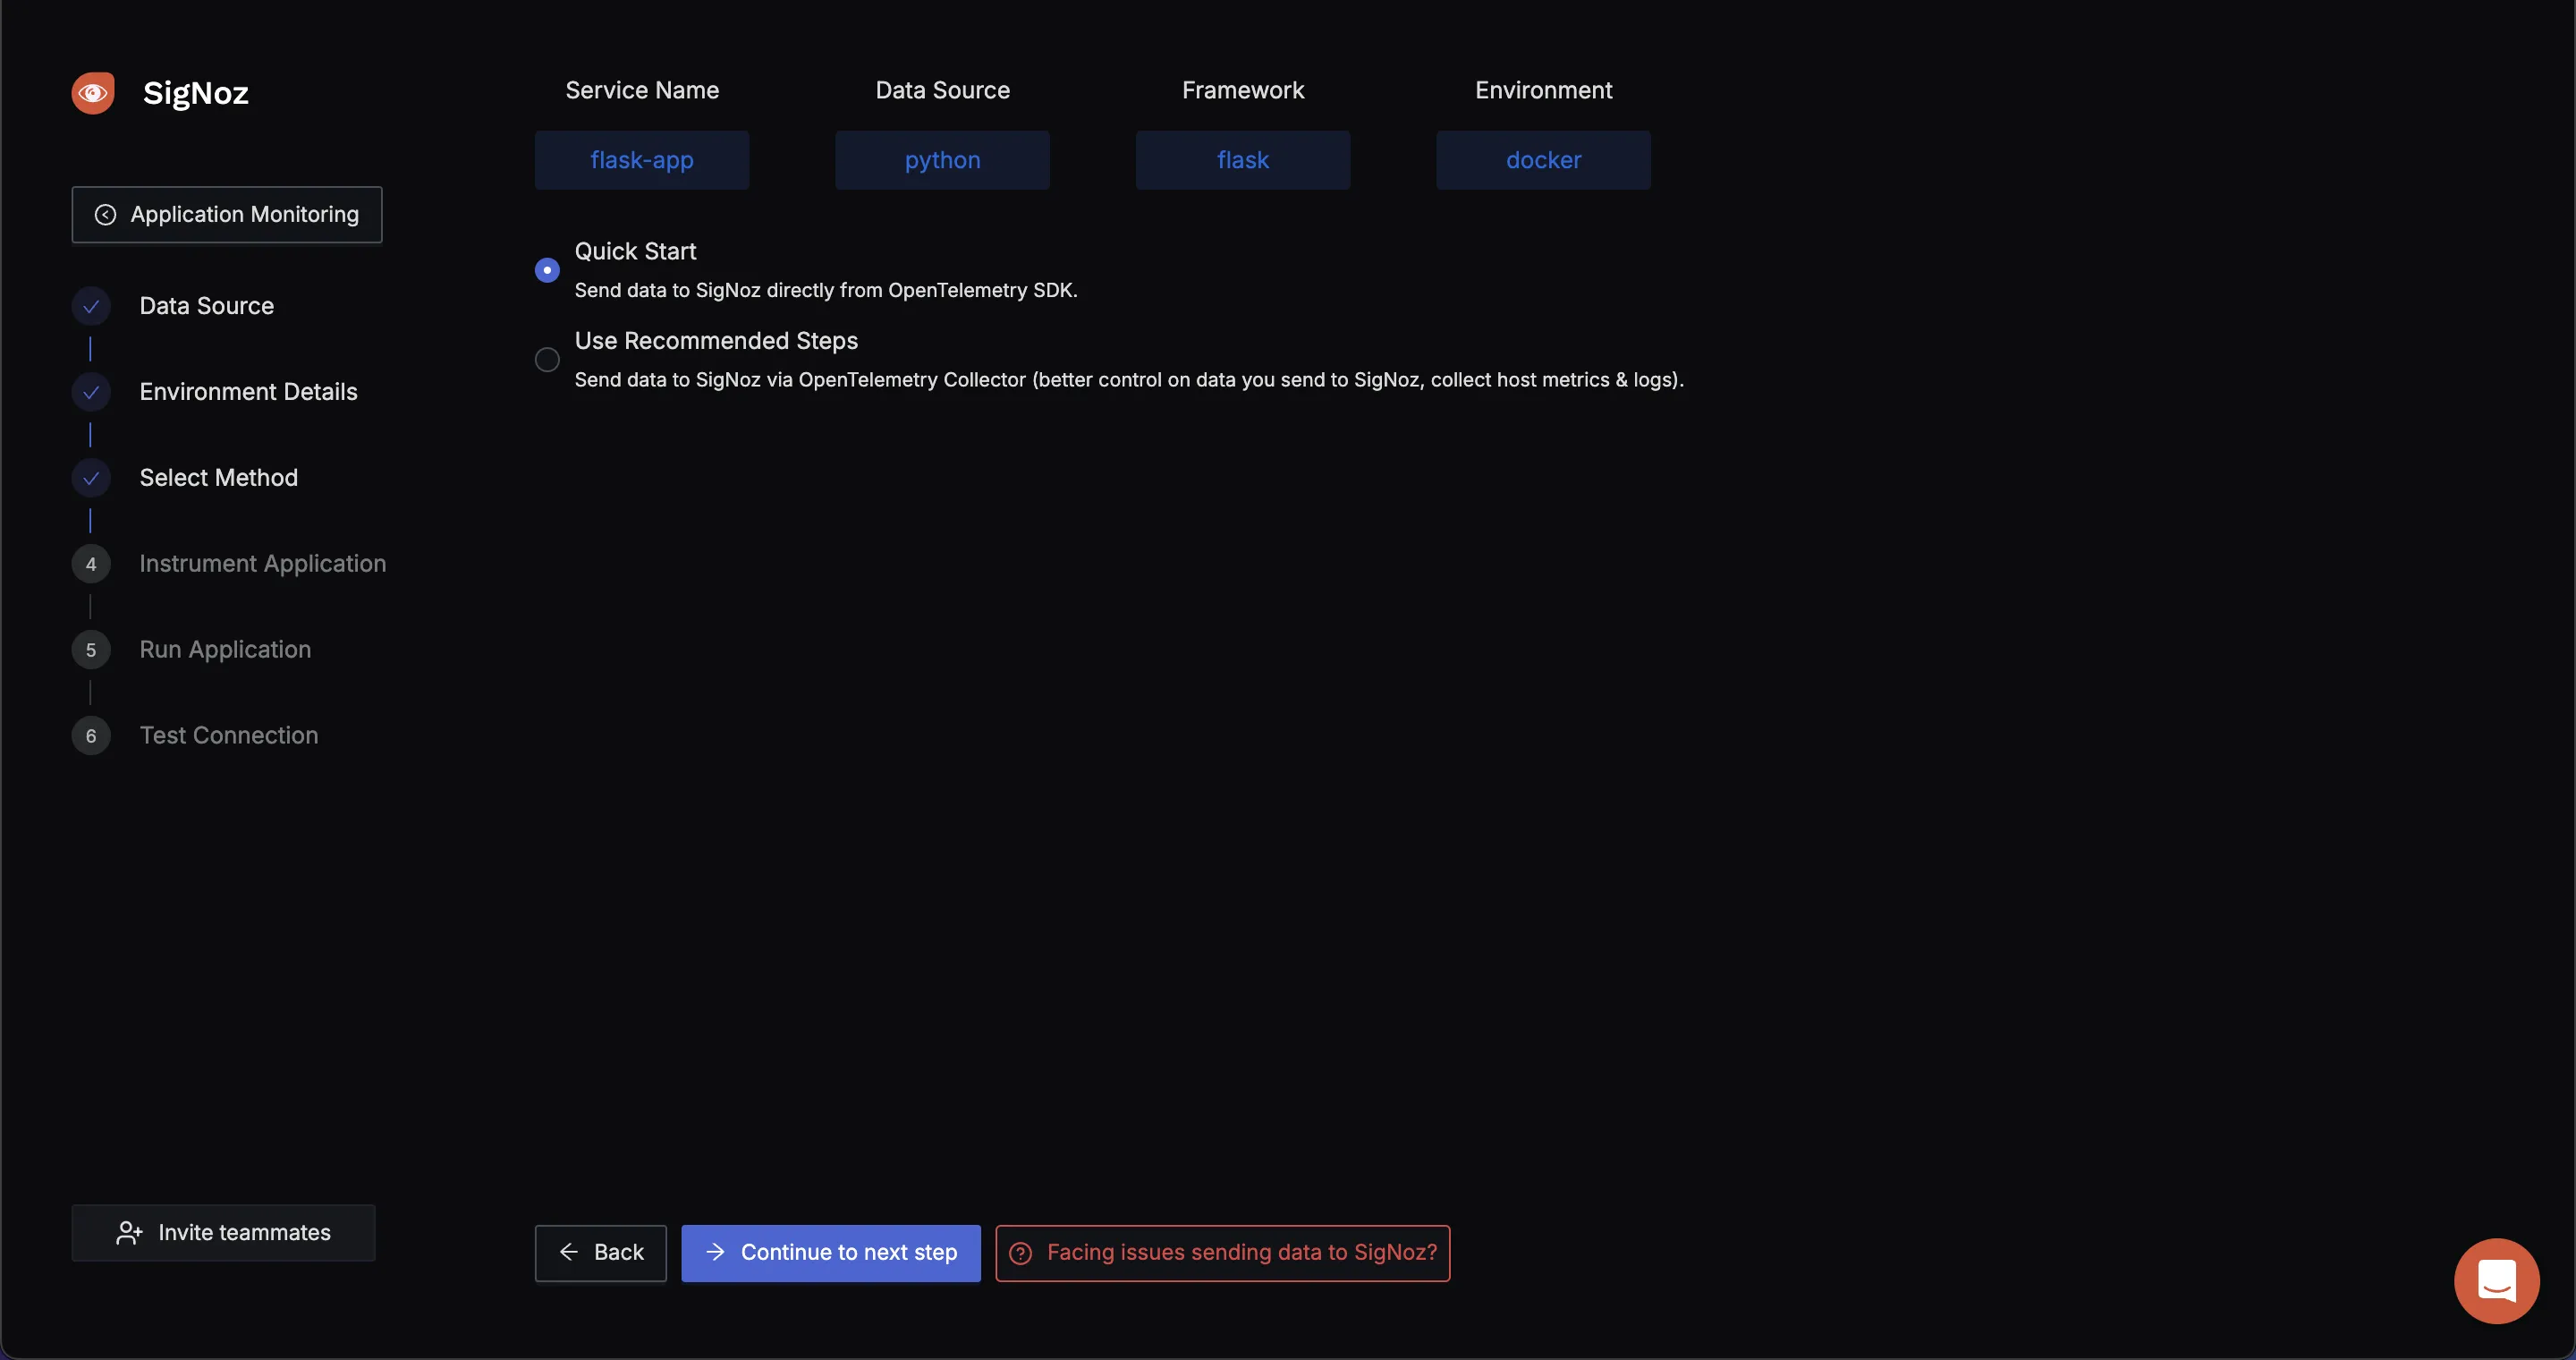
- Using OpenTelemtry SDK or Collector to send data to SigNoz :
To send data to SigNoz, we will use the OpenTelemetry Collector. The OpenTelemetry Collector is a vendor-agnostic service that receives, processes, and exports telemetry data (metrics, logs, and traces) from various sources to various destinations. For more details, visit OpenTelemetry Collector Guide.
- Add Services to the Docker & Docker Compose File
- In your
requirements.txt, add the following OpenTelemetry dependencies:
opentelemetry-distro==0.43b0
opentelemetry-exporter-otlp==1.22.0
- Update your Dockerfile to include OpenTelemetry instructions:
# set base image (host OS)
FROM python:3.8

# set the working directory in the container
WORKDIR /code

# copy the dependencies file to the working directory
COPY . .

ENV OTEL_RESOURCE_ATTRIBUTES=service.name=flask-app
# ADD your REGION in the place
ENV OTEL_EXPORTER_OTLP_ENDPOINT=https://ingest.{REGION}.signoz.cloud:443
ENV OTEL_EXPORTER_OTLP_HEADERS=signoz-ingestion-key=${SIGNOZ_INGESTION_KEY}
ENV OTEL_EXPORTER_OTLP_PROTOCOL=grpc

# Install any needed packages specified in requirements.txt
# And install OpenTelemetry packages
RUN pip install --no-cache-dir -r requirements.txt

RUN opentelemetry-bootstrap --action=install
# copy the content of the local src directory to the working directory

# command to run on container start
CMD [ "opentelemetry-instrument", "python", "./app.py" ]

# expose port
EXPOSE 5002
In your Docker Compose file, add the below configuration:
  sample-flask:
    image: "signoz/sample-flask-app:latest"
    container_name: sample-flask
    hostname: sample-flask
    ports:
      - 5002:5002
    extra_hosts:
      - signoz:host-gateway
    environment:
      MONGO_HOST: mongodb
      OTEL_RESOURCE_ATTRIBUTES: service.name=sample-flask
      # Replace this with your Exporter Endpoint
      OTEL_EXPORTER_OTLP_ENDPOINT: ingest.{REGION}.signoz.cloud:443
- Start the Docker Compose file
Run the following command to start the containers:
docker compose up -d
If the containers start without errors, traces should now appear on the SigNoz Dashboard.
- Click on the Services page to see your Application:
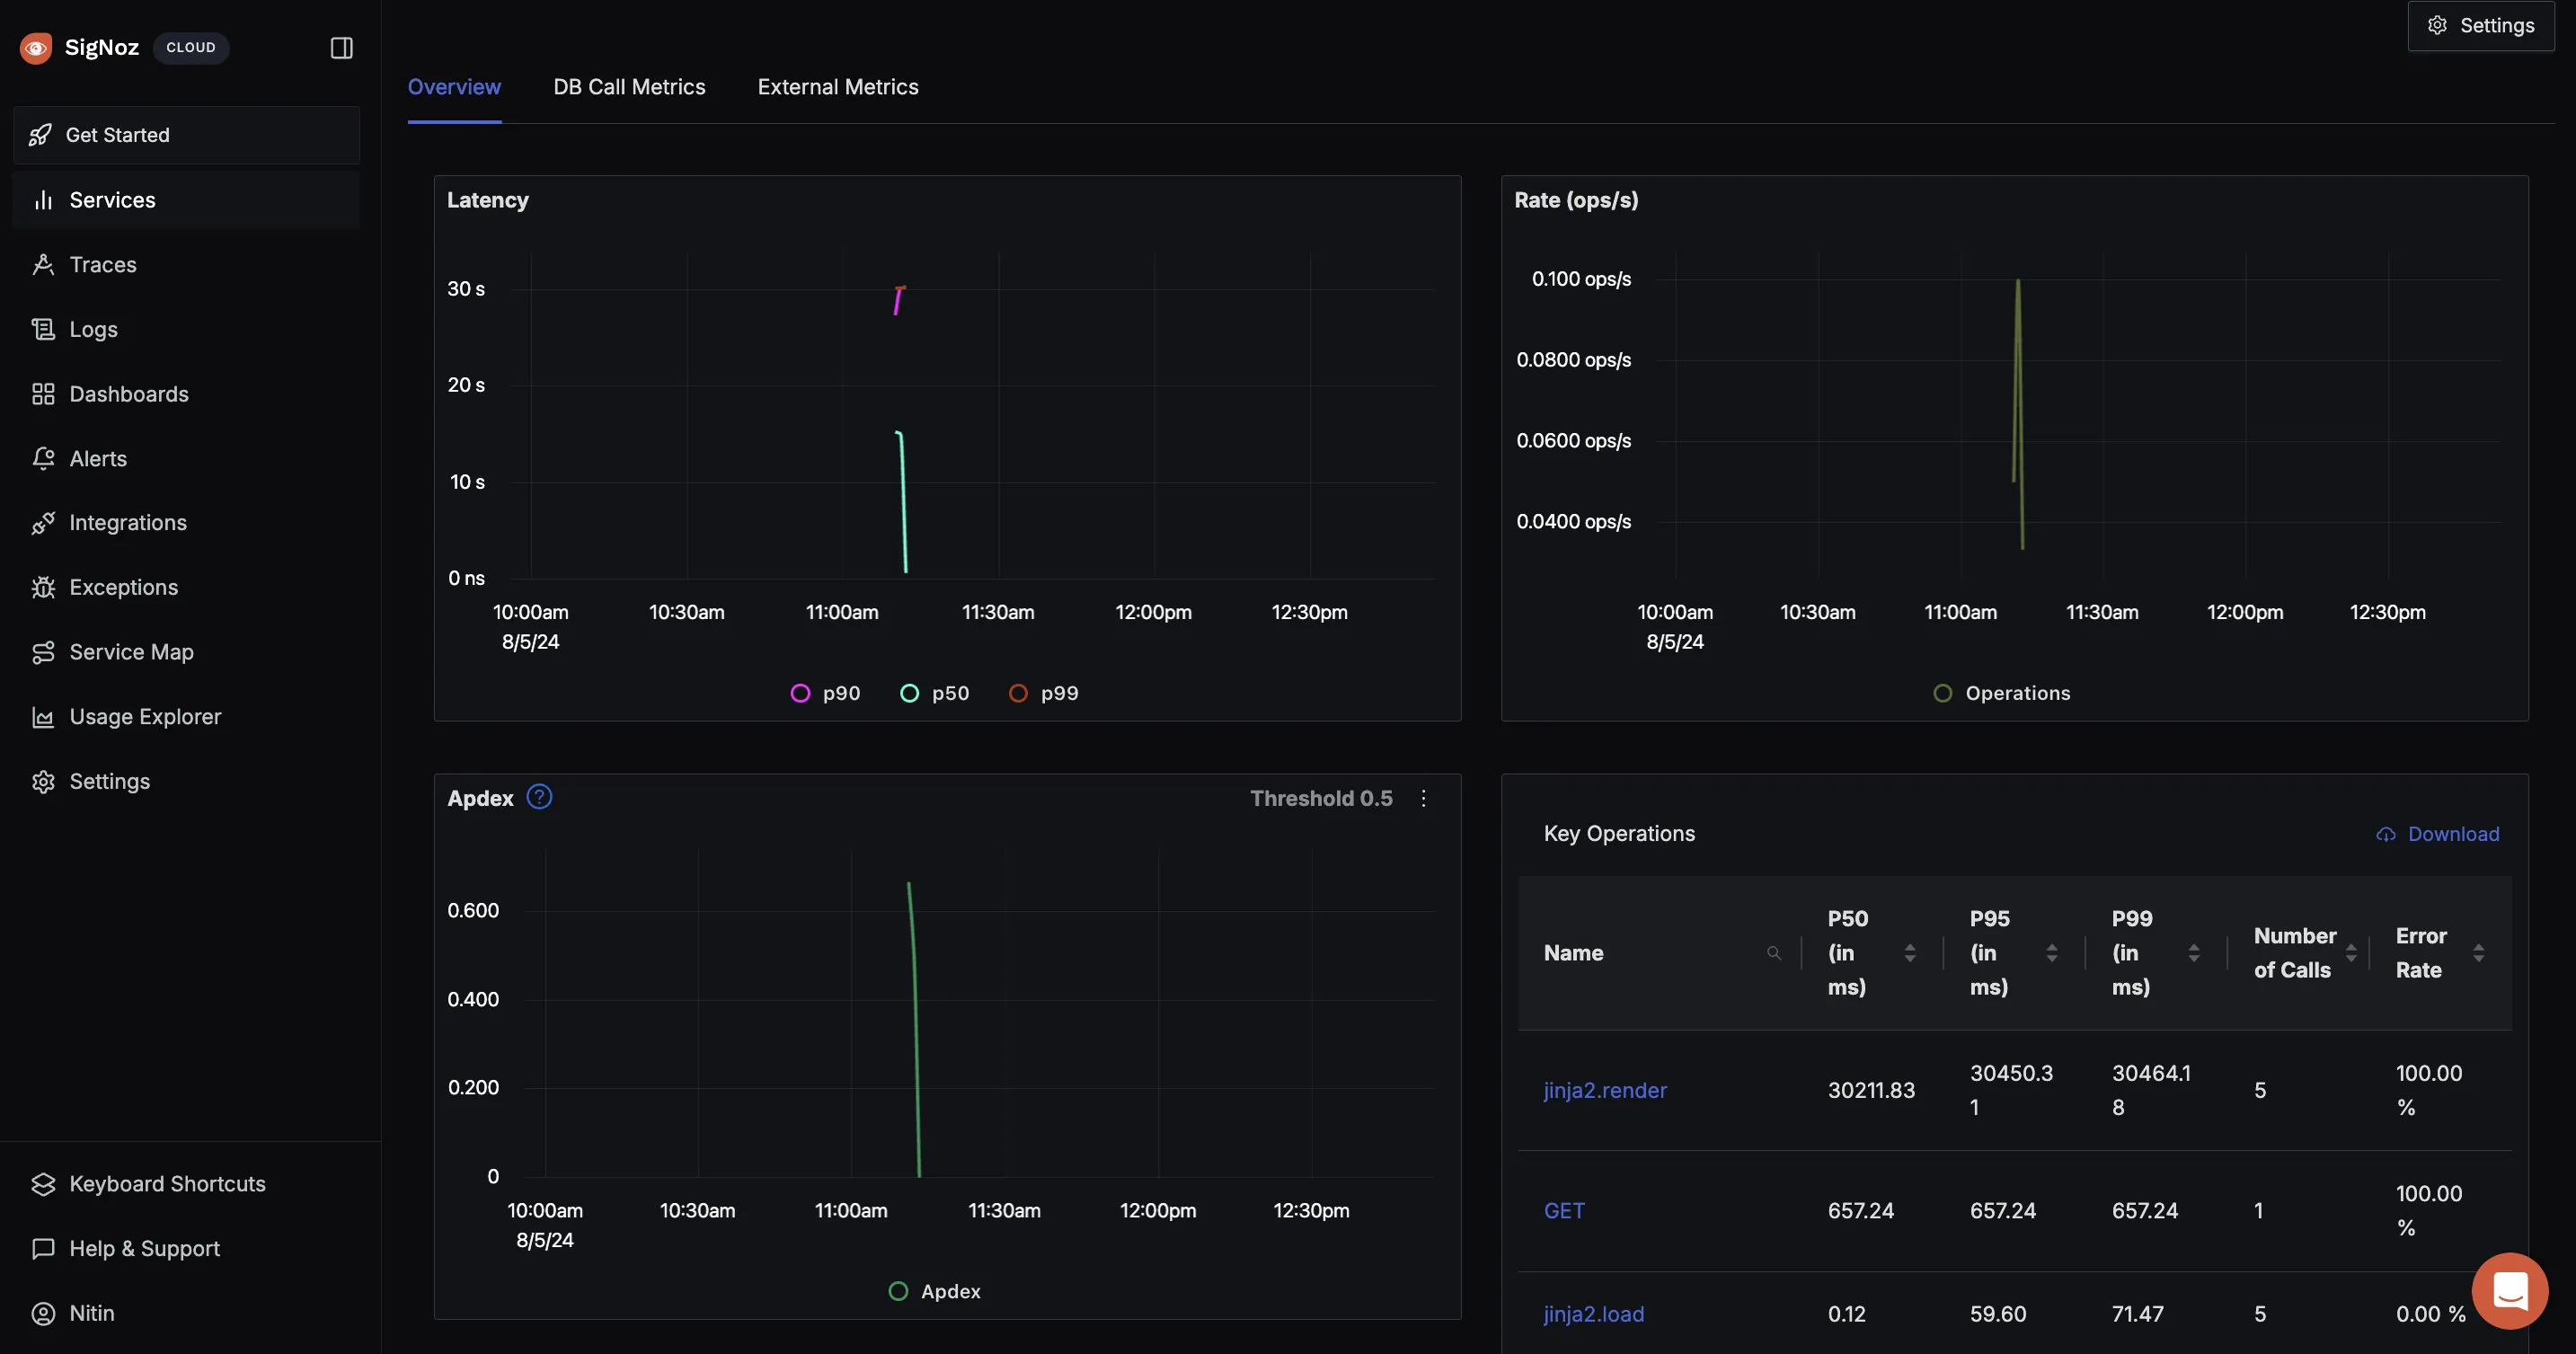
Go to the Services page to see your application. You can monitor P99 latency and error rate.
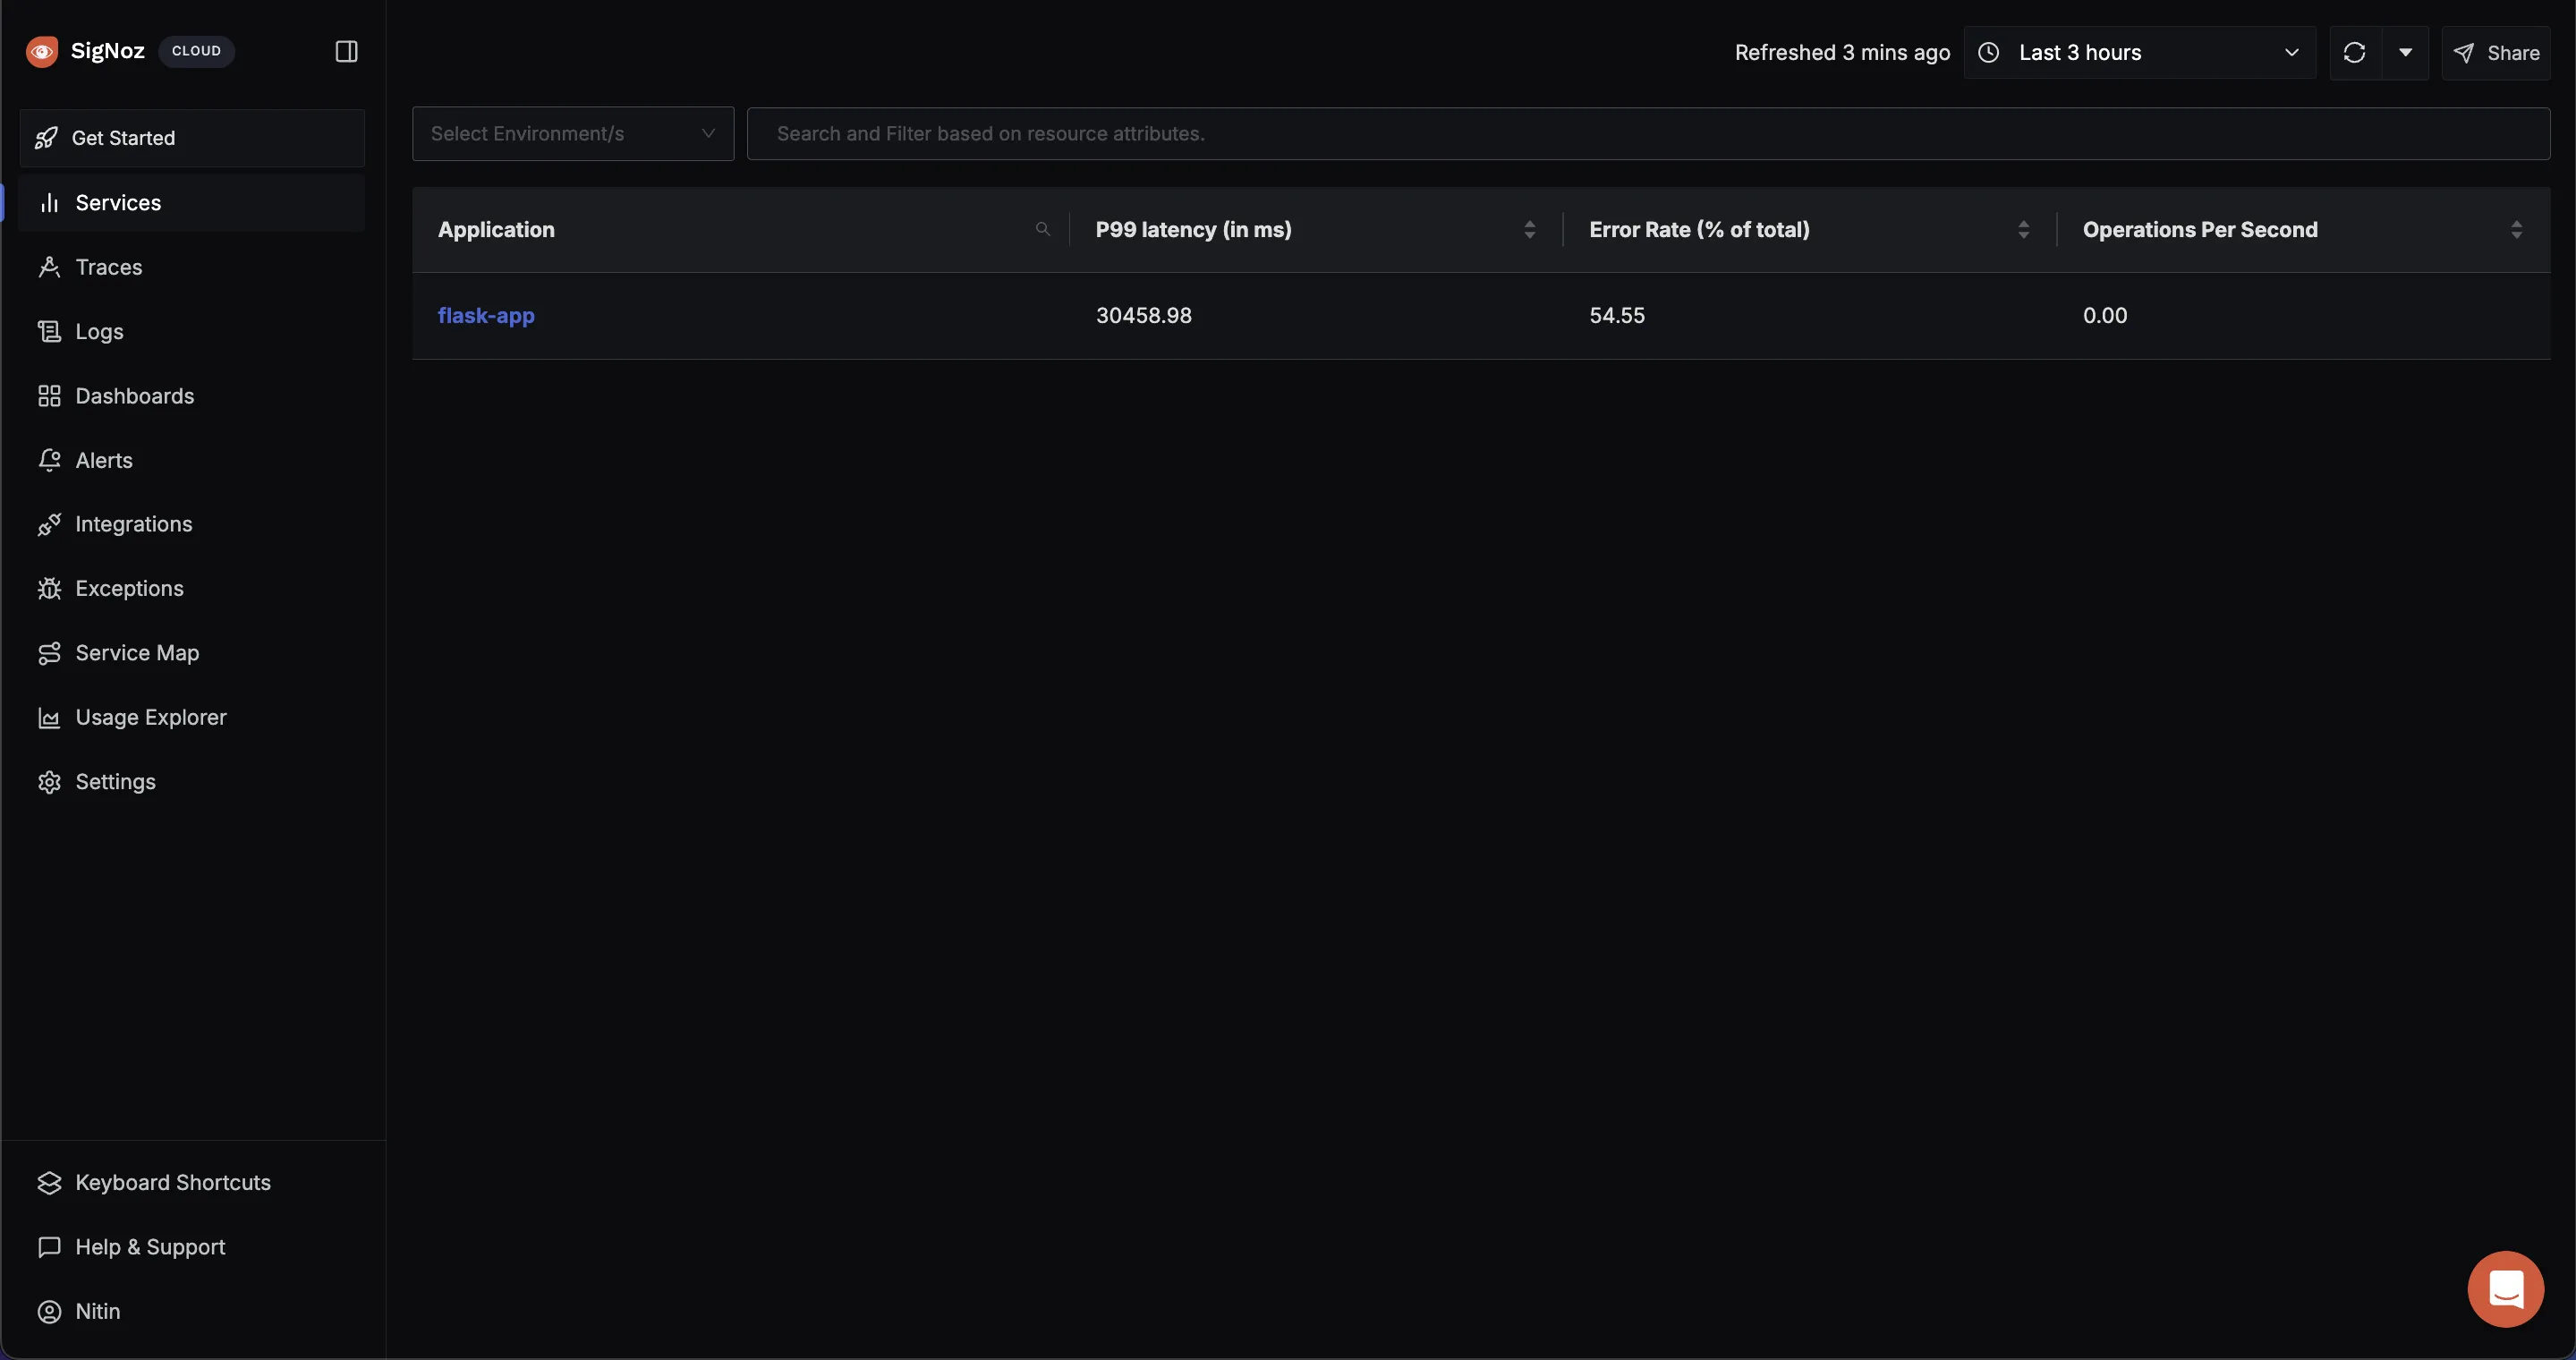
Clicking on the Service flask-app you will see something like this, where you can check the latency, key Operations etc.
- Checking the traces:
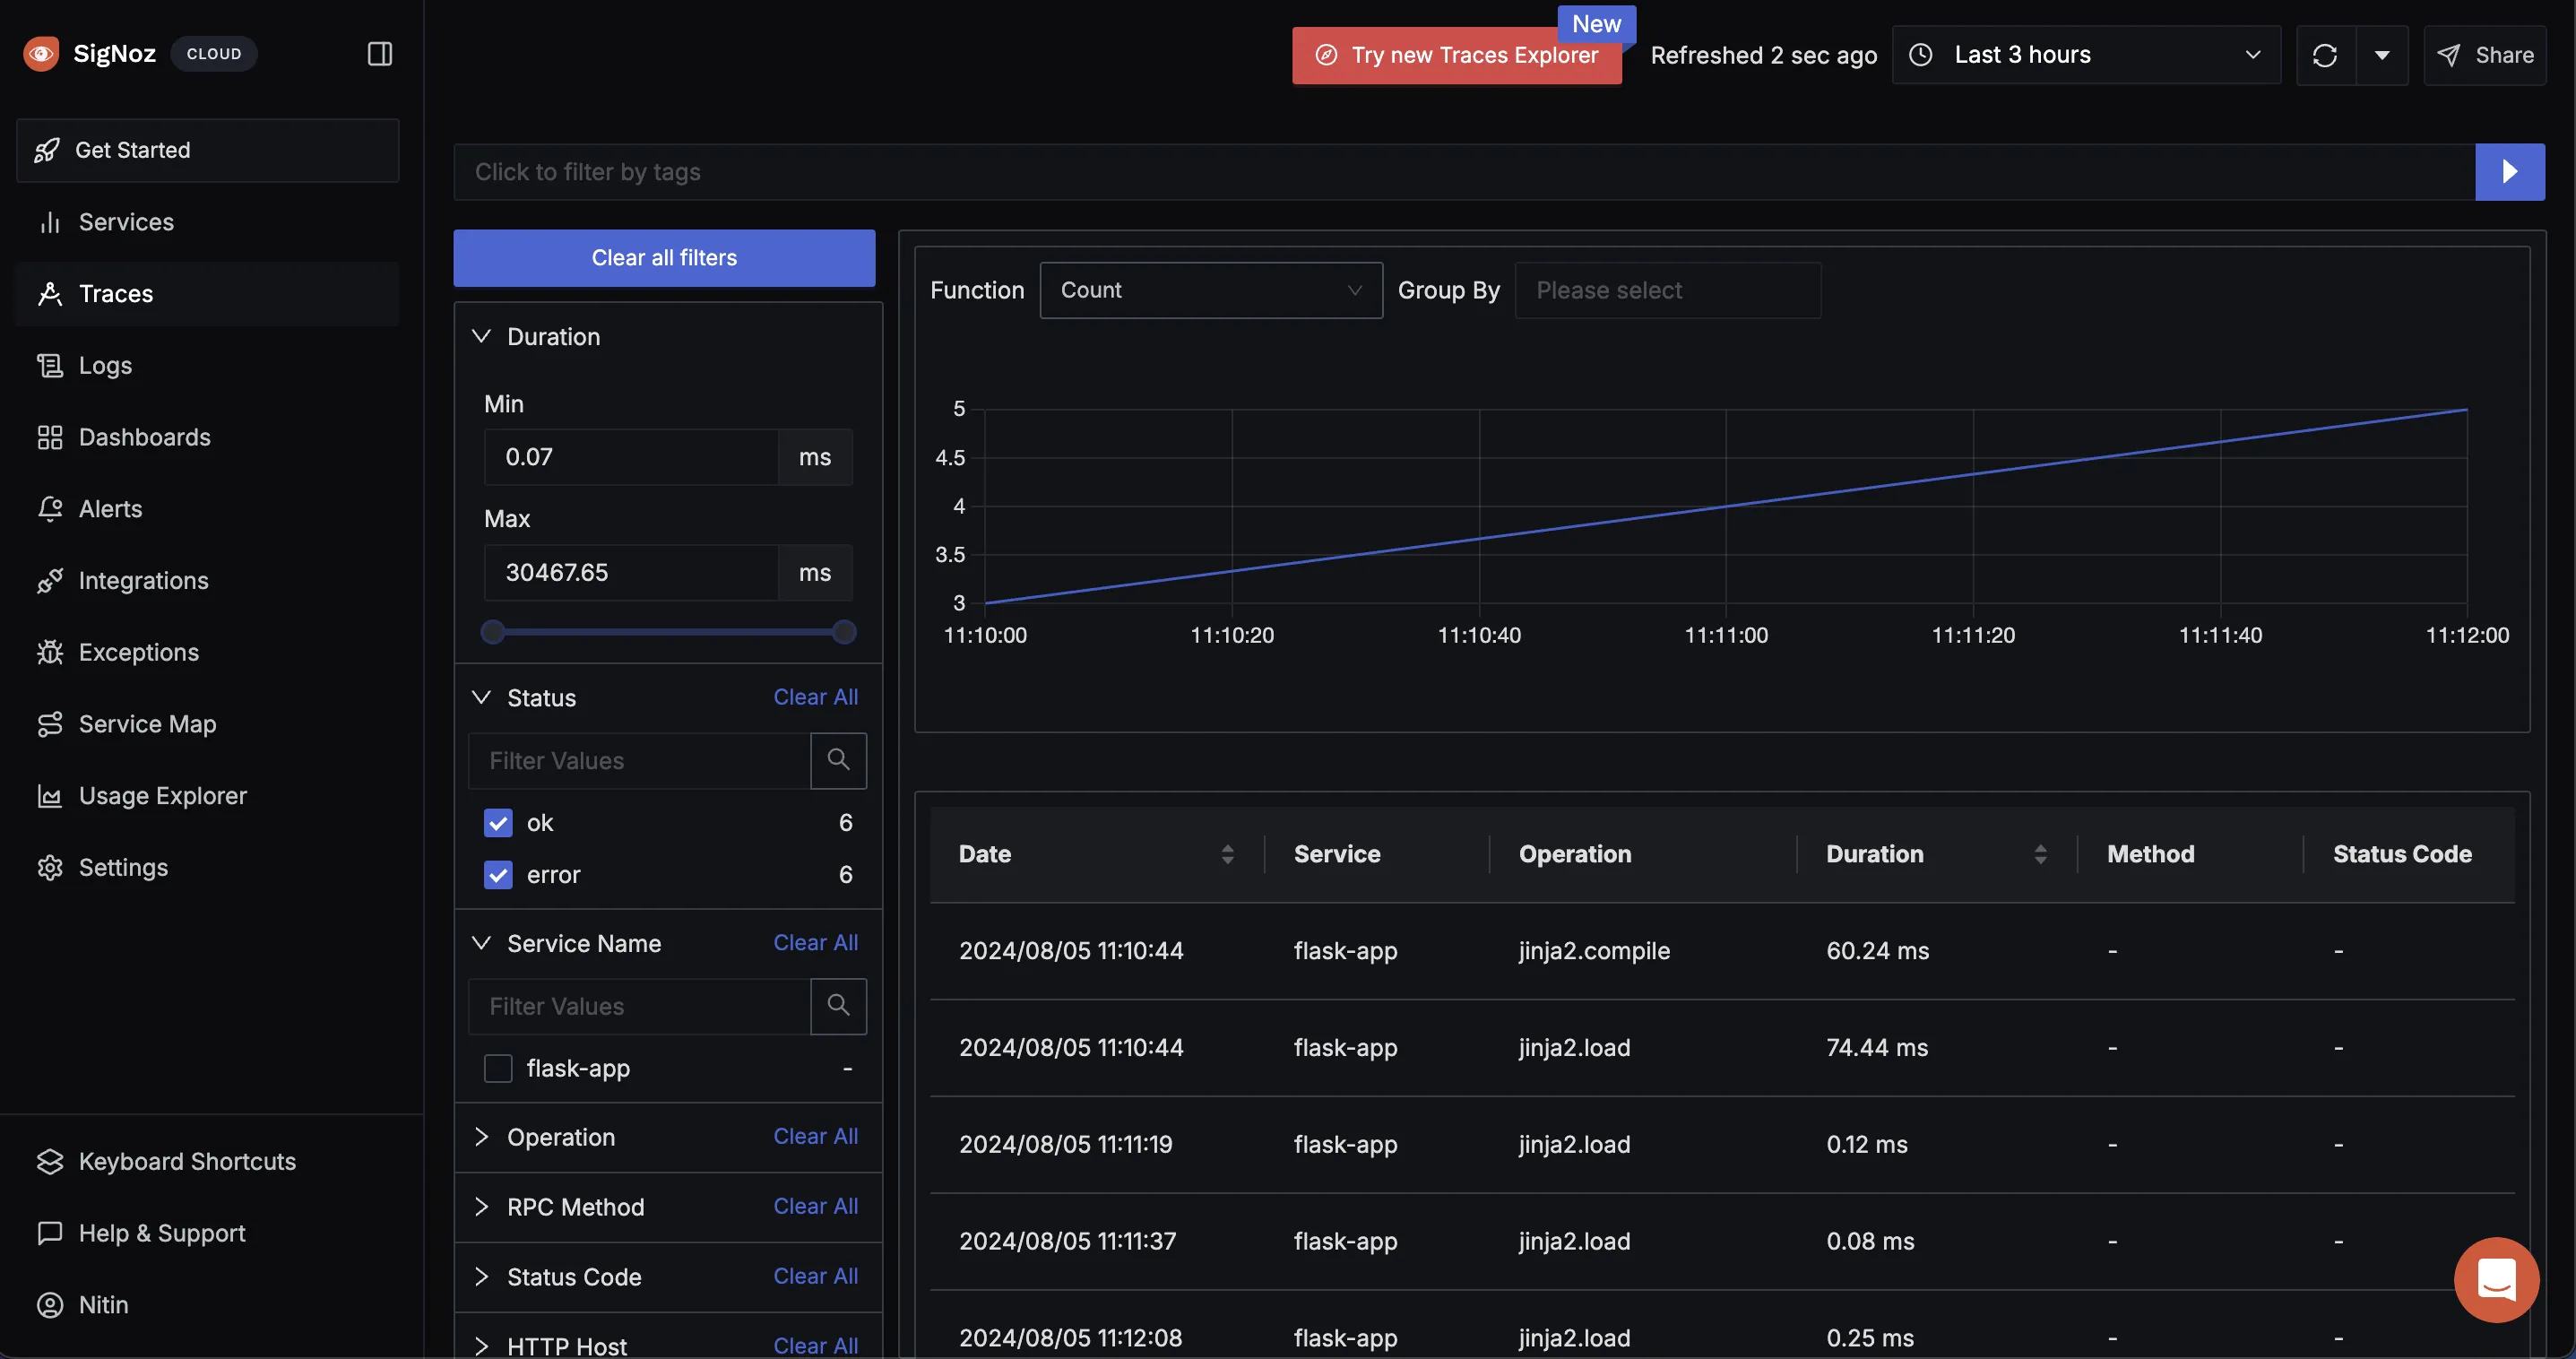
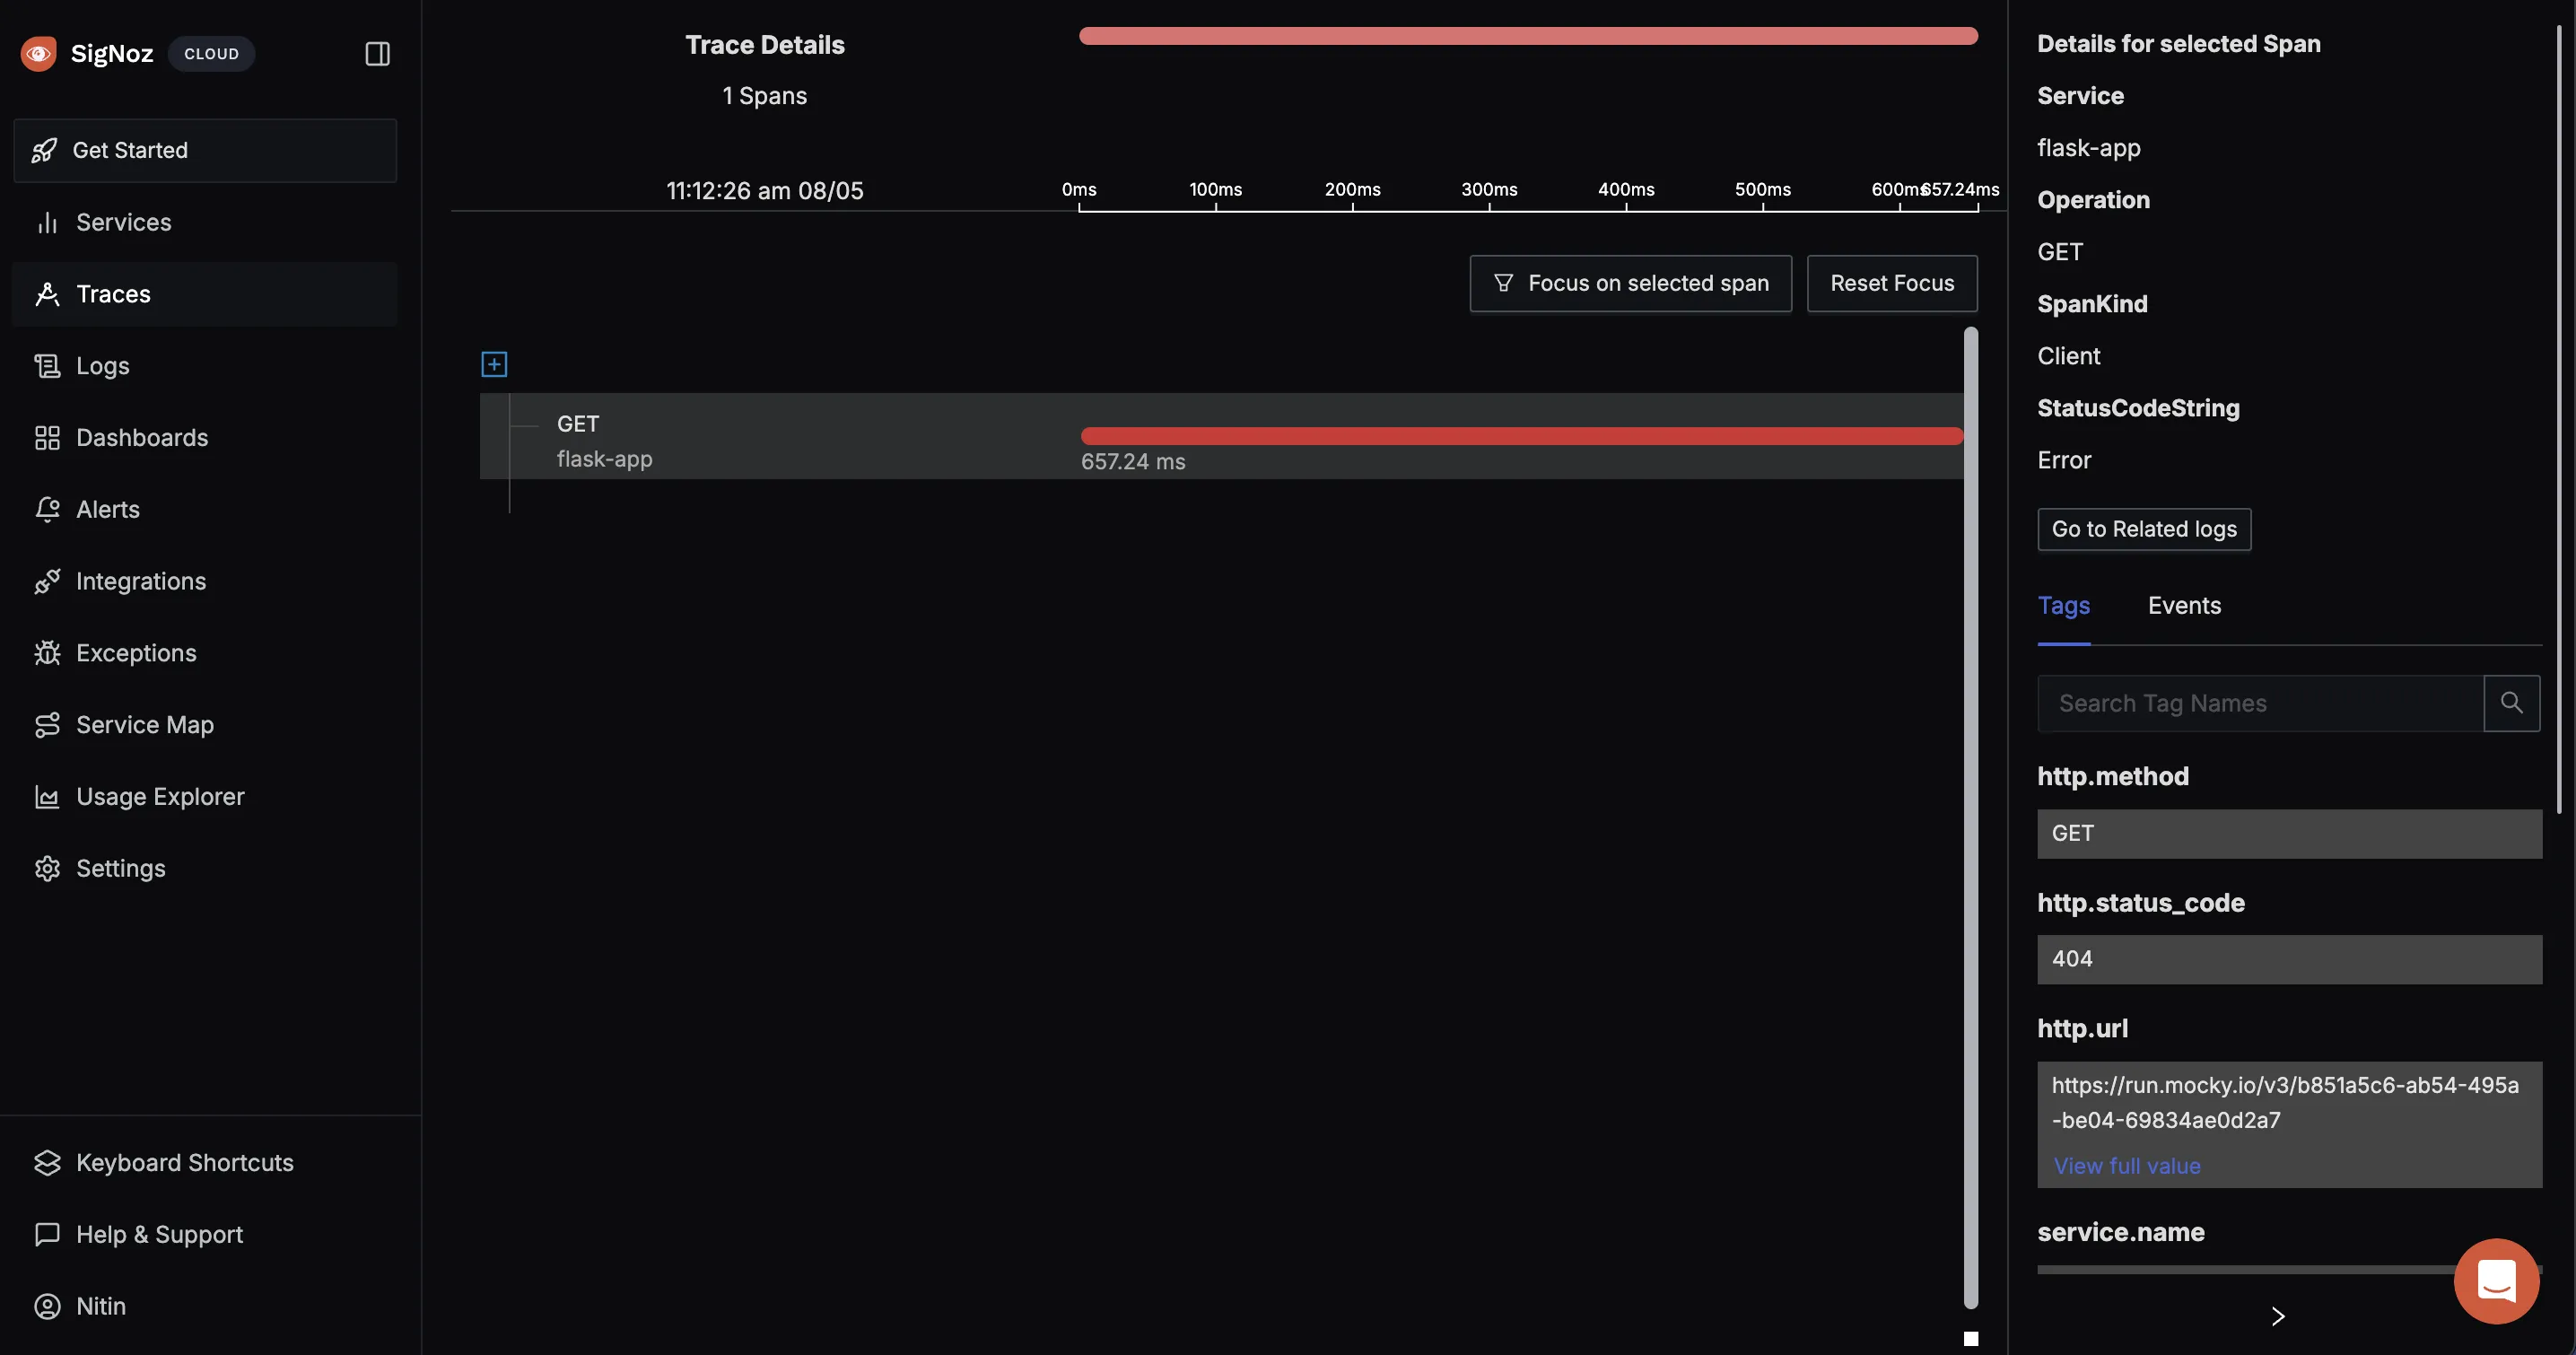
Click on the traces you want to see we are seeing GET request operations
Check only the Error tag in the Status menu to filter traces by errors.
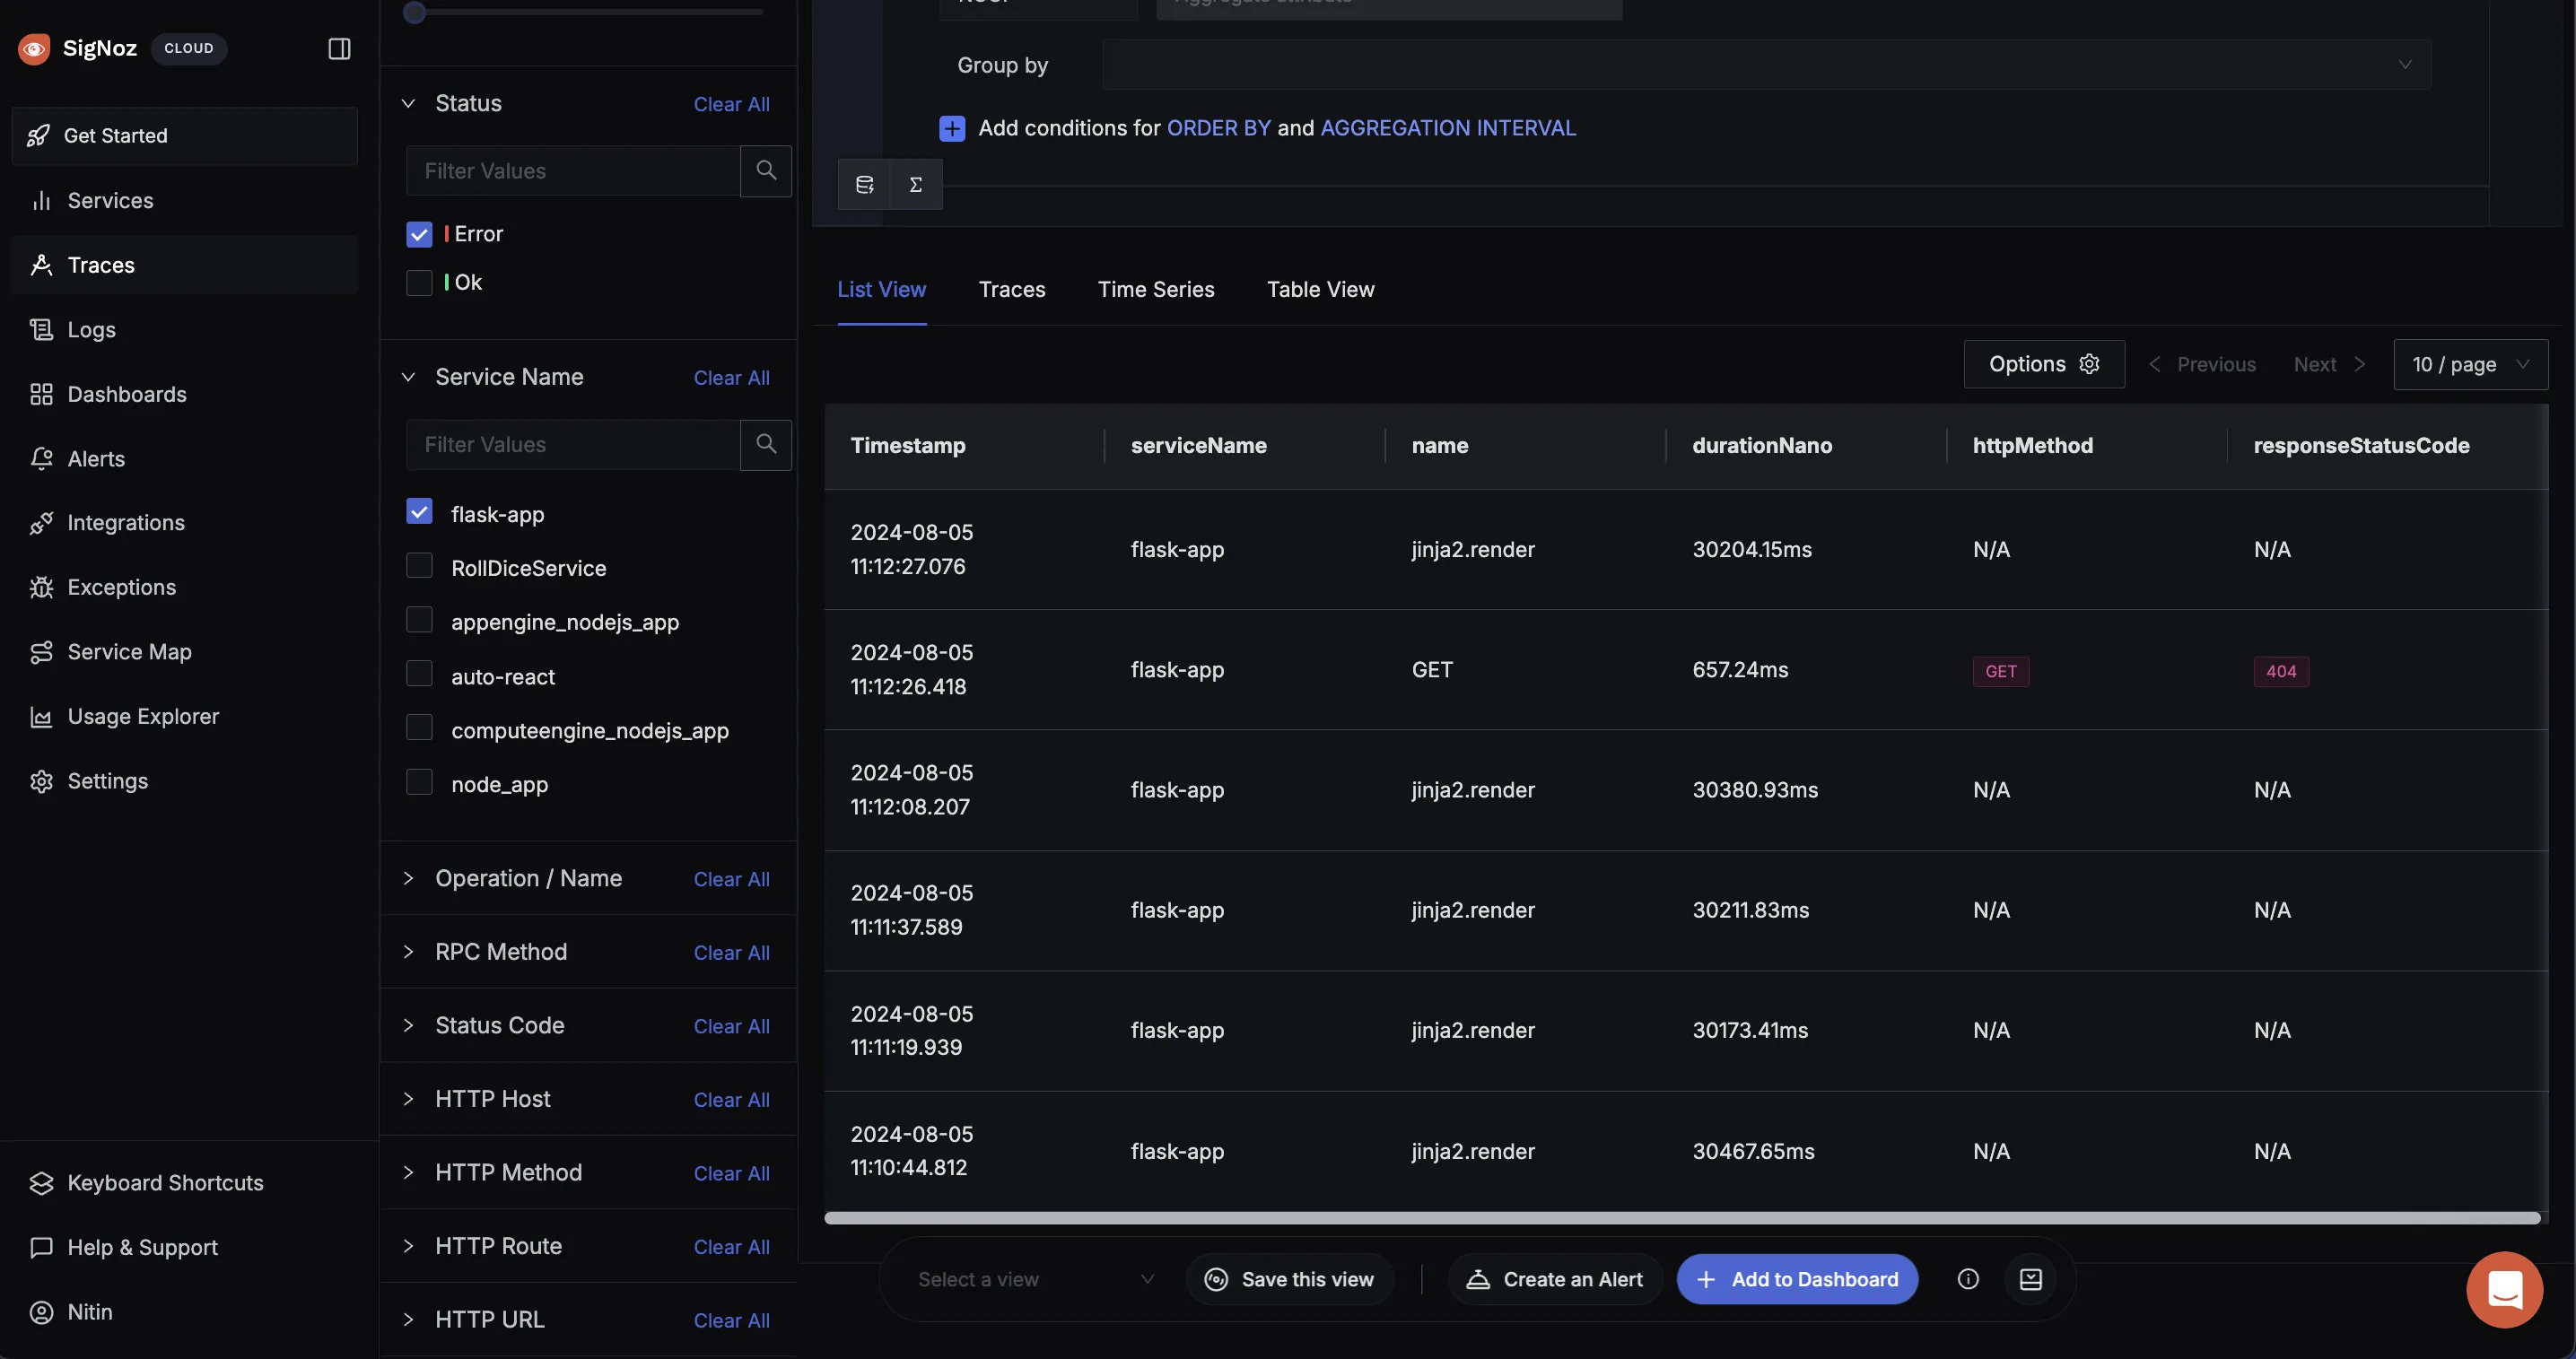
There are many functionality that SigNoz offers, you can change it according to your need.
The Future of APM: Trends and Innovations
The APM landscape continues to evolve:
- AI and machine learning: Machine learning algorithms can spot abnormalities in performance data that traditional monitoring methods may overlook, allowing for faster issue identification and resolution. That is why AI and machine learning are being incorporated into APM systems to analyse massive volumes of performance data and detect trends. This allows predictive APM, which forecasts and addresses possible issues before they affect consumers.
- AIOps: AIOps combines big data and machine learning to automate the detection and remediation of performance issues. This reduces the need for manual intervention and speeds up the resolution process.
- Edge computing and IoT: As edge computing and the Internet of Things (IoT) gain popularity, APM systems are evolving to monitor performance across widely distributed and low-power devices. This necessitates lightweight agents and effective data collecting techniques. Edge computing requires real-time performance analytics to guarantee that applications operating on edge devices fulfil performance requirements.
- Shift-left APM: Shift-left APM involves integrating performance monitoring and optimization earlier in the development lifecycle. This approach helps in identifying and resolving performance issues during the design and development stages, rather than in production.
Key Takeaways
- APM is crucial for maintaining high-performing, reliable applications that meet user expectations.
- APM provides valuable data that can drive decision-making across the organization. Engineers use this data to optimize application performance, allocate resources more effectively, and prioritize development efforts based on real-world performance insights.
- One-size-fits-all APM solutions are rarely effective. It is very important to customize APM tools and dashboards to fit the specific needs and architecture of your applications, ensuring that the most relevant metrics are monitored.
- Implementing APM requires a strategic approach, starting with critical applications and gradually expanding coverage. Continuous refinement and adaptation are key.
- APM practices must evolve with changing application architectures, including microservices, cloud-native environments, and edge computing.
- Ensure that the team is well-trained in using APM tools and interpreting data is crucial for effective performance management. Continuous education and training help teams stay proficient and get the most value from their APM investments.
FAQs
What's the difference between APM and observability?
APM focusses on monitoring and controlling application performance, offering insights into how they work, and discovering performance concerns. Observability, on the other hand, is a larger term that includes not just APM but also infrastructure monitoring, log management, and other elements of system visibility. It seeks to give a holistic perspective of the system's health and behaviour.
How does APM impact application security?
APM can improve application security by looking for odd patterns that might point to a security vulnerability, such as unexpected spikes in traffic or changes in application behaviour. However, it is critical to verify that the APM tools are safe and do not bring new vulnerabilities into the system. Proper configuration and access restrictions are essential for the security of APM deployments.
Can APM be used in legacy systems?
Yes, APM can be implemented in legacy systems, although it may require different strategies compared to modern applications. Some APM tools are designed with features specifically for monitoring legacy technologies, allowing you to gain performance insights and optimize even older systems. The key is to select an APM tool that supports the specific technologies and architectures of your legacy applications.
What are the key metrics to focus on in APM?
In APM, key metrics to focus on include response time, error rate, throughput, and resource utilization. Response time measures how long it takes for the application to respond to requests, while error rate tracks the frequency of errors occurring in the application. Throughput refers to the number of transactions or requests processed by the application over a given period, and resource utilization monitors the usage of system resources such as CPU, memory, and network bandwidth. The specific metrics to prioritize will depend on your application's nature and your business requirements.
