What is Prometheus for Monitoring?
In monitoring, Prometheus is used for collecting and processing metrics from its targets, which can be applications, servers, databases, or any system that exposes metrics via an HTTP endpoint. It uses a pull-based model, where it periodically scrapes the targets' metrics endpoints to gather data on various aspects such as resource utilization, response times, error rates, and custom application metrics. This data is then stored in a time-series database and can be queried using PromQL (Prometheus Query Language), enabling users to analyze trends, visualize data in dashboards, and set up alerts based on predefined conditions.
What is Prometheus?
Prometheus is an open-source monitoring and alerting toolkit originally built at SoundCloud. Since its inception in 2012, it has grown to become a robust monitoring system, now part of the Cloud Native Computing Foundation (CNCF). Prometheus excels in collecting and storing metrics as time series data, recording information with a timestamp and optional key-value pairs called labels.
Components in Prometheus Architecture
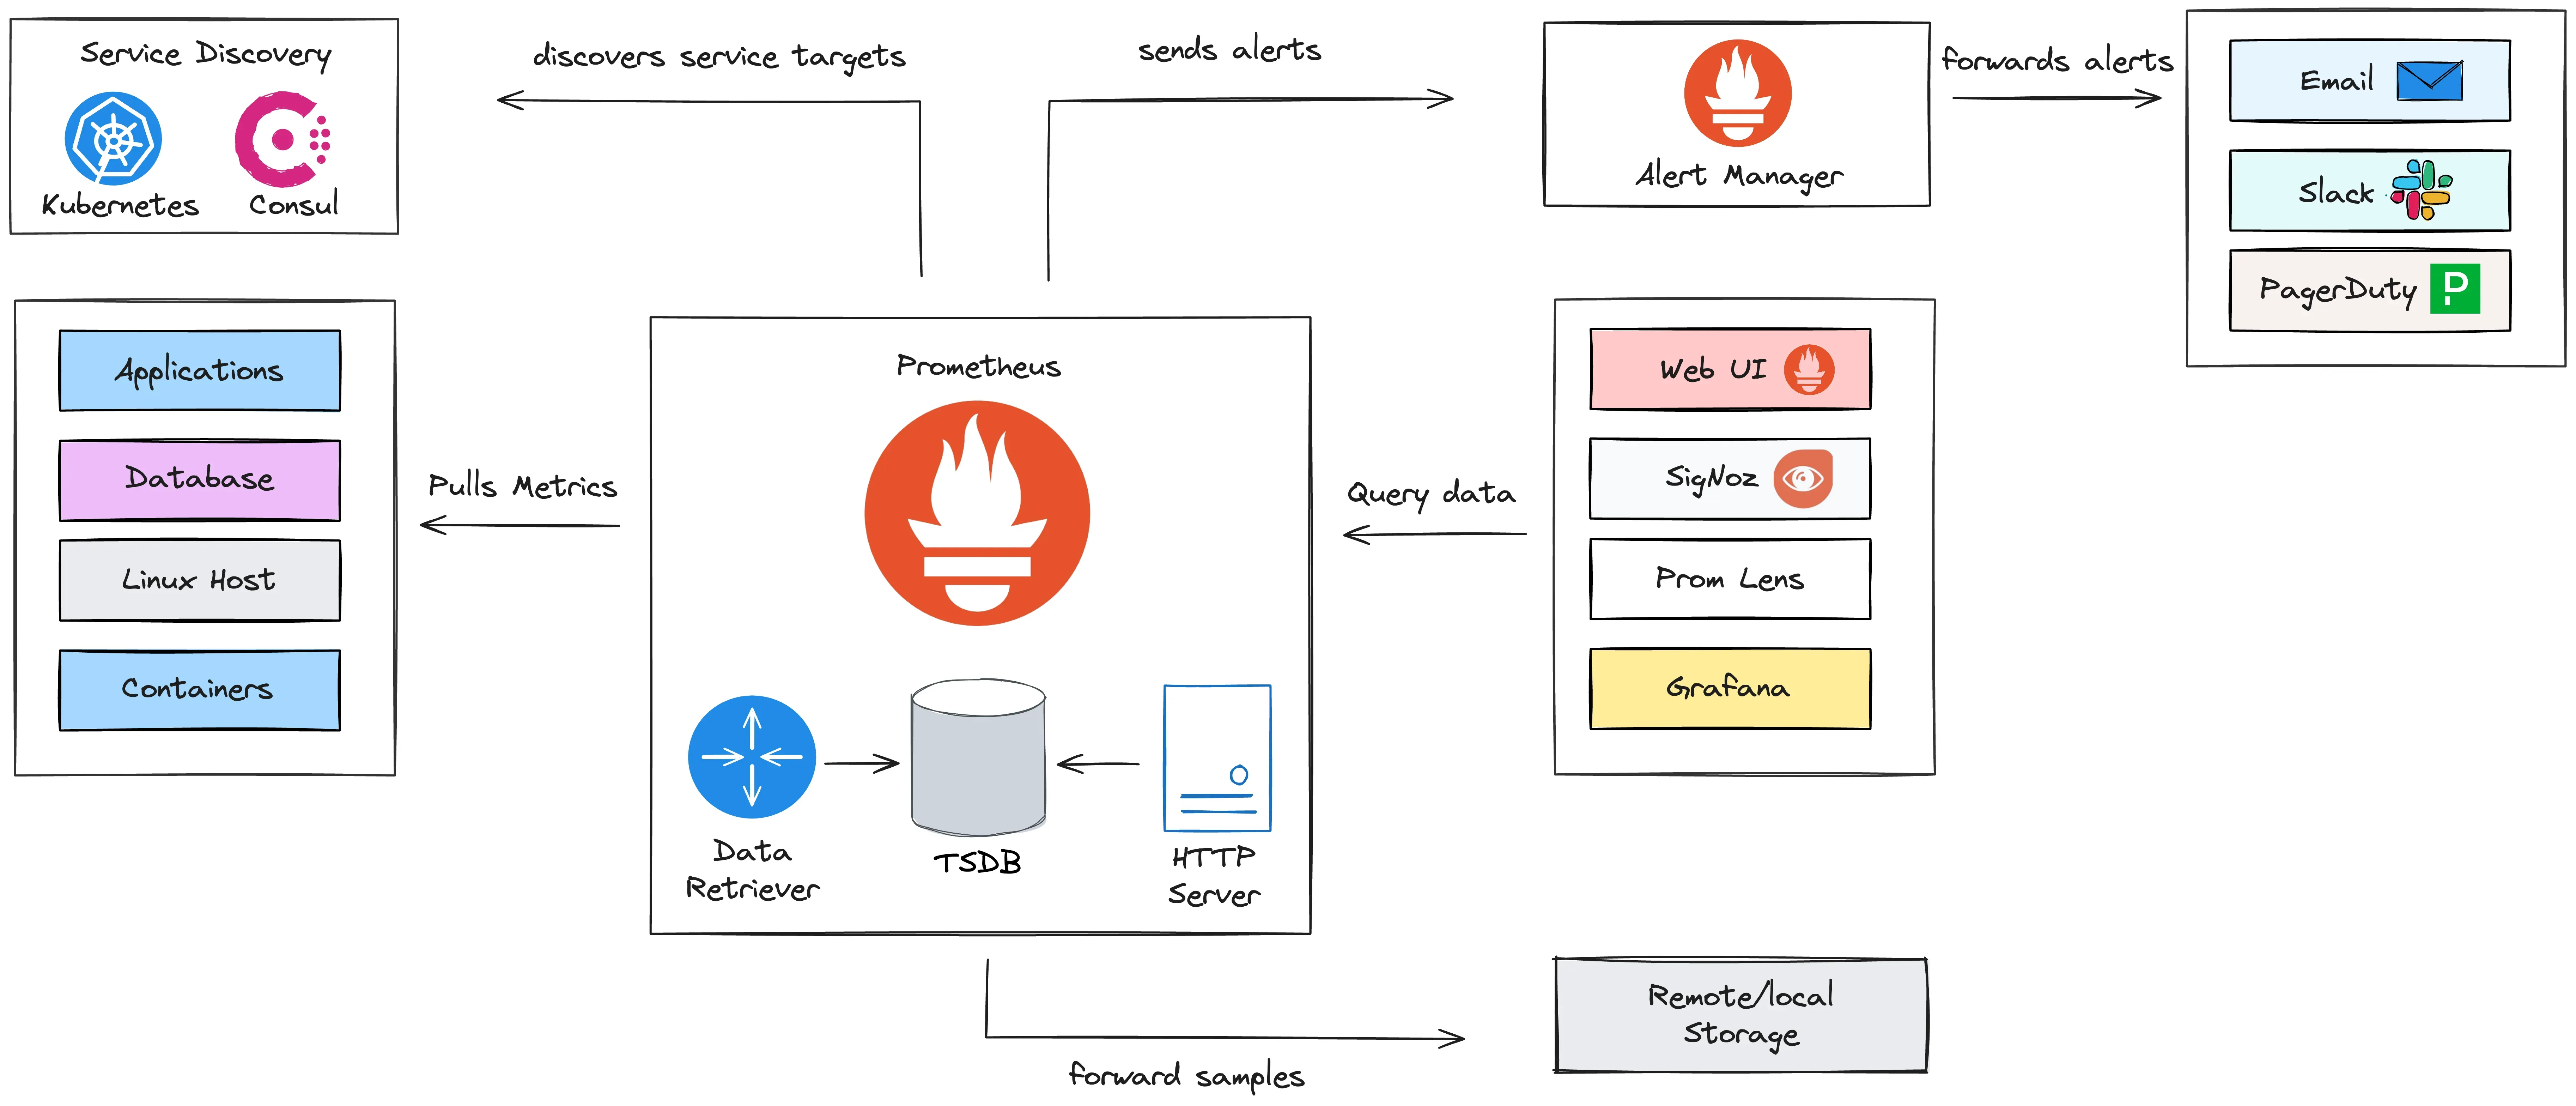
Prometheus is made up of different components which work together, allowing Prometheus to effectively monitor targets. They are:
- Prometheus Server
- Pushgateway
- Alert Manager
- Prometheus Targets
- Client Libraries
- Prometheus Exporters
- Service Discovery
Prometheus Server
The Prometheus server is the core component responsible for scraping and storing time series data. It periodically pulls metrics from instrumented jobs, known as targets, and stores the collected data locally. This server forms the heart of the Prometheus monitoring system.
Pushgateway
The Pushgateway is an intermediary component that allows short-lived jobs, such as batch jobs, to push their metrics to Prometheus. This is particularly useful for jobs that do not exist long enough to be scraped by the Prometheus server directly.
Exporters
Exporters are used to expose metrics from third-party systems, such as databases, hardware, or other services, in a format that Prometheus can scrape. Exporters act as bridges between Prometheus and the systems being monitored, converting their native metrics into a Prometheus-compatible format.
Alertmanager
The Alertmanager handles alerts generated by the Prometheus server. It is responsible for deduplicating, grouping, and routing alerts to appropriate receivers, such as email, PagerDuty, or Slack. This ensures that alerts are managed and delivered efficiently.
Client Libraries
Client libraries are available in various programming languages, including Go, Java, and Python. These libraries enable developers to instrument their applications and expose metrics in a format that Prometheus can scrape. This allows custom application metrics to be integrated into the monitoring system.
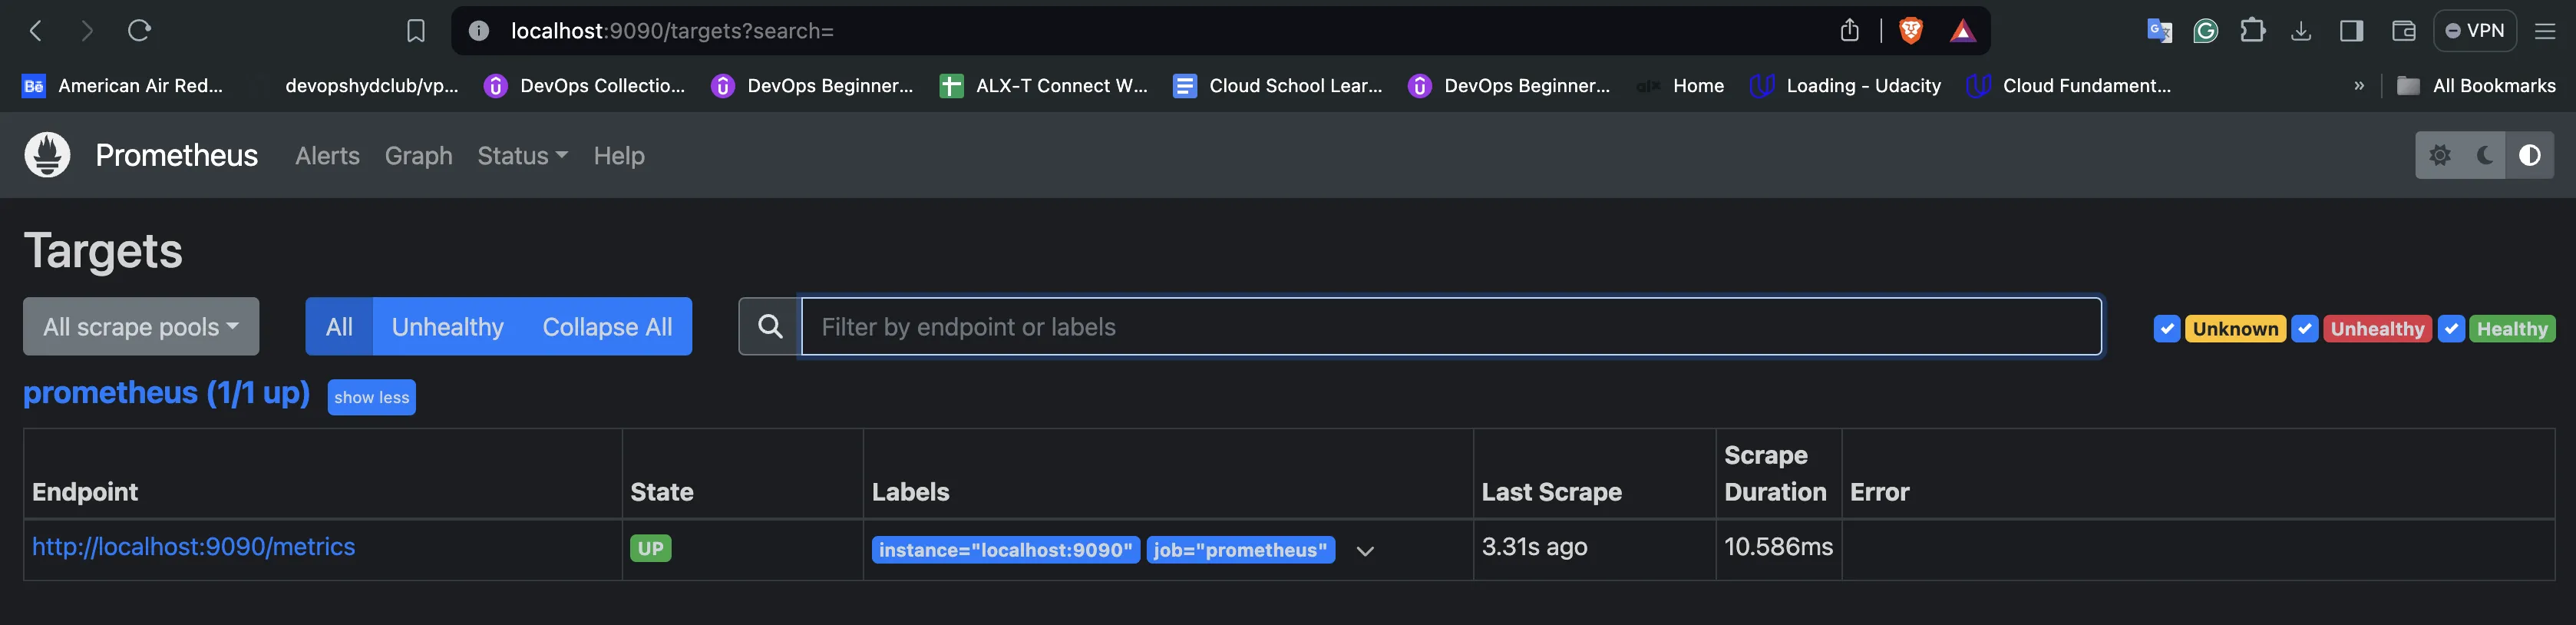
Prometheus Targets
Prometheus targets are the endpoints from which the Prometheus server scrapes metrics. These targets can be instrumented applications, services, or systems that expose metrics endpoints. Targets can be specified manually or discovered dynamically through service discovery mechanisms.
Service Discovery
Service discovery mechanisms enable Prometheus to automatically find and scrape targets in dynamic environments. This can include Kubernetes, Consul, or other service discovery systems. Service discovery allows Prometheus to adapt to changes in the infrastructure without manual intervention.
Quick Start with Prometheus
This quick start guide will help you get Prometheus up and running in a few simple steps.
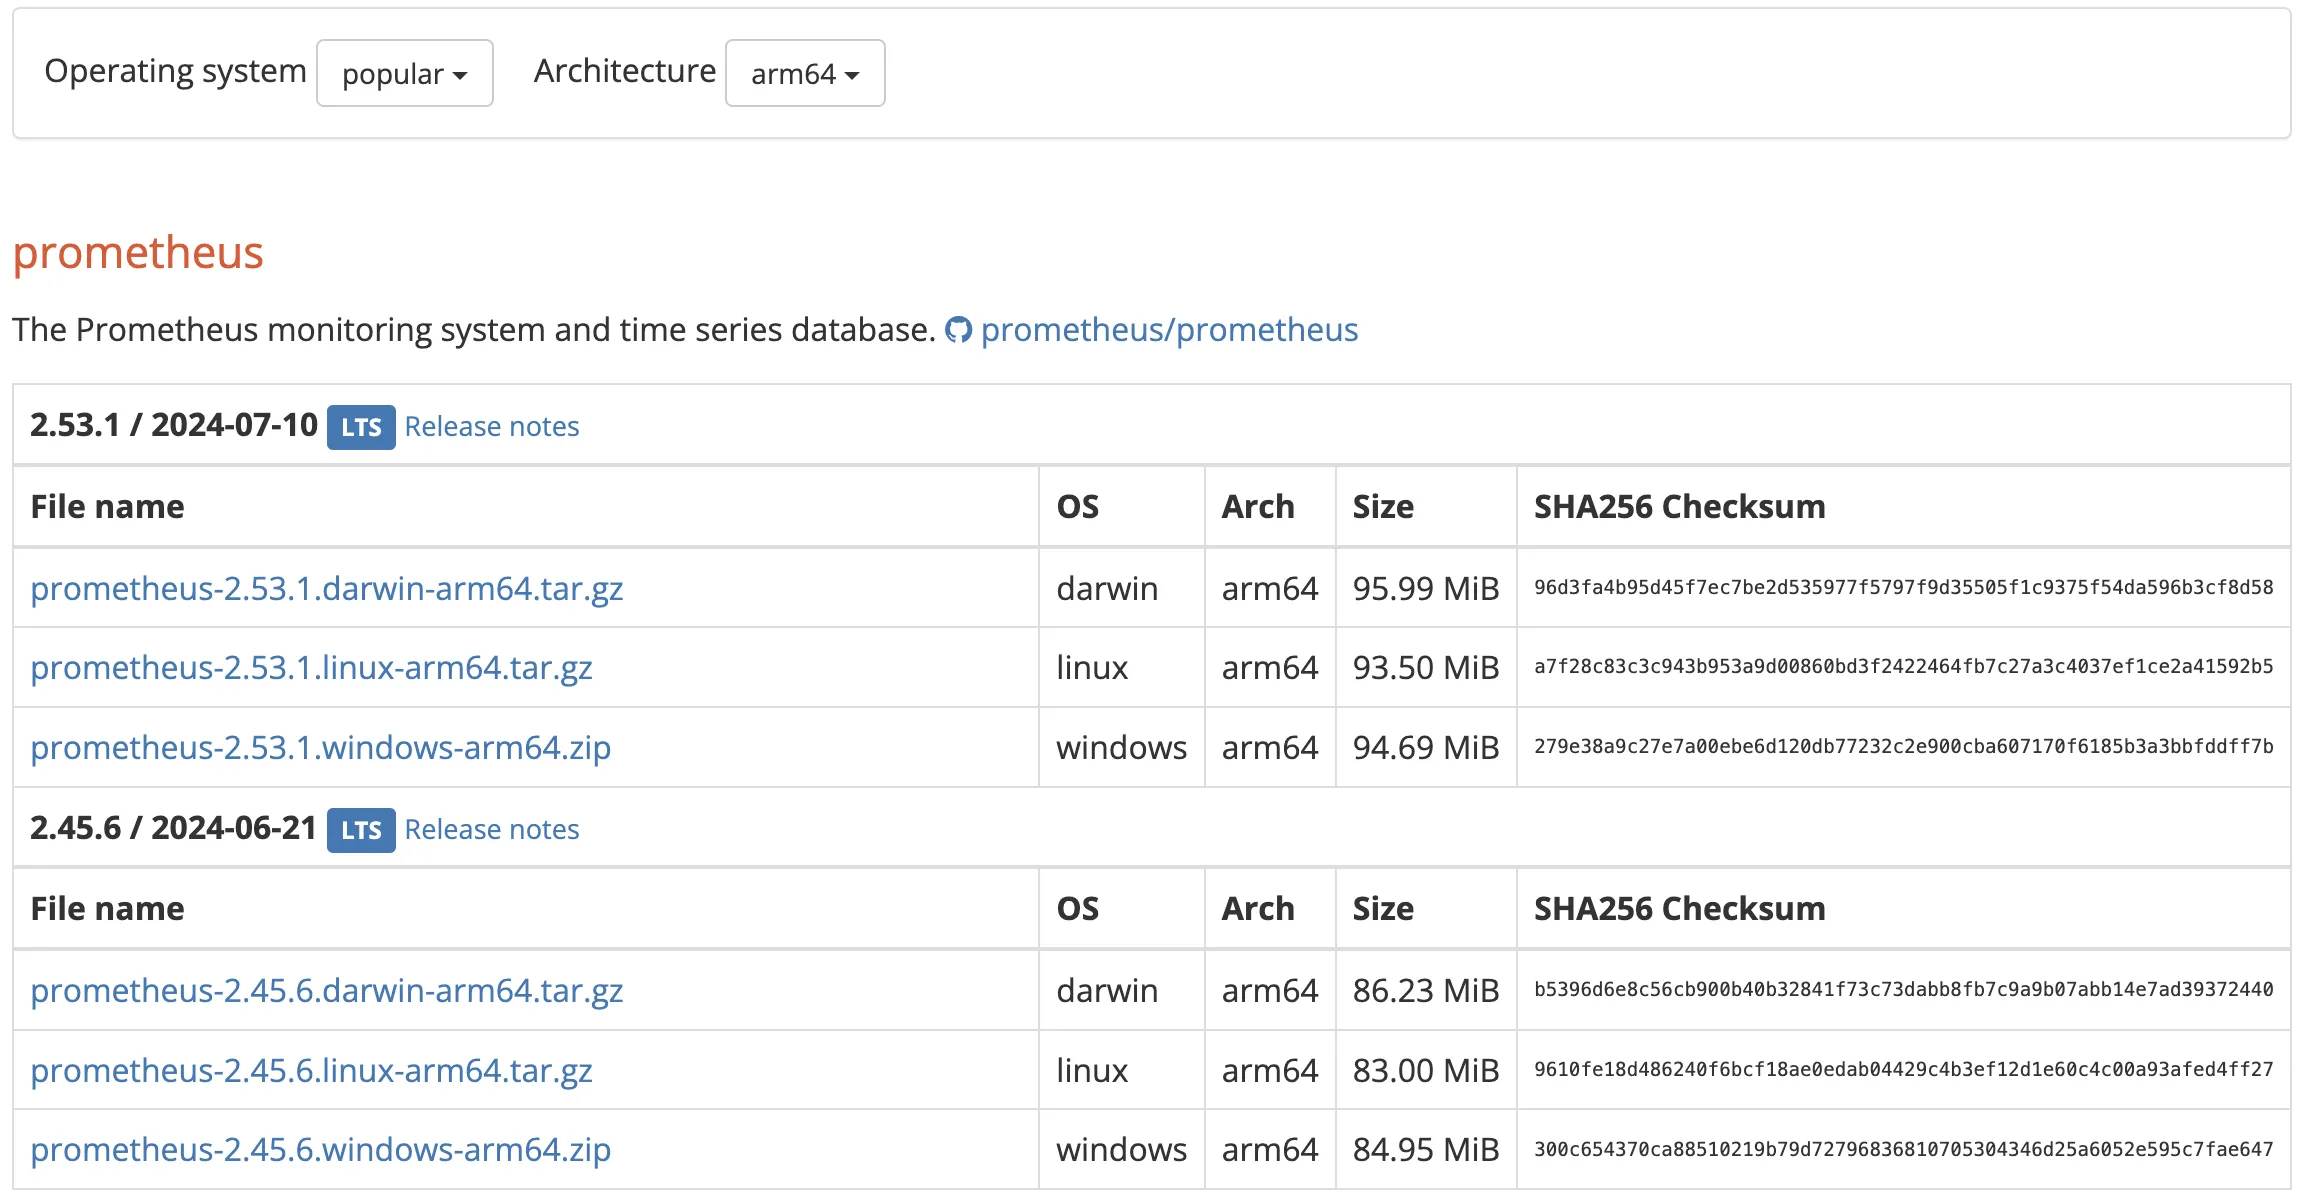
- Download Prometheus
To download Prometheus on your system, visit the Prometheus download page. Set your system architecture and identify the appropriate package for your operating system (Linux, macOS, Windows). Click on the download link for the latest stable release.
- Configure
prometheus.ymlfile
After downloading Prometheus, extract the tarball downloaded file. You'll find a file named prometheus.yml in the extracted directory.
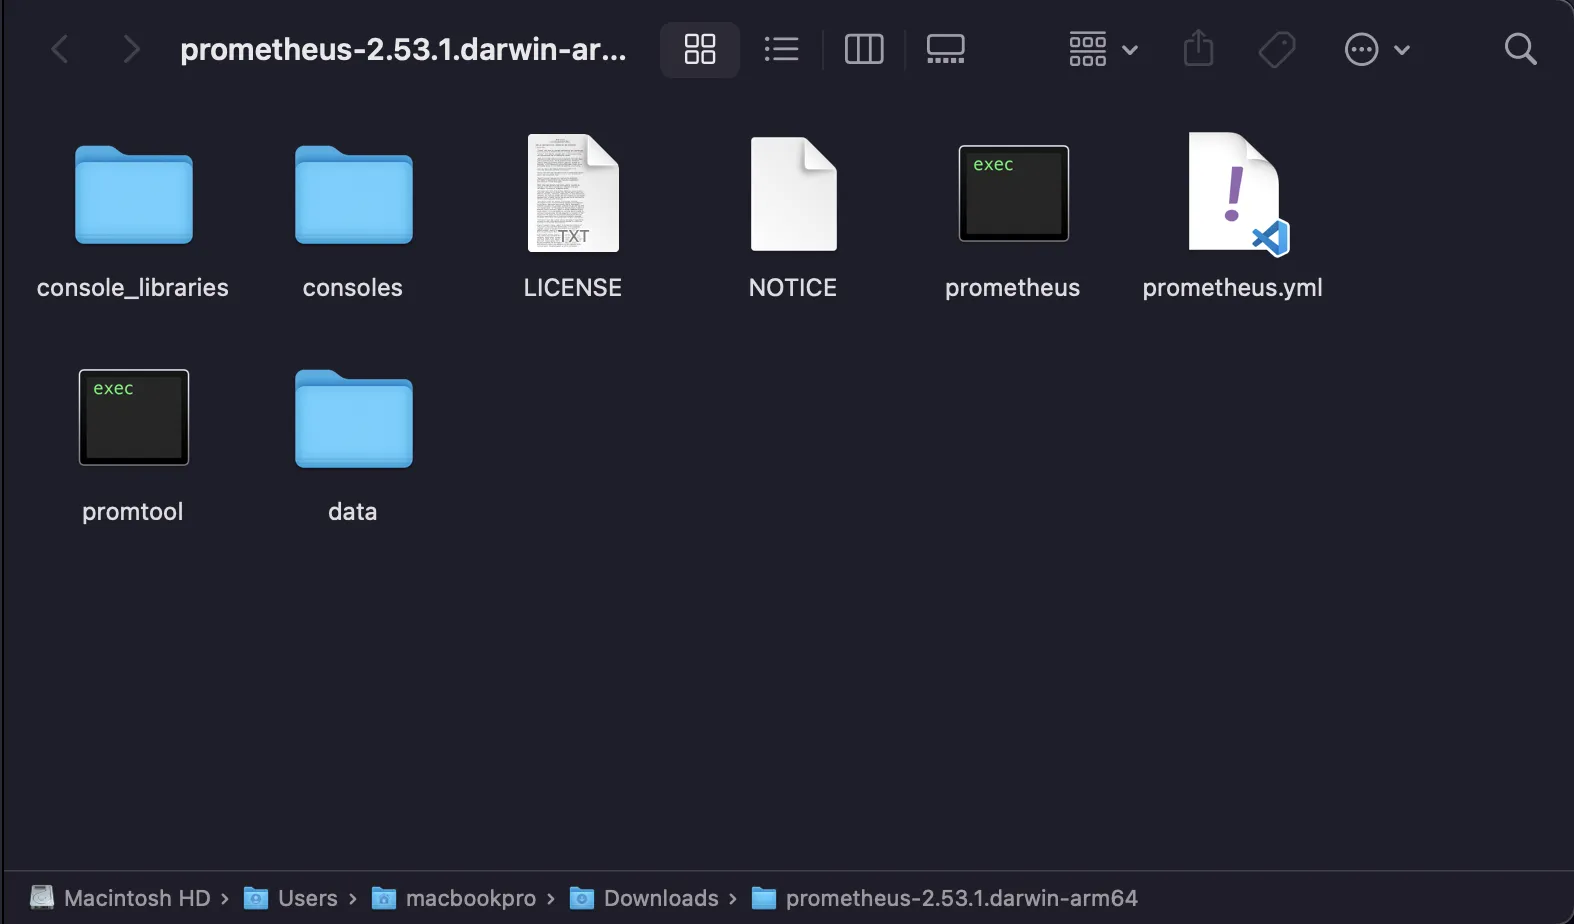
Prometheus uses a configuration file named prometheus.yml to specify which targets to monitor and how to scrape them. Open prometheus.yml in a text editor.
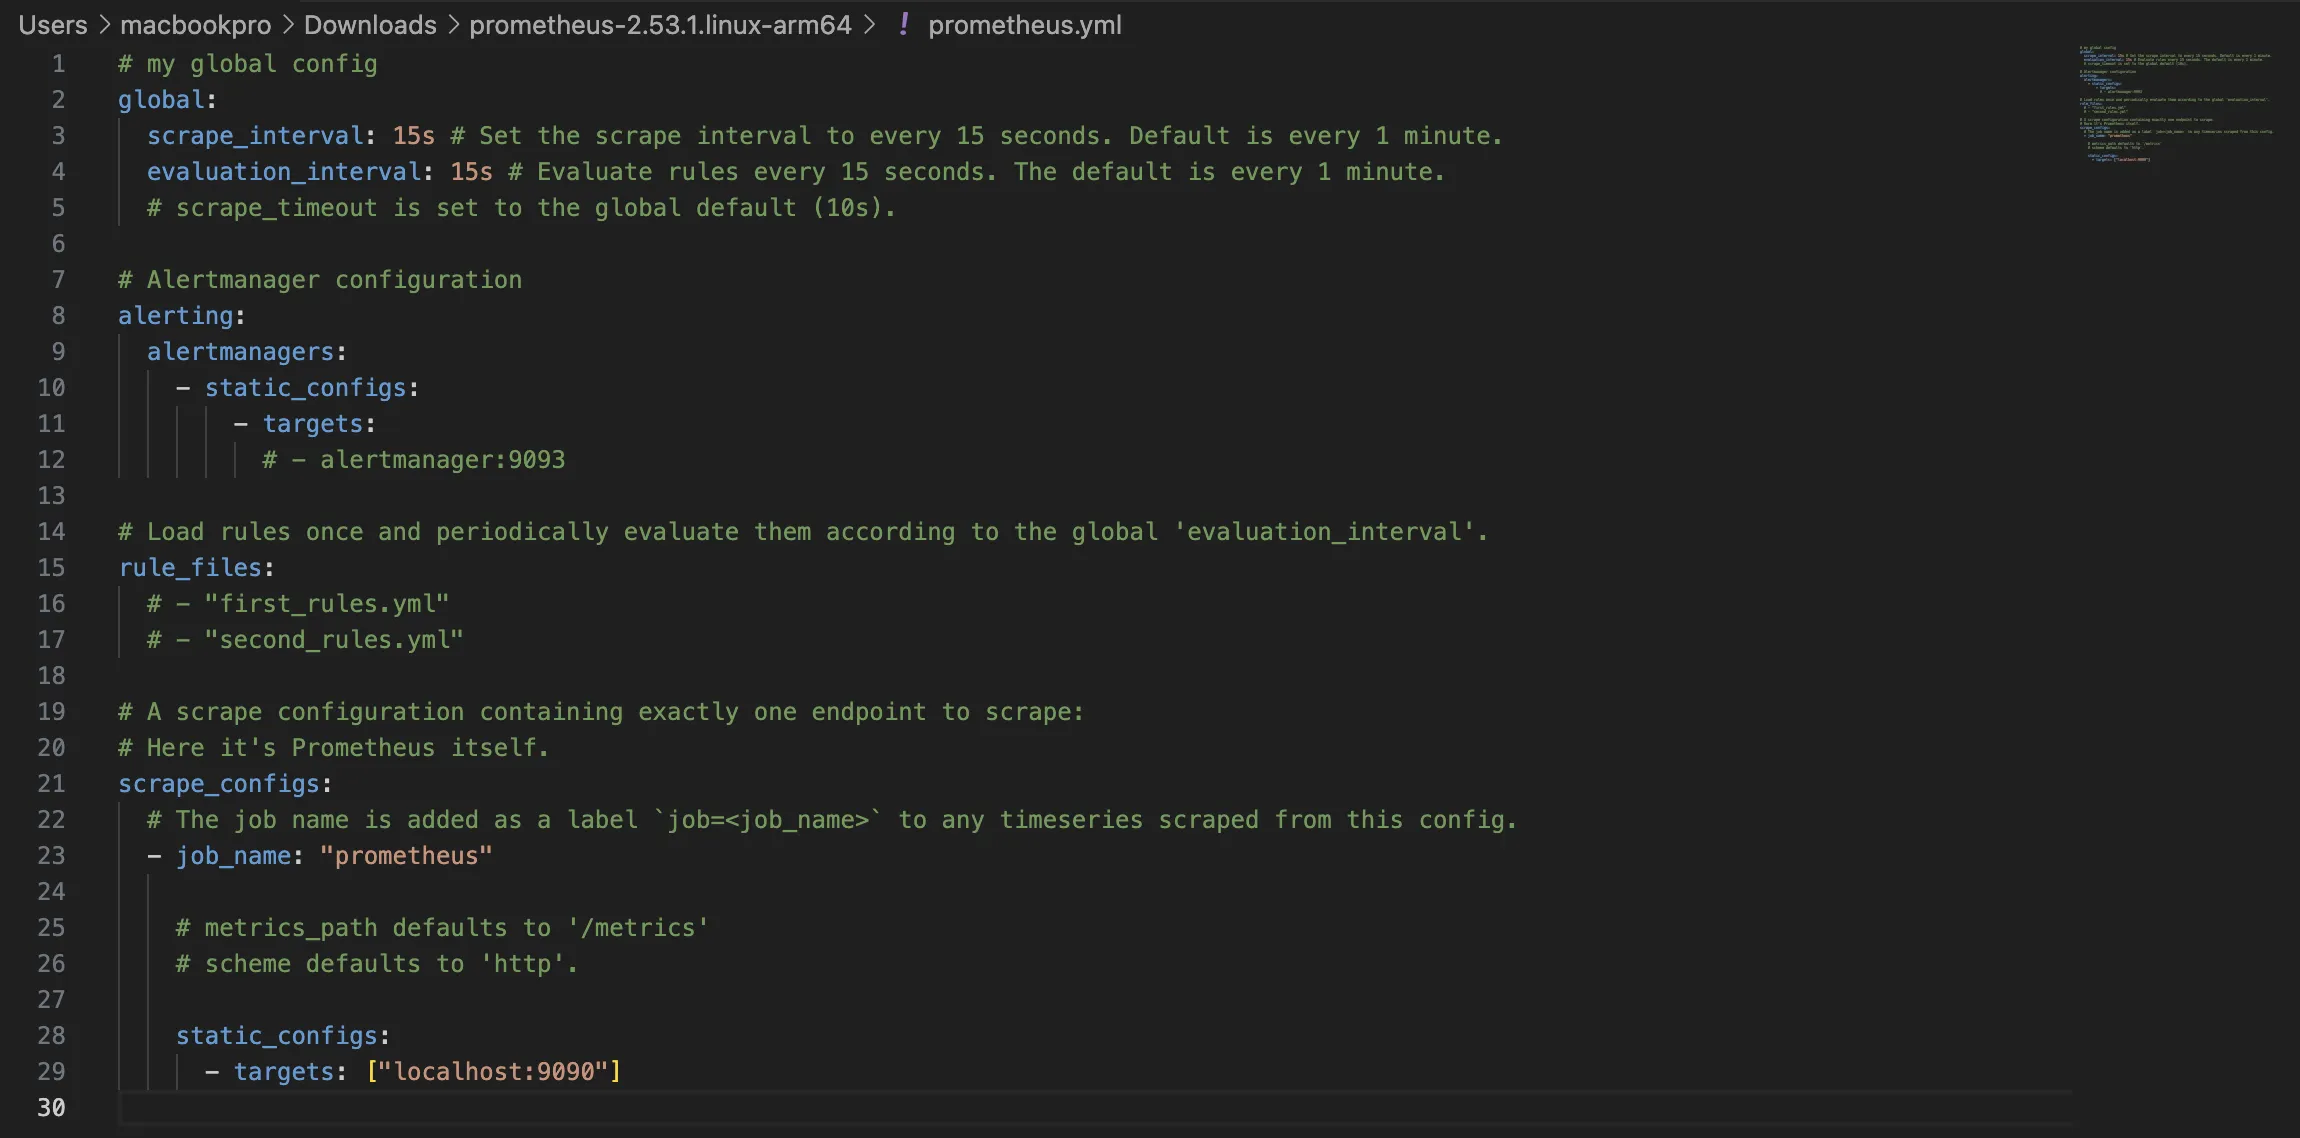
In the prometheus.yml file, you will see that Prometheus is configured to scrape metrics from itself. You can add other scrape configurations for Prometheus to scrape metrics from different targets on your system.
- Start Prometheus server
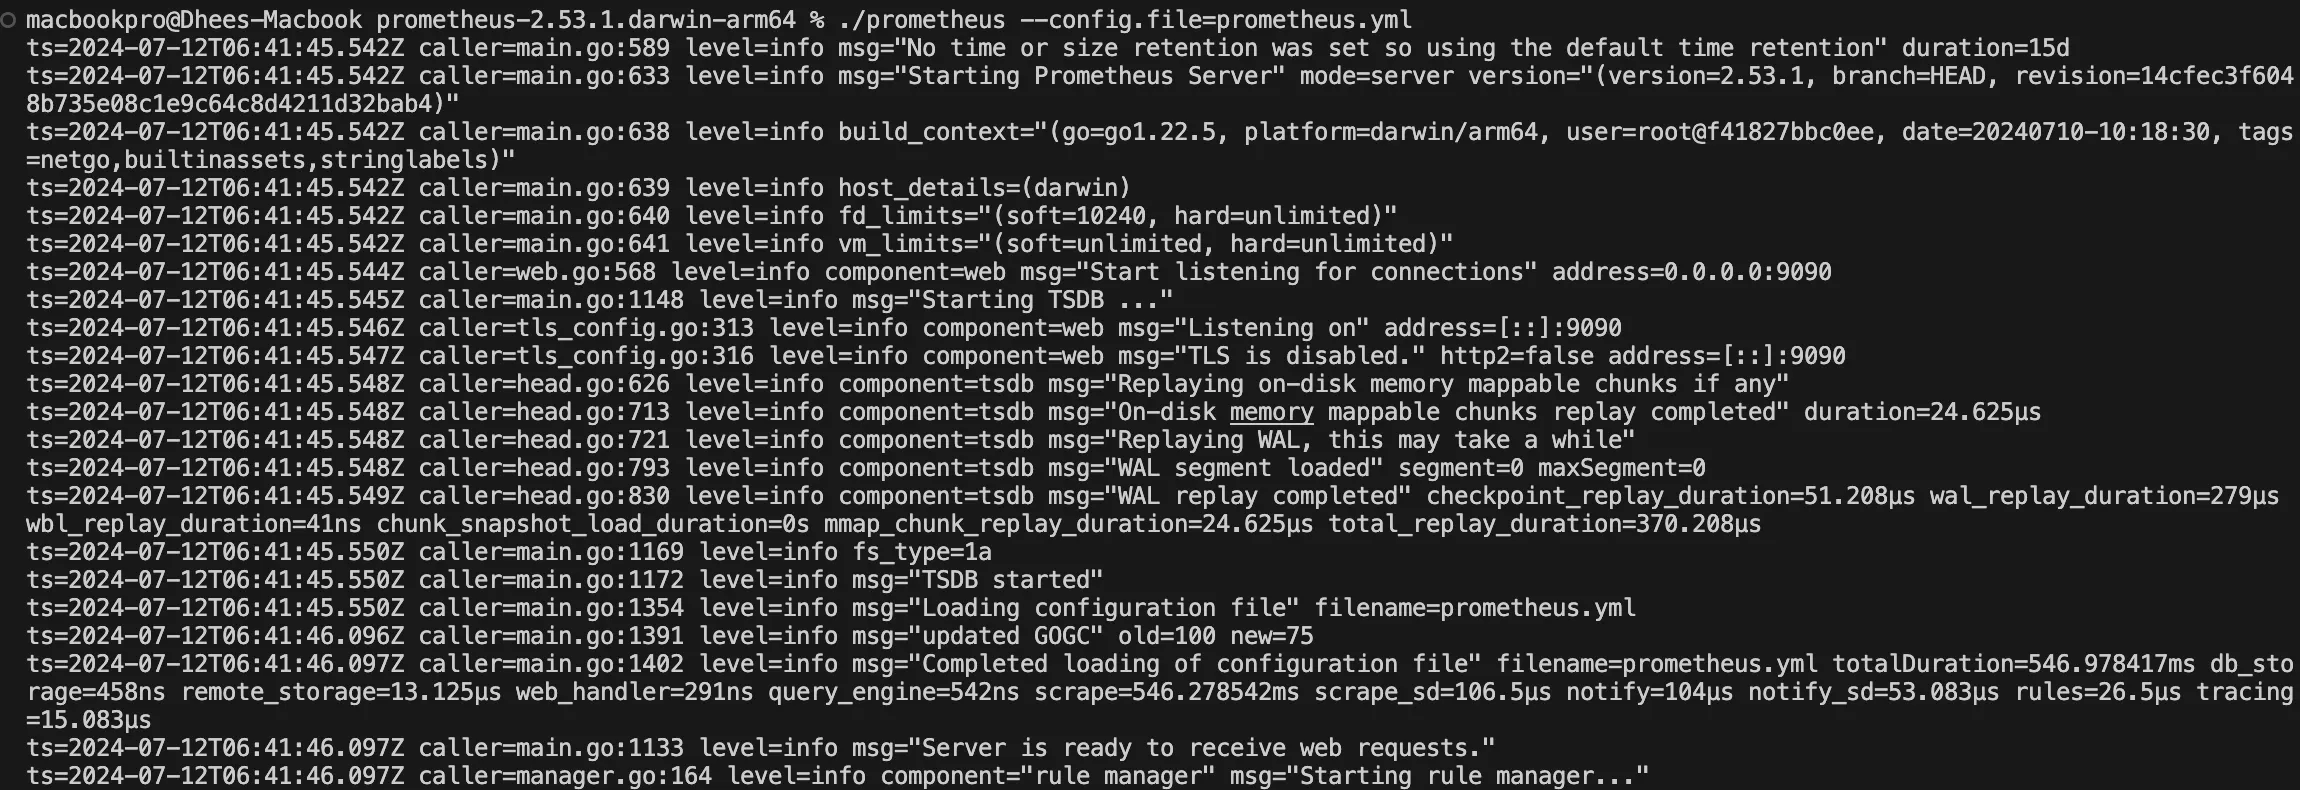
Navigate to the directory where you extracted Prometheus and execute the following command to start Prometheus:
./prometheus --config.file=prometheus.yml
This command will start Prometheus and use the specified configuration file to determine which targets to scrape.
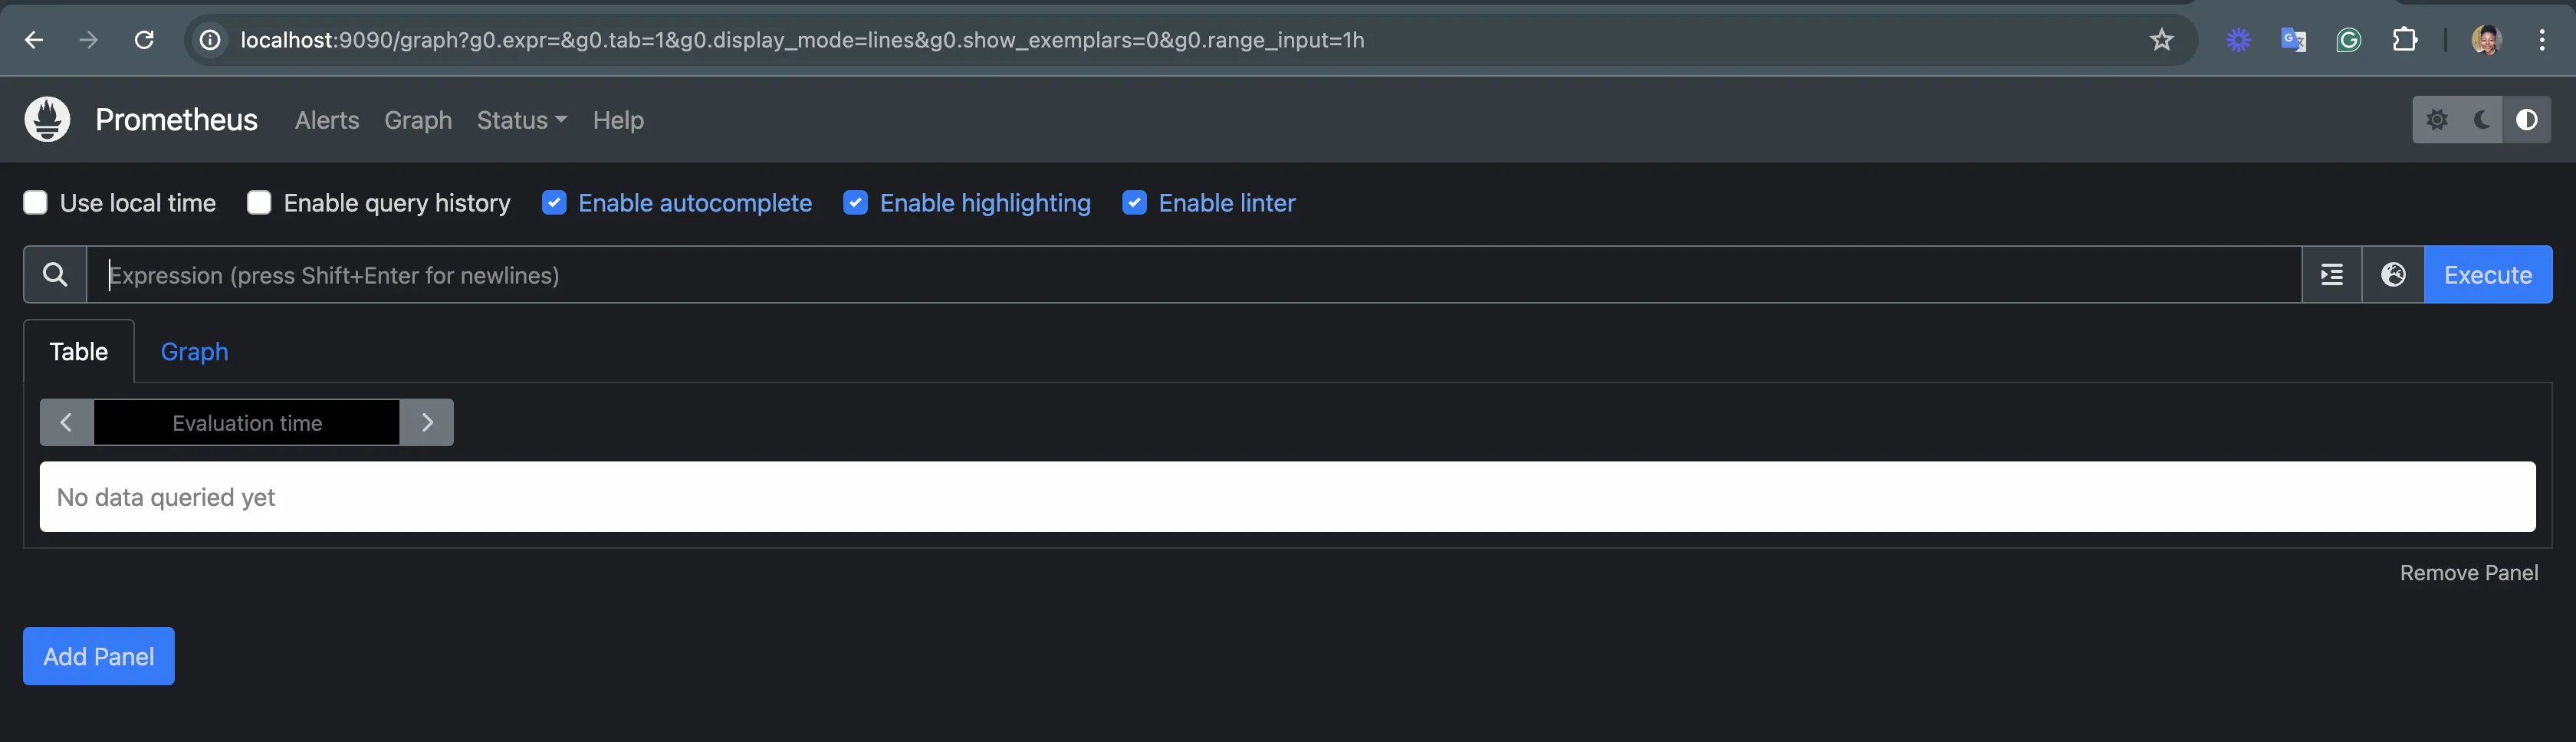
- Access the Prometheus UI
Once Prometheus is started, in your browser, visit localhost:9090 to access the Prometheus UI:
Benefits of Monitoring Systems with Prometheus
Monitoring systems with Prometheus offers several key benefits that are crucial for maintaining the reliability and performance of modern infrastructure. They include:
- Scalability: Prometheus's architecture is designed for horizontal scalability, allowing you to easily add more Prometheus servers to handle increased monitoring load as your infrastructure grows.
- Flexibility: Its dimensional data model and powerful PromQL query language provide a high degree of flexibility in defining and aggregating metrics, enabling you to tailor your monitoring to specific needs.
- Multi-Dimensional Data Model: Prometheus's labels allow you to attach key-value pairs to metrics, enabling rich filtering and aggregation capabilities for in-depth analysis and troubleshooting.
- Pull-Based Model: Prometheus actively pulls metrics from targets, making it easier to monitor environments where targets may be behind firewalls or have limited network access.
- Community and Ecosystem: Prometheus boasts a thriving open-source community and a vast ecosystem of exporters and integrations, making it compatible with a wide range of technologies and services.
- Cloud-Native Integration: Prometheus is well-suited for cloud-native environments and integrates seamlessly with Kubernetes, allowing you to easily monitor containerized applications and microservices.
- Alerting and Visualization: Prometheus seamlessly integrates with Alertmanager for sophisticated alert routing and silencing, reducing alert fatigue. You can also visualize metrics and create informative dashboards using Grafana or other compatible tools.
- Cost-Effective: As an open-source project, Prometheus eliminates licensing costs associated with proprietary monitoring solutions.
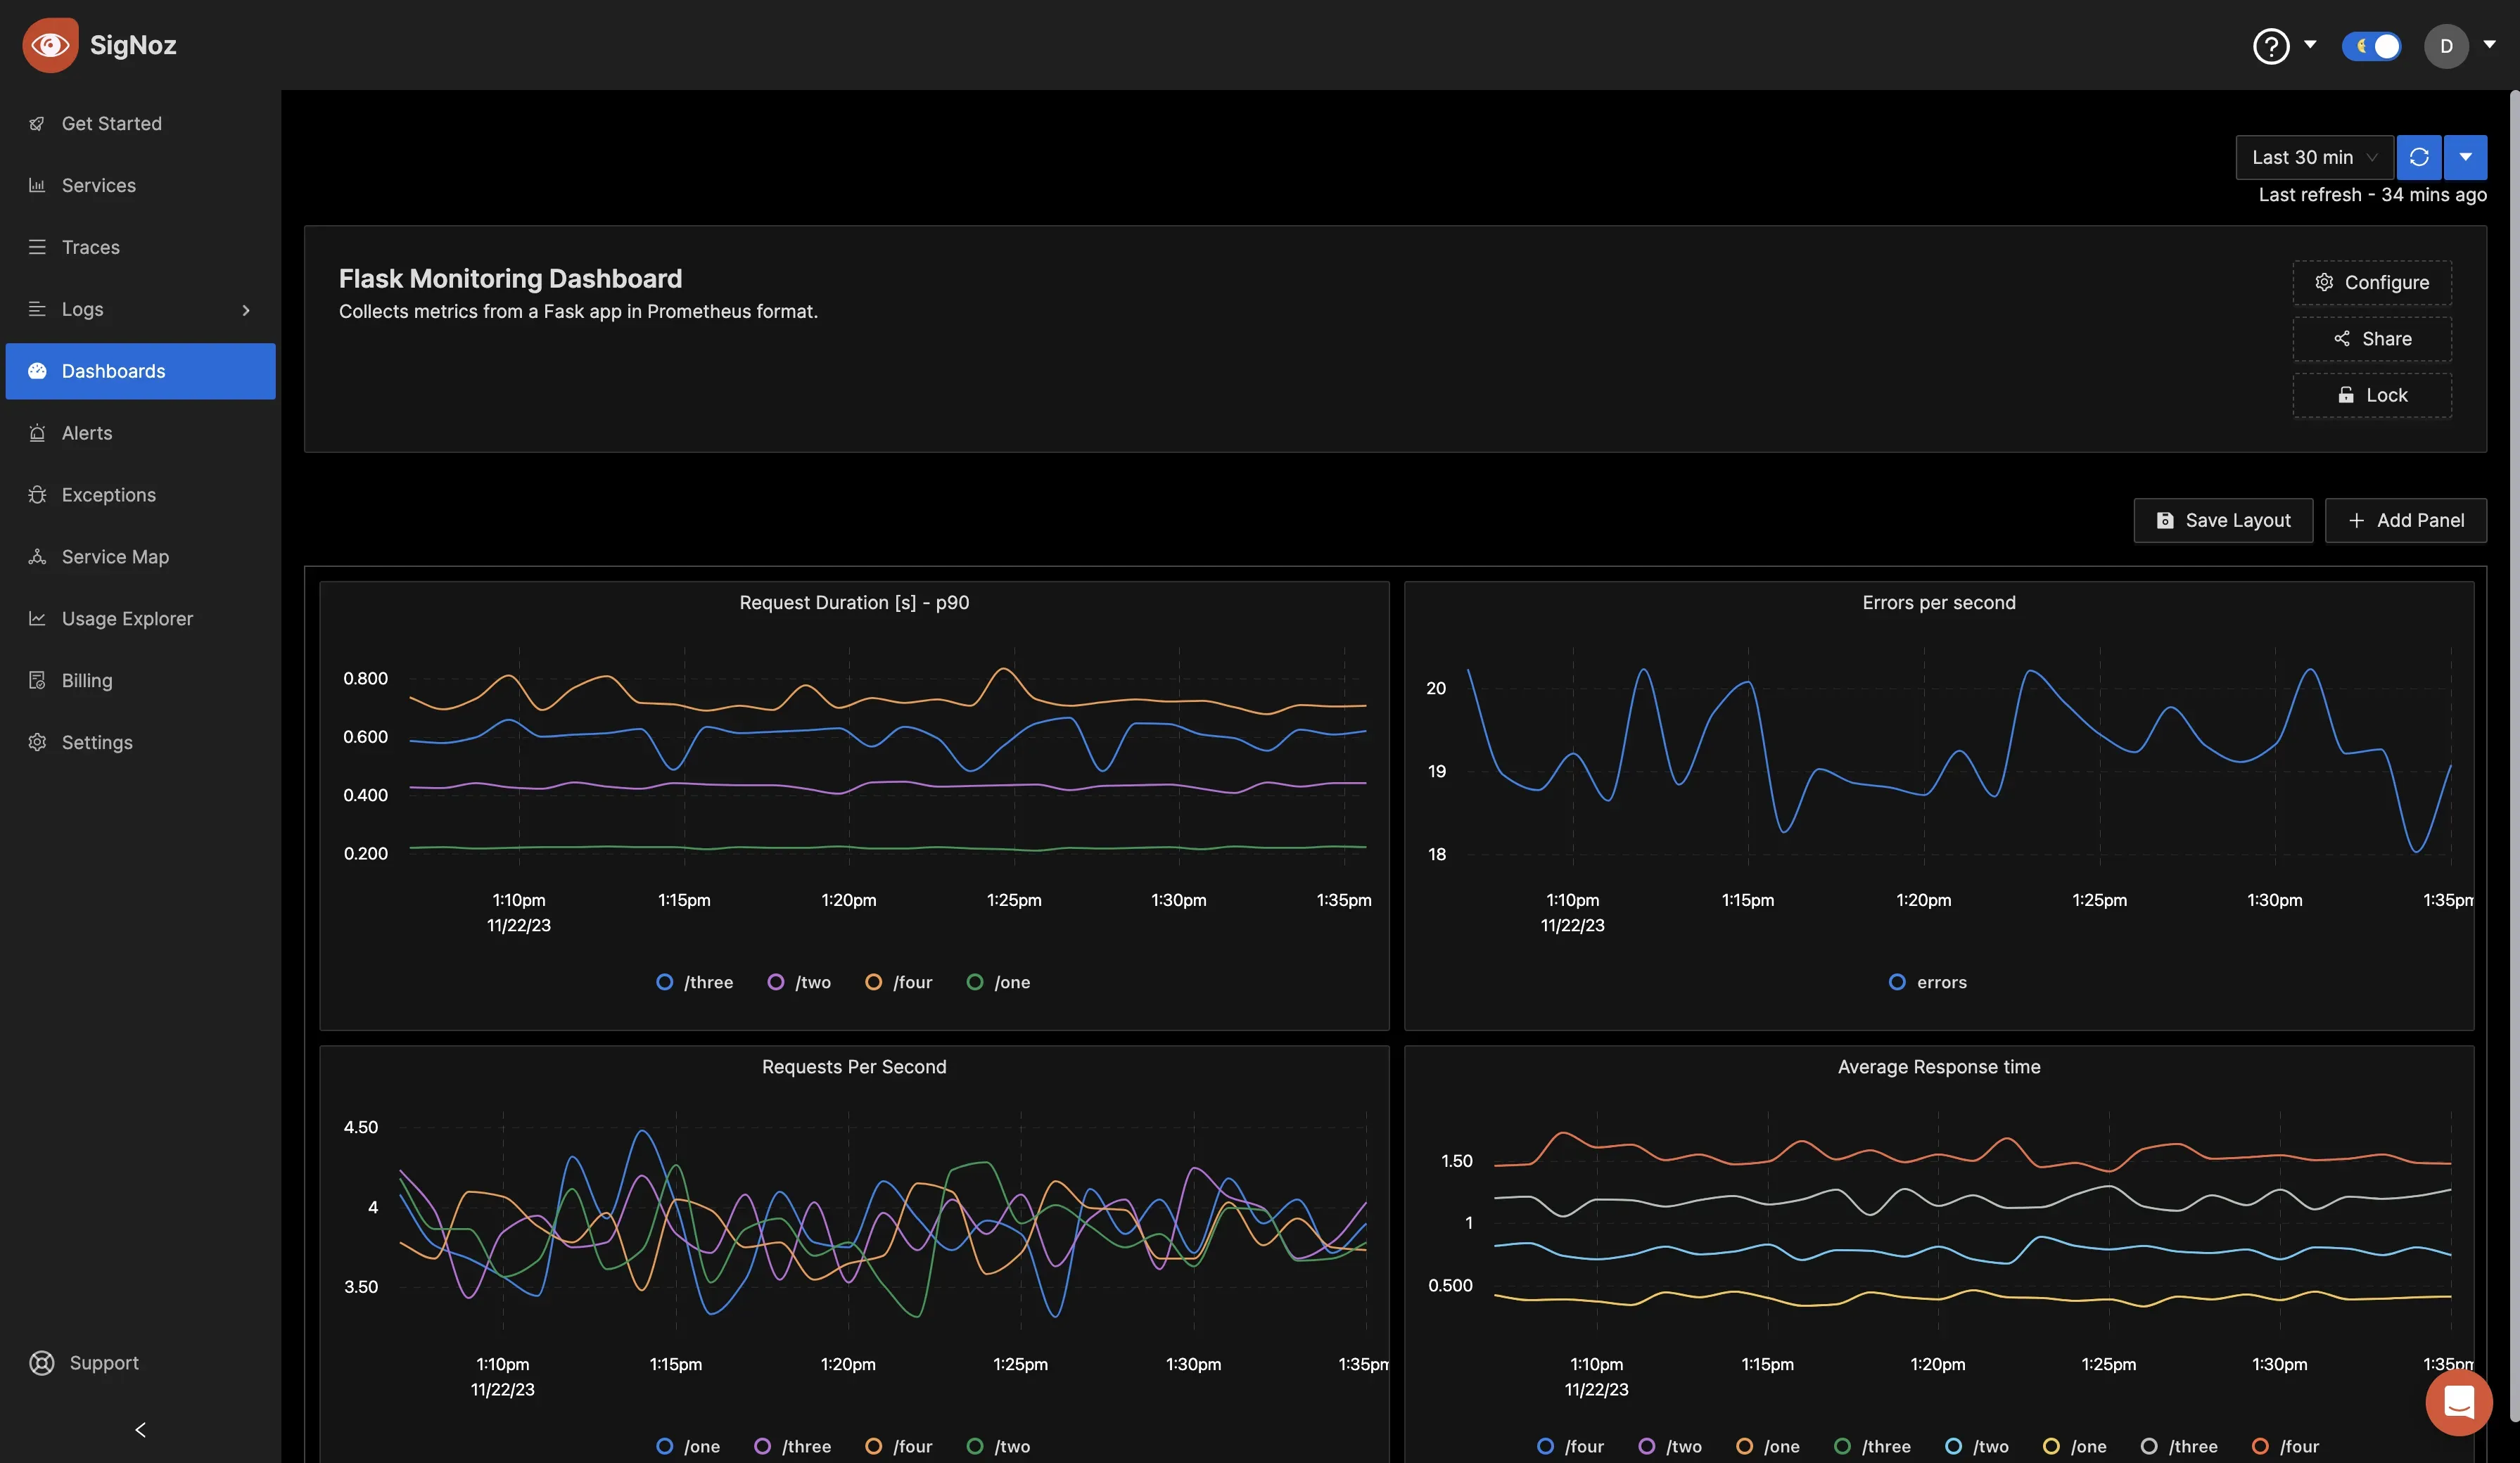
Visualizing Metrics from Prometheus in SigNoz
Prometheus provides a web UI that allows you to query and visualize metrics in a graph, but it is very limited. Also, metrics are just one aspect of monitoring your software systems. You need other types of telemetry (logs and traces) too to set up robust performance monitoring. For better visualization and monitoring of your metrics data, it is best to send the metrics out of Prometheus to a monitoring system. A good option to consider is SigNoz.
SigNoz is a full-stack open-source application performance management (APM) tool. It is built on OpenTelemetry, which allows you to collect data from various data sources, including Prometheus, and frees you from vendor lock-in.
With SigNoz:
- You get out-of-the-box visualization of things like RED metrics and application metrics like p99, p95, and p50 latency.
- It provides a unified UI that integrates metrics, logs, and traces, facilitating seamless correlation between them to pinpoint performance bottlenecks.
- You can visualize your trace data with flamegraphs and Gantt charts to see the flow of requests. This comes in very handy while debugging performance-related issues.
- You can create custom dashboards to monitor important components of your application stack like database, host metrics, and infrastructure.
If you want to collect and visualize metrics from Prometheus in SigNoz, we have created a guide that walks you through the process.
Getting Started with SigNoz
SigNoz Cloud is the easiest way to run SigNoz. Sign up for a free account and get 30 days of unlimited access to all features.

You can also install and self-host SigNoz yourself since it is open-source. With 24,000+ GitHub stars, open-source SigNoz is loved by developers. Find the instructions to self-host SigNoz.
Conclusion
This article highlights the use of Prometheus in monitoring, its components, benefits, and how SigNoz can be used to visualize Prometheus metrics.
Key takeaways:
- Prometheus collects and processes metrics from its targets via an HTTP endpoint.
- The Prometheus server is responsible for scraping and storing time series data.
- Prometheus provides several benefits for monitoring which include its open-source nature eliminating licensing costs, an active community, scalability, and more.
- Metrics can be collected from Prometheus and sent to a monitoring tool like SigNoz for visualization.
