Autoinstrumentation for Traces - OpenTelemetry NodeJS
This article is part of the OpenTelemetry NodeJS series:
- Previous Article: Understanding and Cloning the Sample Application - OpenTelemetry NodeJS
- You are here: Autoinstrumentation for Traces - OpenTelemetry NodeJS
- Next Article: Exploring Metrics Created via Traces in SigNoz - OpenTelemetry NodeJS
Check out the complete series at: Overview - Implementing OpenTelemetry in NodeJS with SigNoz - OpenTelemetry NodeJS
Autoinstrumentation simplifies the integration of telemetry within applications by automatically capturing detailed traces of operations. In the context of Node.js microservices, it enables developers to track the flow of requests across services without modifying application code. This capability is crucial for diagnosing issues and optimizing performance in complex distributed systems.
Prerequisites
Before we begin, ensure you have the following:
- Docker and Docker Compose installed on your system.
- Node.js installed.
- Basic understanding of microservices architecture.
What are Traces and Why are They Helpful?
Traces provide a way to monitor the journey of a request through various services. Each trace consists of one or more spans, which represent individual operations or function calls that occur in response to the request. Tracing helps identify where delays or problems occur within these operations, providing insights into the system's behavior and performance.
Installing OpenTelemetry Libraries
To implement autoinstrumentation in our Node.js microservices, install the following libraries in each of the service folders:
npm install --save @opentelemetry/api
npm install --save @opentelemetry/auto-instrumentations-node
These packages provide the OpenTelemetry API and the necessary instrumentation for Node.js applications
Setup SigNoz
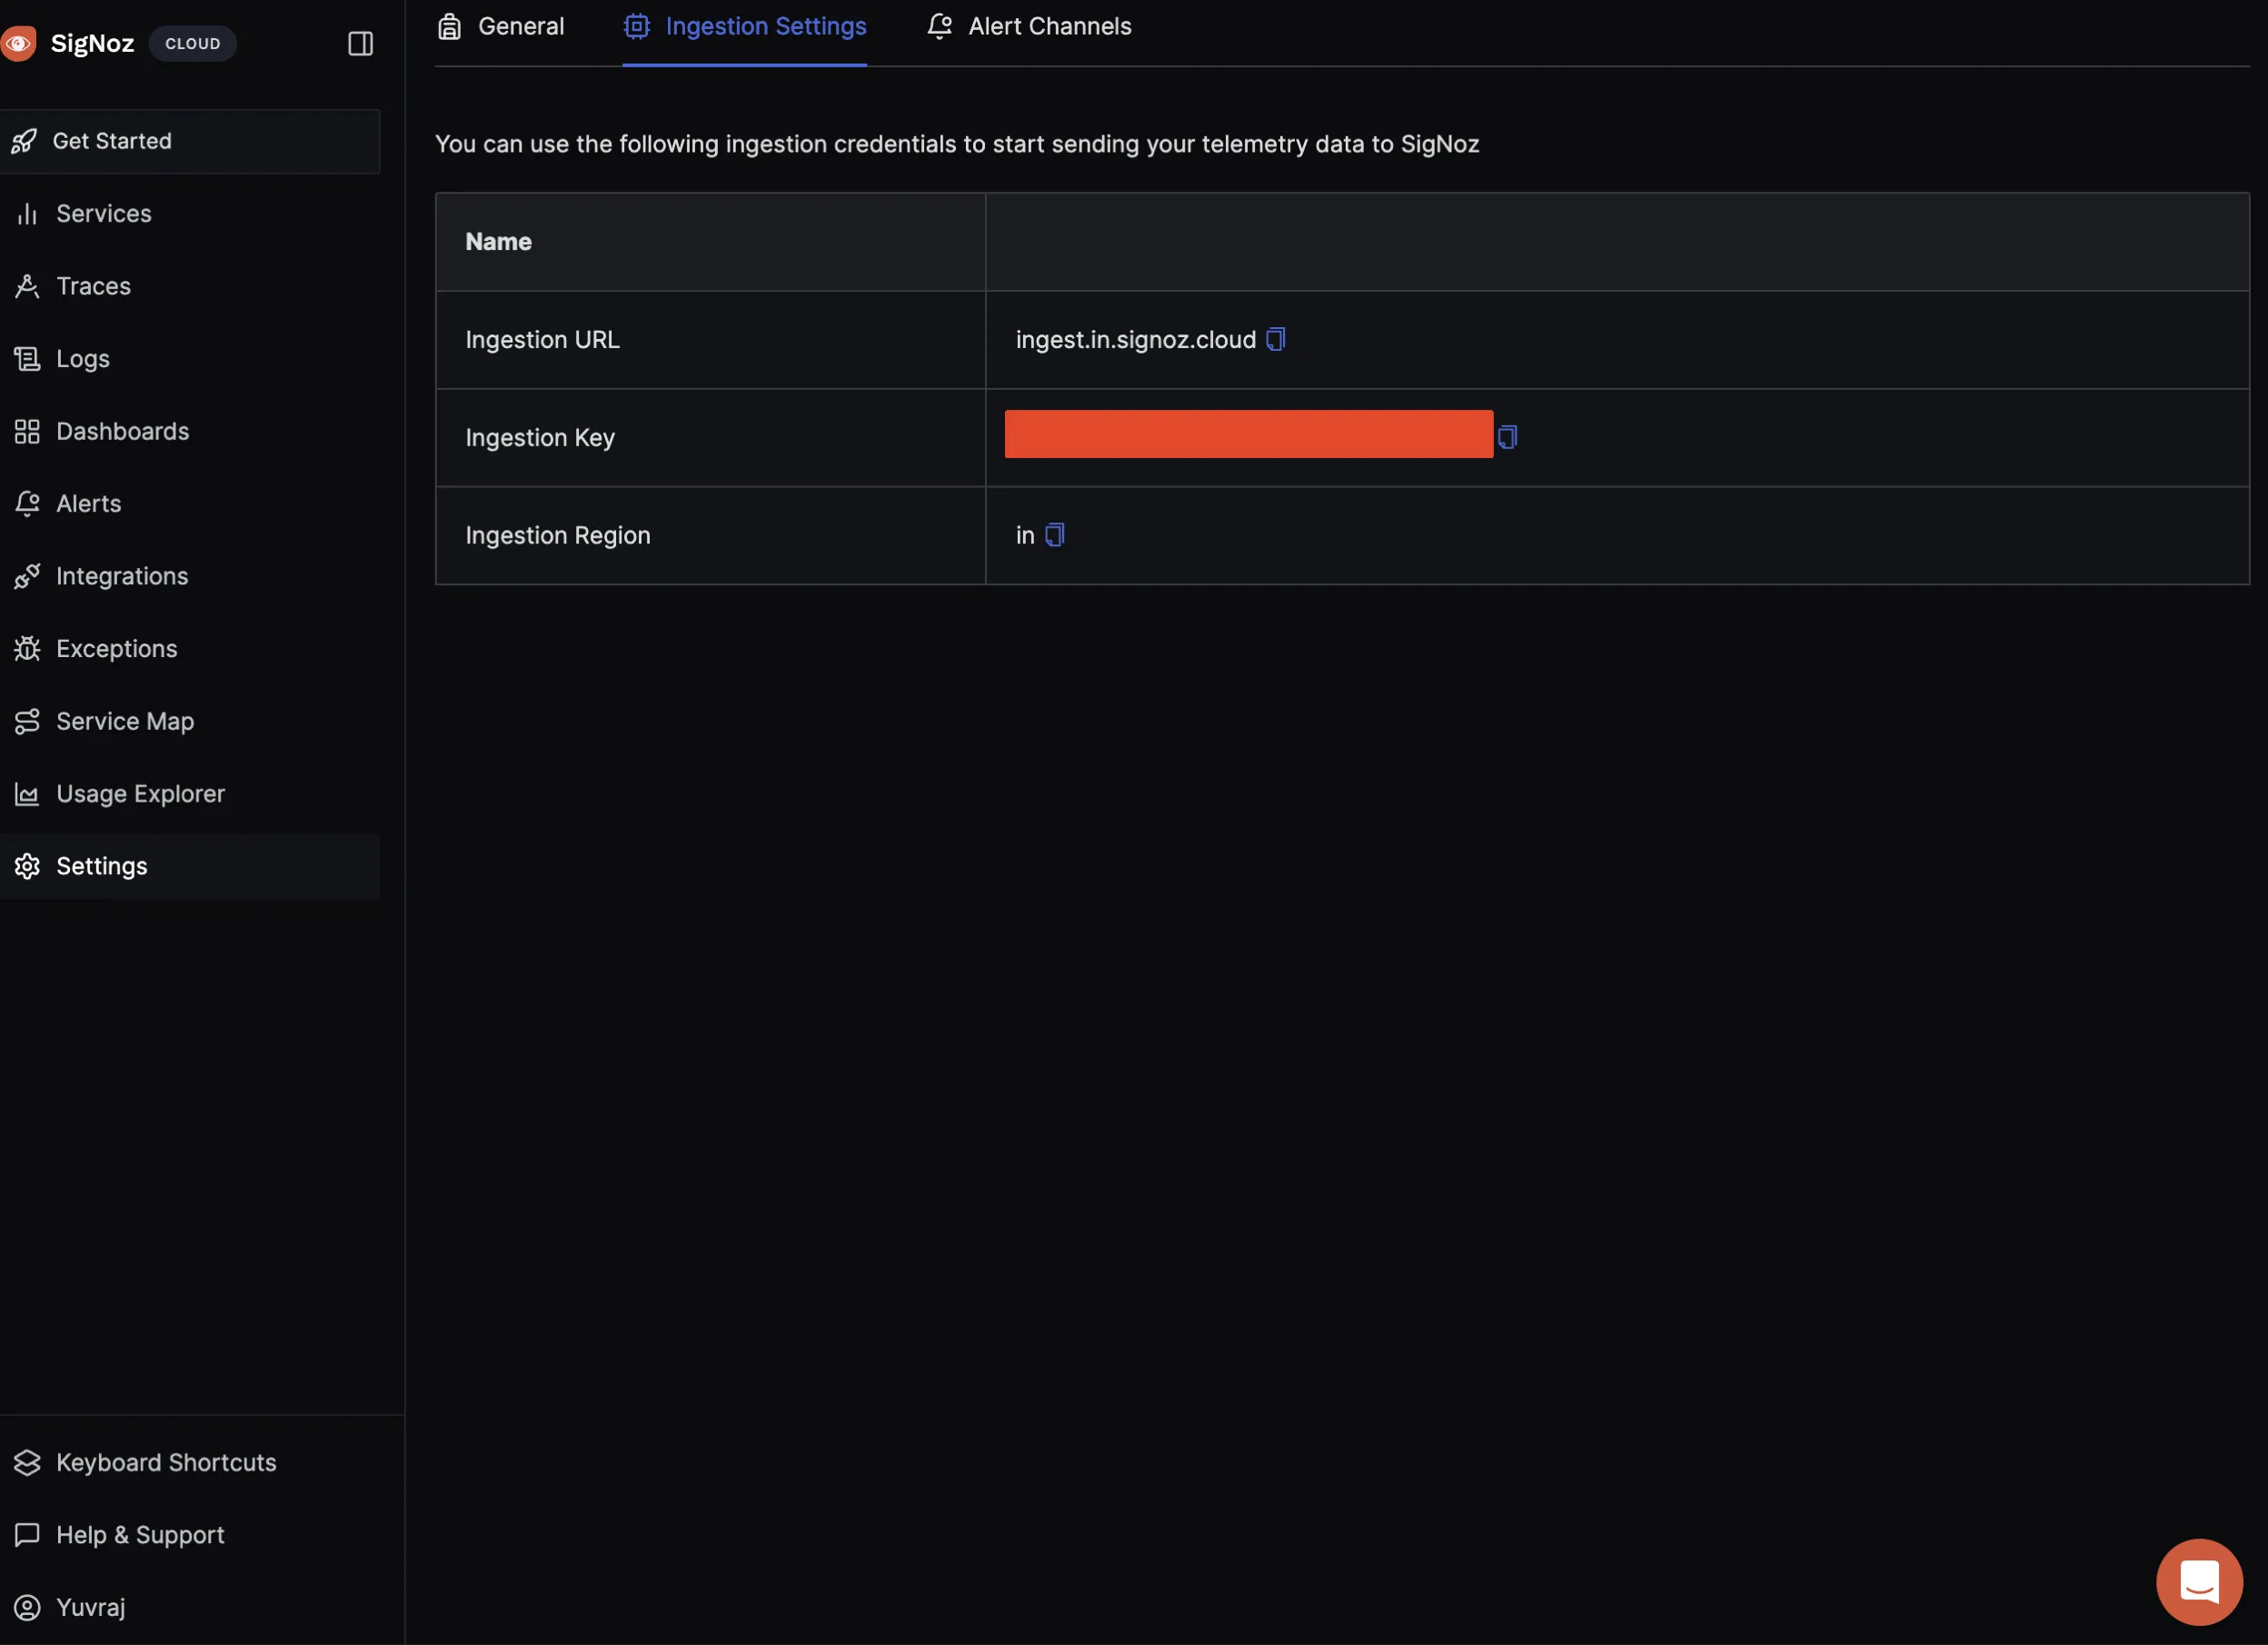
If you haven’t already, sign up for a SigNoz cloud account and set up your project. Obtain the endpoint and ingestion key from your SigNoz dashboard, which will be used to send telemetry data.
Configuring OpenTelemetry for Automatic Tracing
Setting Environment Variables Securely
Store sensitive configuration details in a .env file, which should be added to .gitignore to prevent it from being included in version control:
# .env file
OTEL_EXPORTER_OTLP_ENDPOINT="https://<your-sigNoz-endpoint>"
OTEL_EXPORTER_OTLP_HEADERS="signoz-ingestion-key=<your-ingestion-key>"
Modifying docker-compose.yml
Integrate the .env variables into your docker-compose.yml to securely configure each microservice:
version: '3.8'
services:
	mongodb:
    image: mongo:latest
    ports:
      - "27017:27017"
    volumes:
      - mongo-data:/data/db
    networks:
      - myapp-network
  order:
    build: ./order-service
    ports:
      - "3001:3001"
    environment:
      - OTEL_TRACES_EXPORTER=otlp
      - OTEL_EXPORTER_OTLP_ENDPOINT=${OTEL_EXPORTER_OTLP_ENDPOINT}
      - OTEL_NODE_RESOURCE_DETECTORS=env,host,os
      - OTEL_SERVICE_NAME=order-service
      - NODE_OPTIONS=--require @opentelemetry/auto-instrumentations-node/register
      - OTEL_EXPORTER_OTLP_HEADERS=${OTEL_EXPORTER_OTLP_HEADERS}
    depends_on:
      - mongodb
    networks:
      - myapp-network
  # Configure other services similarly

networks:
  myapp-network:

volumes:
  mongo-data:
This setup directs each service to use OpenTelemetry for tracing, specifying endpoints, headers, and service names dynamically.
Running the Services with Autoinstrumentation
To start your microservices with tracing enabled, run:
docker-compose up --build
This command initiates the services, applying the autoinstrumentation settings defined in your Docker and environment configurations.
Visualizing Traces with SigNoz
After the services are running, you can view traces in the SigNoz dashboard after hitting a few endpoints.
Access SigNoz to see the traces generated by your services, which illustrate the request flows and highlight any performance bottlenecks.
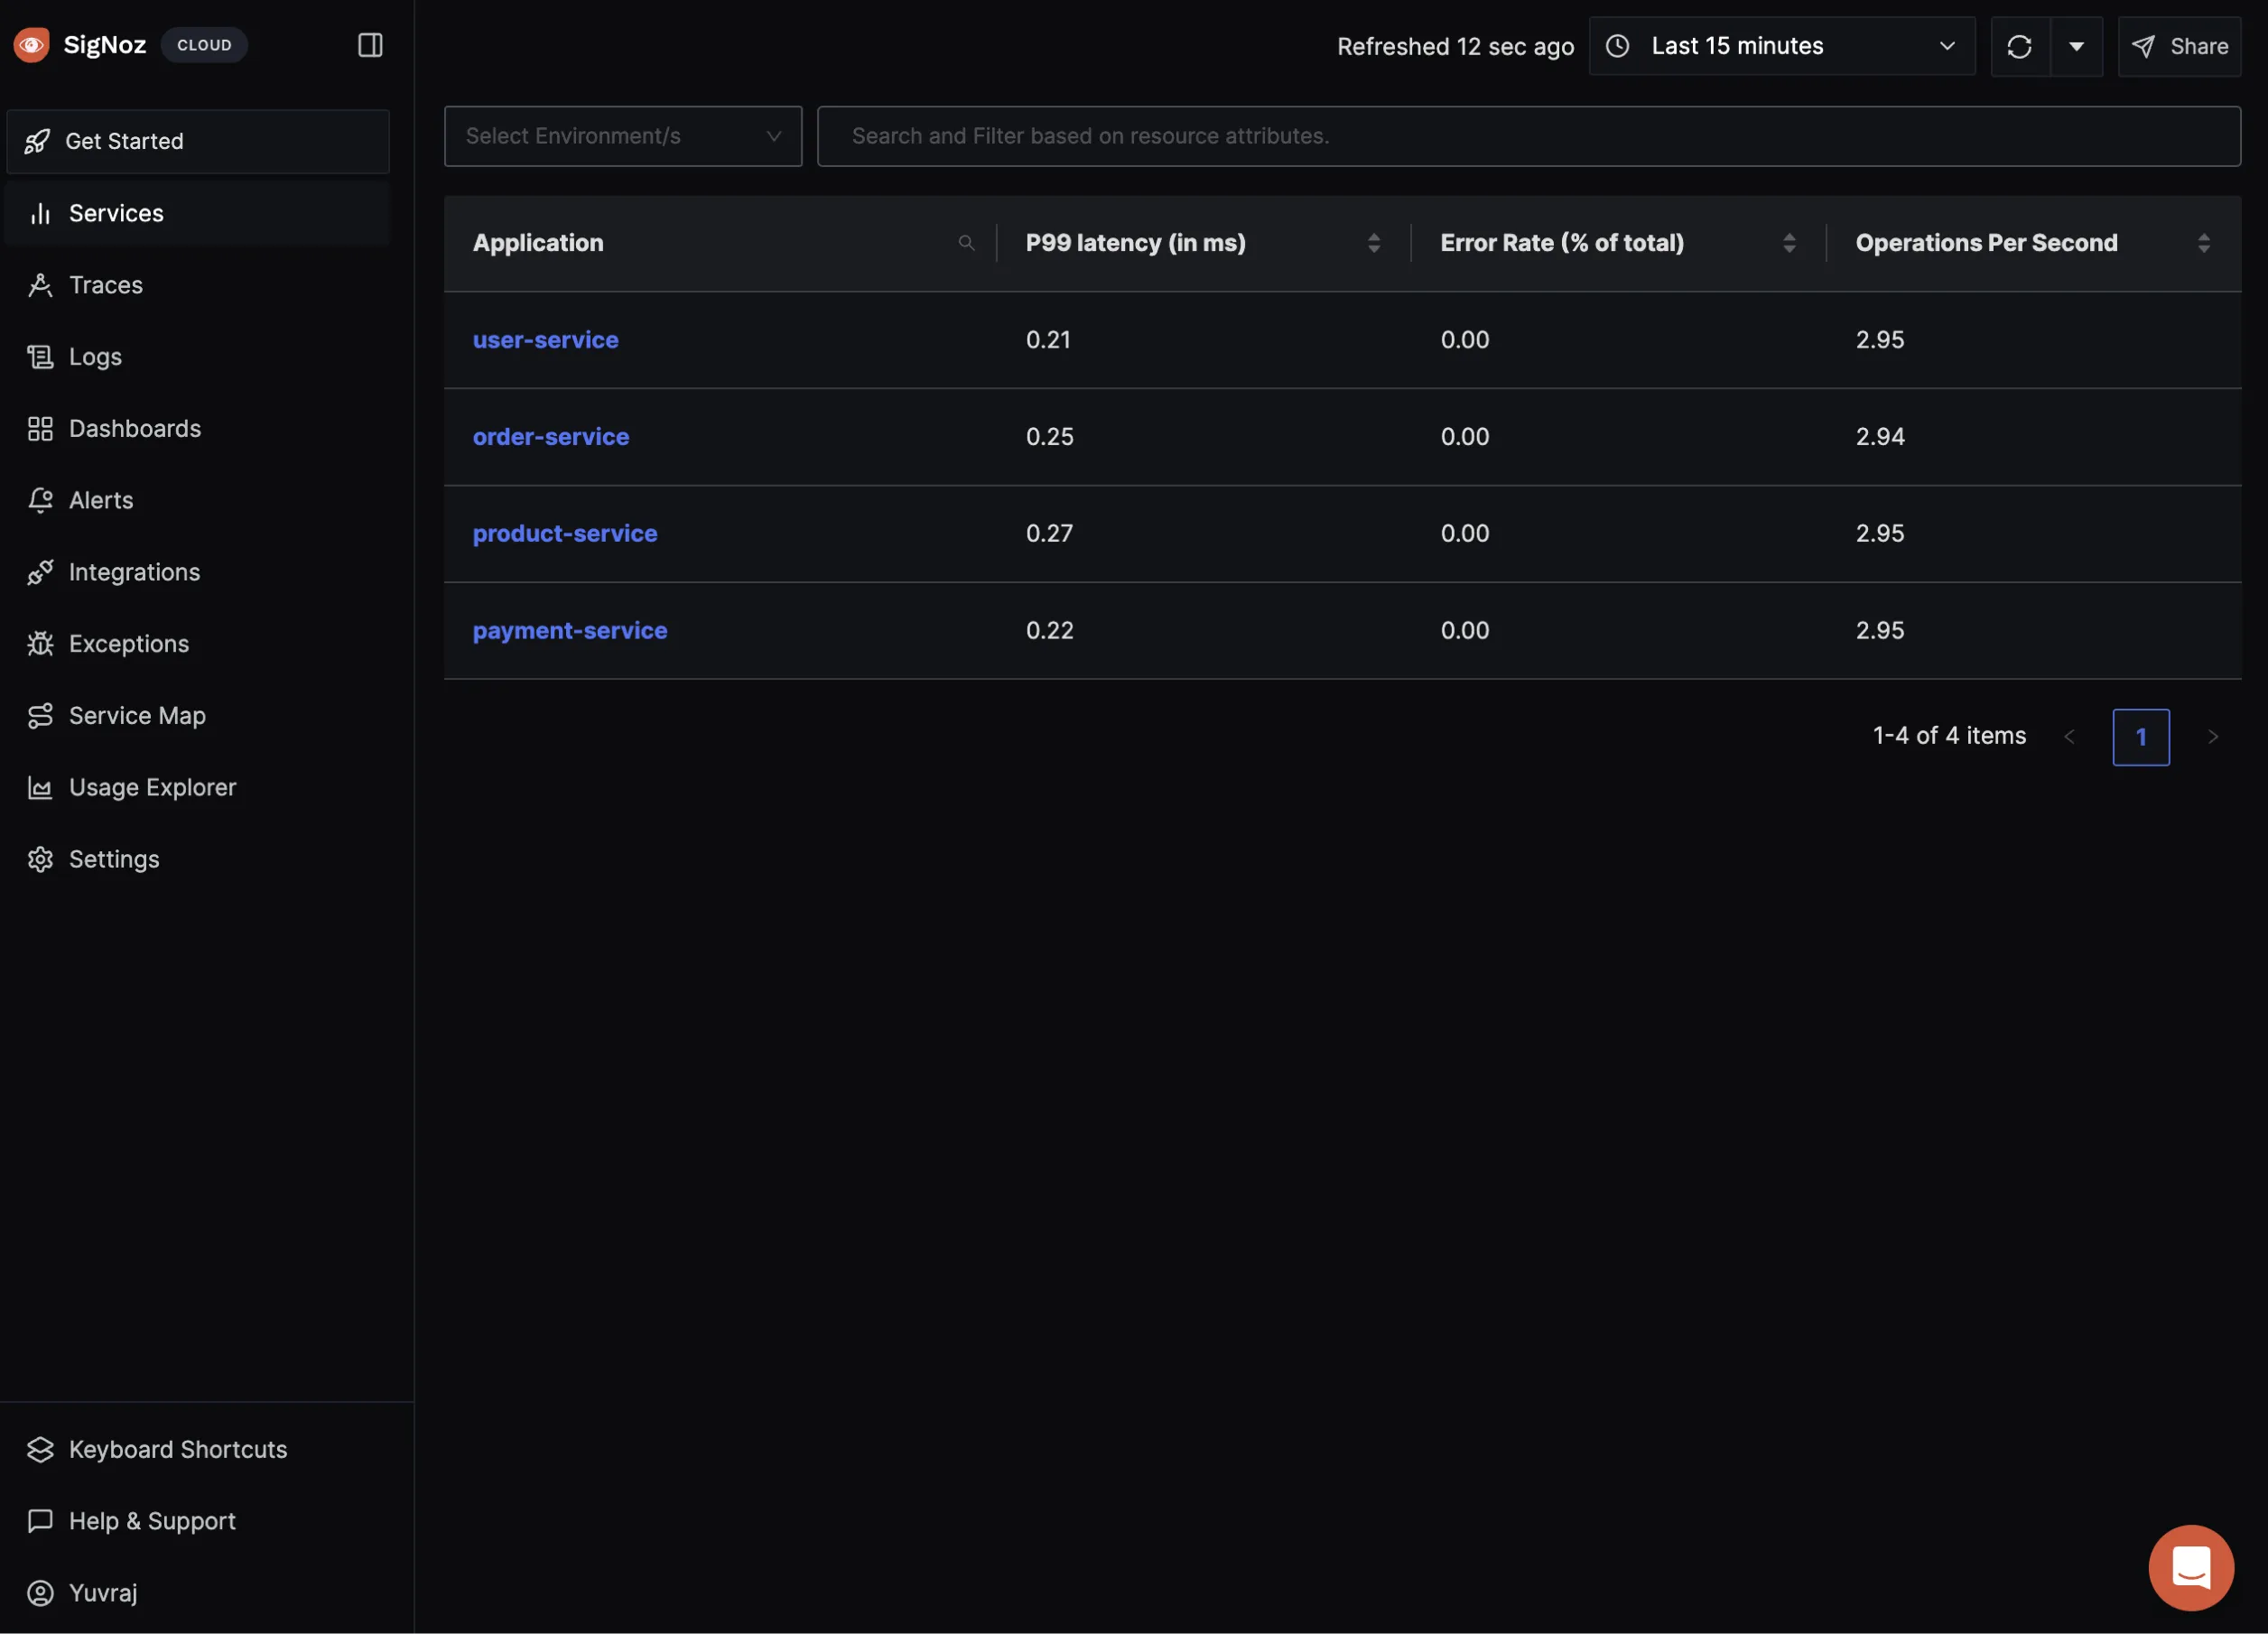
Steps to Visualize Traces in SigNoz:
- Login to SigNoz: Go to your SigNoz instance and log in with your credentials.
- Navigate to Traces Section: Click on the "Traces" tab in the SigNoz dashboard.
- Filter and Analyze: Use filters to find traces related to specific services or requests. Analyze the traces to understand the flow of requests and identify any bottlenecks or issues.
Common Issues and Troubleshooting
- Missing Traces: Ensure all environment variables are correctly set and that the SigNoz endpoint is reachable from your services.
- Ensure
https://prefix is added to the signoz endpoint.
- Ensure
- Environment Variable Errors: Double-check
.envfile entries and ensure they are correctly referenced in yourdocker-compose.yml.
Conclusion
Automatically capturing traces in Node.js microservices using OpenTelemetry significantly enhances observability, making it easier to monitor, debug, and optimize applications. By following the steps outlined, you've enabled powerful tracing capabilities in your application, ready for deeper analysis with tools like SigNoz.
- Simplified Setup: Using environment variables and Docker Compose, we configured autoinstrumentation without modifying the application source code.
- Tracing Implementation: We captured detailed traces of operations within each microservice, providing insights into the flow of requests and identifying performance bottlenecks.
- Secure Configuration: By storing sensitive configuration details in a
.envfile, we ensured that important data like endpoints and tokens remain secure. - Visualizing Traces: Leveraging SigNoz, we visualized the captured traces, allowing for easy monitoring and debugging of the microservices.
Next Step: Let’s see how SigNoz derives some important metrics out of the traces that we sent.
Read Next Article of OpenTelemetry NodeJS series on Exploring Metrics Created via Traces in SigNoz - OpenTelemetry NodeJS
