Correlating Traces, Logs, and Metrics in OpenTelemetry Node.js
One of the main advantage of using SigNoz is the ability to correlate Metrics, Logs, and Traces. This article explores how to enhance the observability of a Node.js application by integrating structured logging with trace data using Pino and OpenTelemetry, and visualizing this correlated data in SigNoz.
Prerequisites
To follow along, you'll need:
- Basic knowledge of Node.js and Docker.
- An understanding of microservices and observability principles.
- A setup with SigNoz and OpenTelemetry configured as described in previous tutorials.
Benefits of Correlation
Correlating traces and logs enhances debugging capabilities by providing a unified view of distributed transactions. It simplifies the identification of issues and improves the monitoring of microservices by offering a holistic view of application performance and behavior.
Correlation is what separates three siloed signals from true observability, letting you jump from a metric spike to the exact trace and log line.
Configuring the Logger for Correlation
To correlate logs with traces, we've enhanced the Pino logger configuration to include trace information in each log entry. This allows each log message to carry its trace ID and span ID, aligning log entries with their corresponding trace segments.
Logger Configuration:
// logger.js
import pino from "pino";
import { trace } from "@opentelemetry/api";

const logger = pino({
  transport: {
    targets: [
      {
        target: "pino-opentelemetry-transport",
        options: {
          resourceAttributes: {
            "service.name": "order-service",
          },
        },
      },
      {
        target: "pino-pretty",
        level: "info",
        options: { colorize: true },
      },
    ],
  },
  formatters: {
    log: (log) => {
      const currentSpan = trace.getActiveSpan();
      if (currentSpan) {
        const { traceId, spanId, traceFlags } = currentSpan.spanContext();

        log.traceId = traceId;
        log.spanId = spanId;
        log.traceFlags = traceFlags;

        console.log("Hereeee in the object", traceId, " + ", spanId);
      }
      return log;
    },
  },
});

export default logger;
This configuration enhances each log entry with trace context, making it easier to follow a transaction across the system’s logs and traces.
Creating a Logs Pipeline in SigNoz
SigNoz provides the logs pipeline feature to extract the trace information from the logs attributes and add to the log data in the OpenTelemetry defined format.
This is crucial to interact from one type of Telemetry data to another.
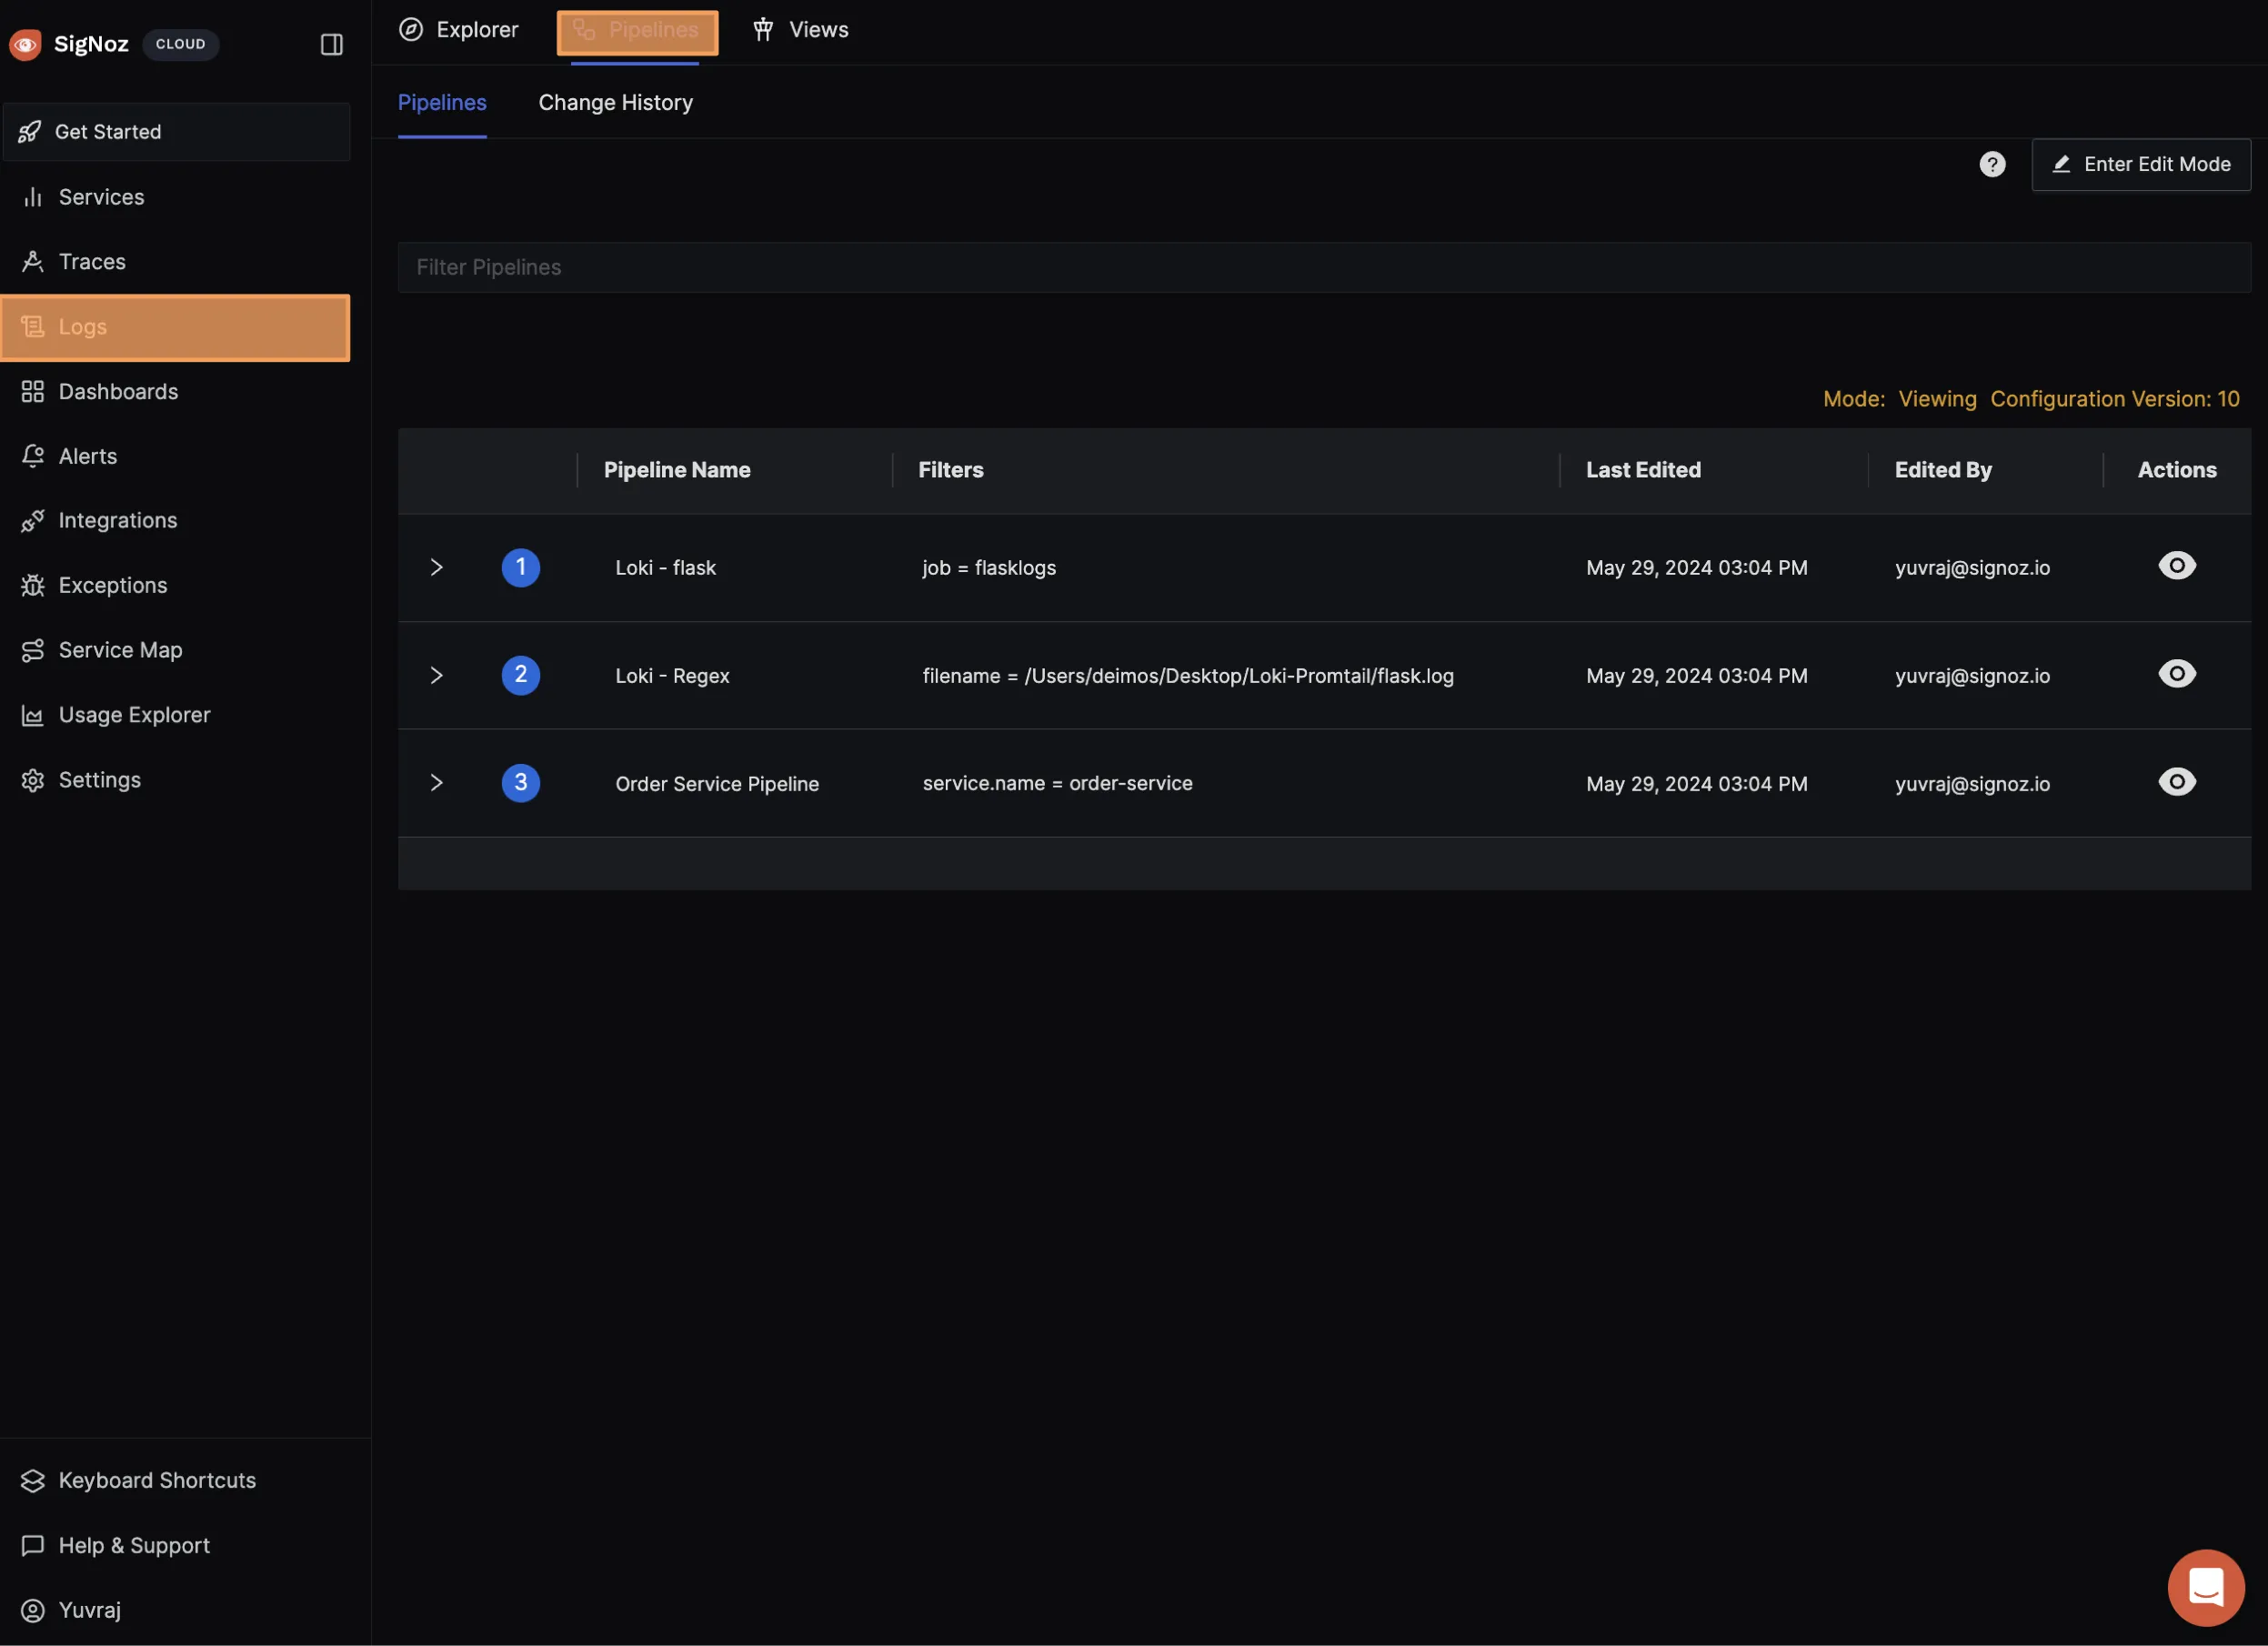
Step 1: Go to the logs pipeline
Open the logs pipeline dashboard inside the logs panel.
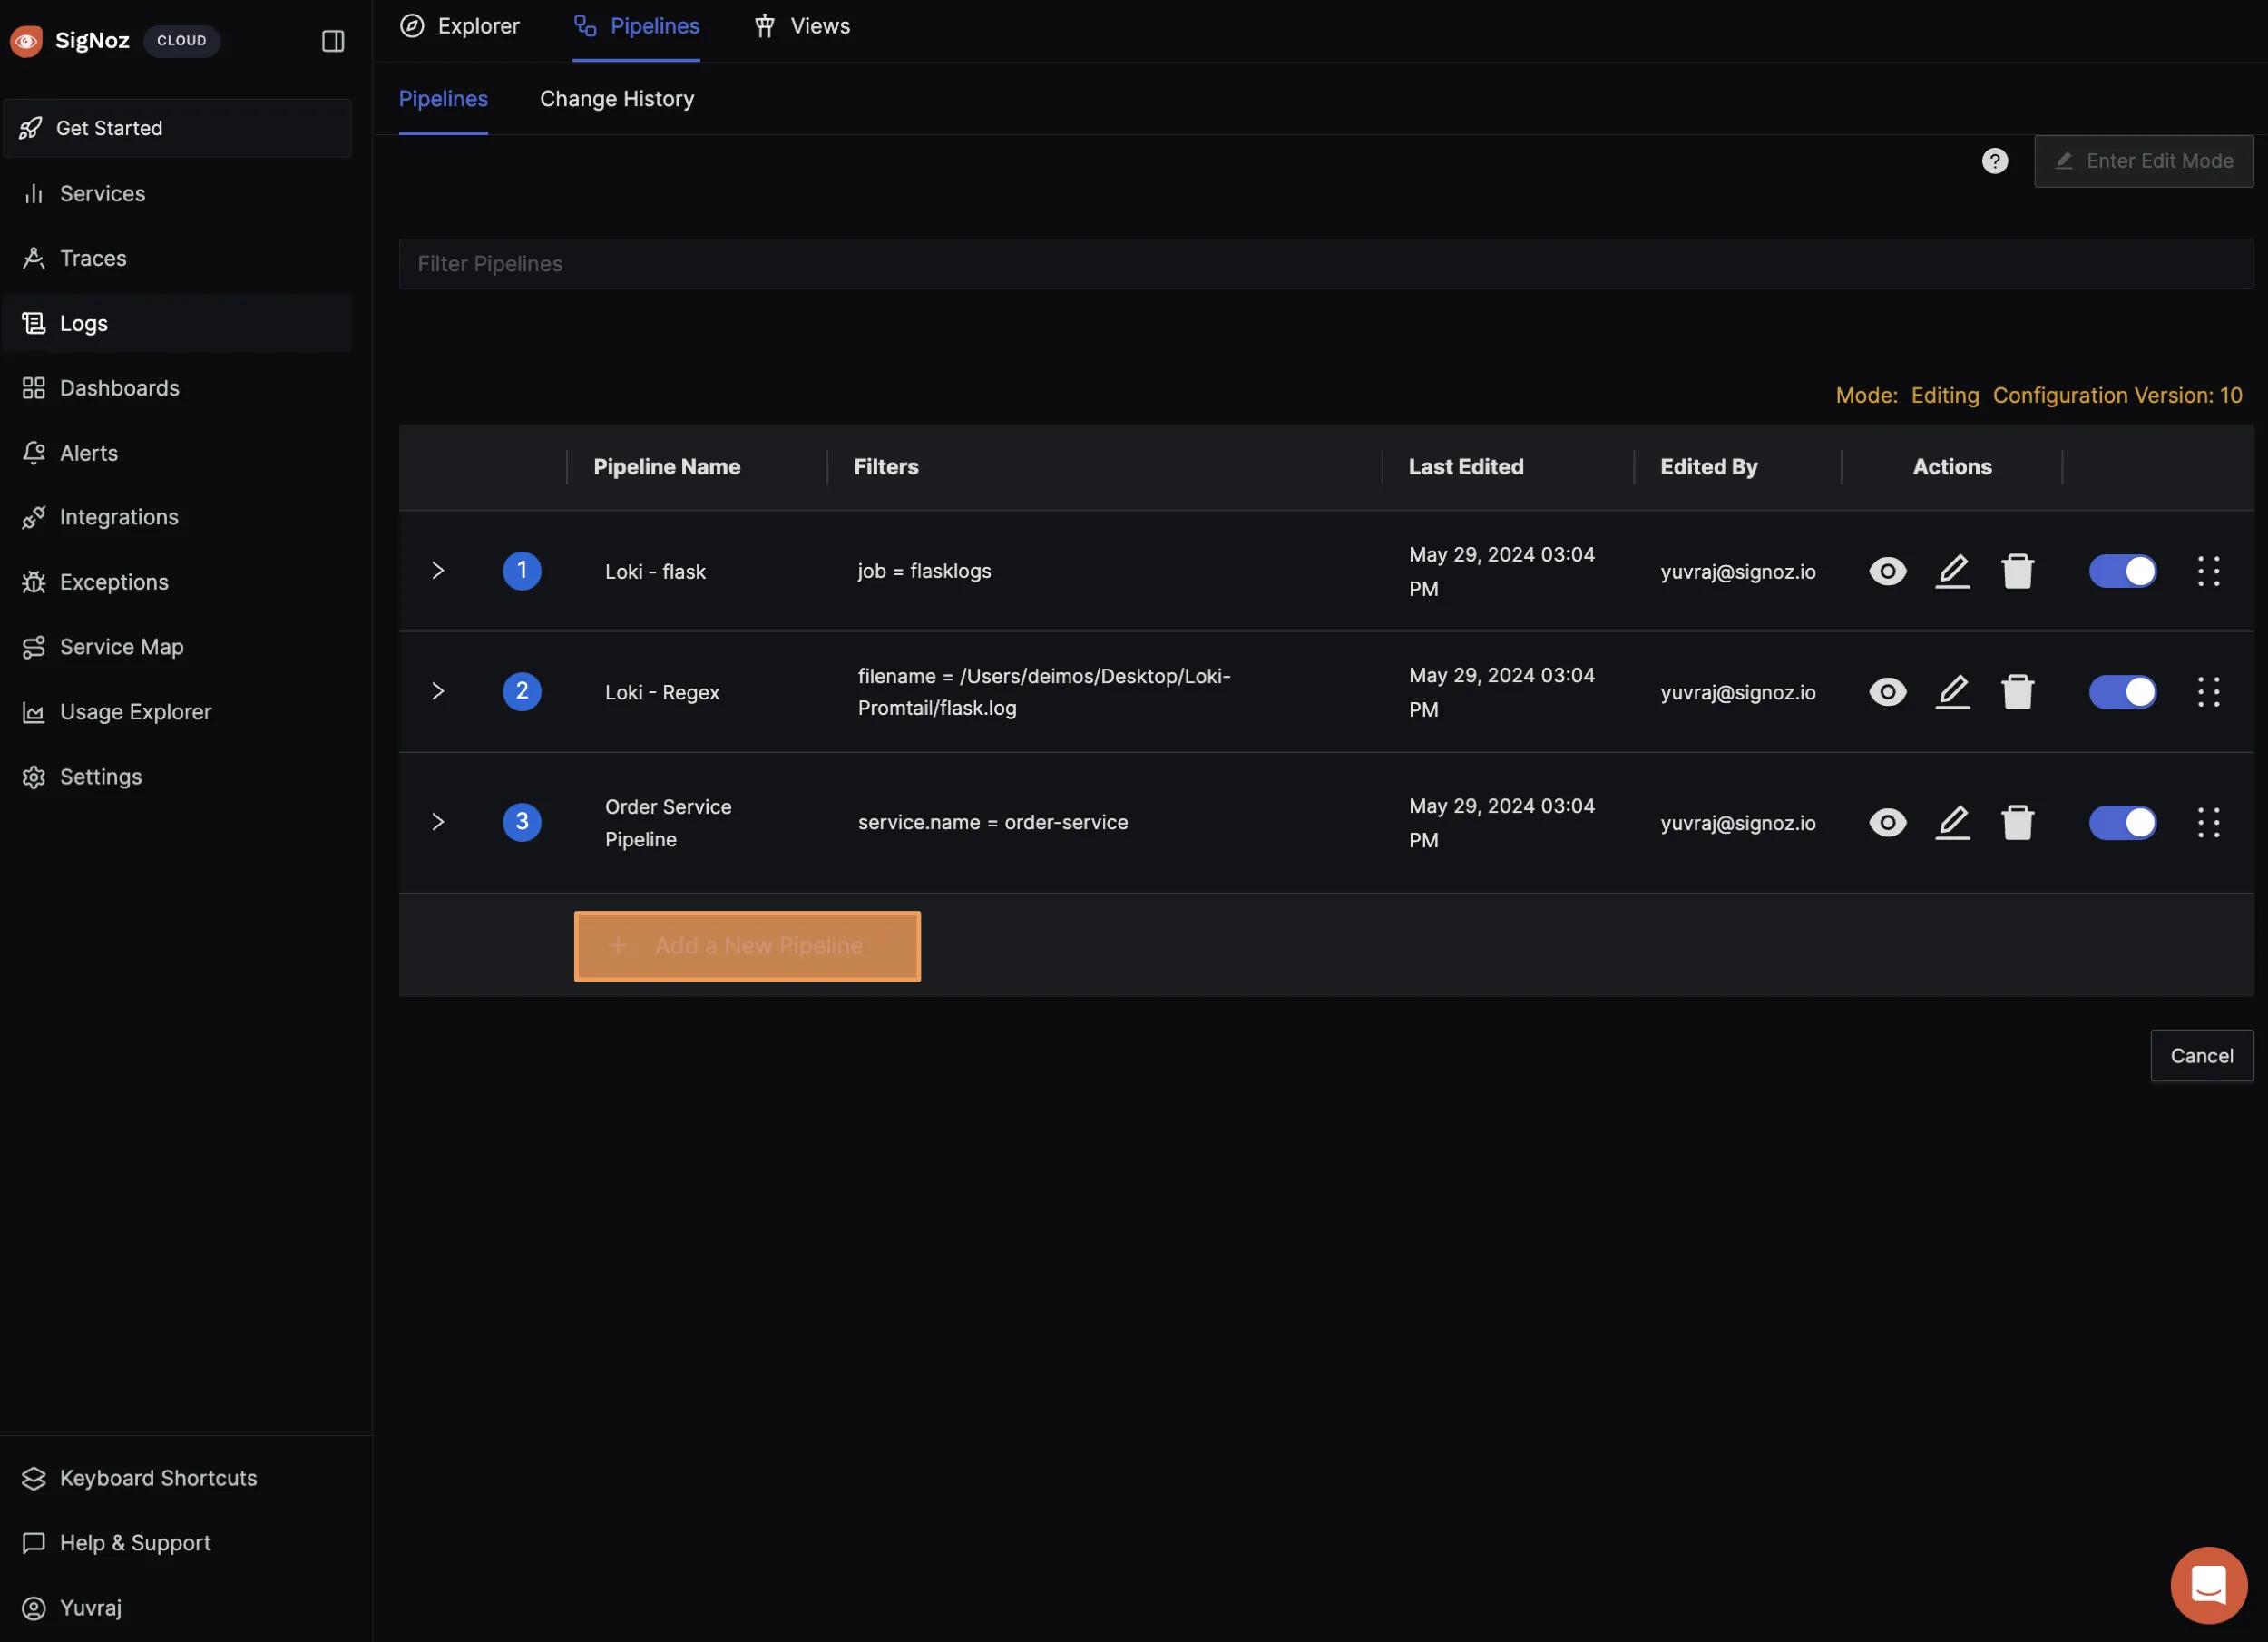
Step 2: Create a new pipeline
If you are creating a pipeline for the first time, click on add a new pipeline or else click on enter edit mode and then select add a new pipeline.
Step 3: Complete the pipeline setup
Add the required information like name and description and select the order service by applying the right filter. Add the pipeline by clicking on update.
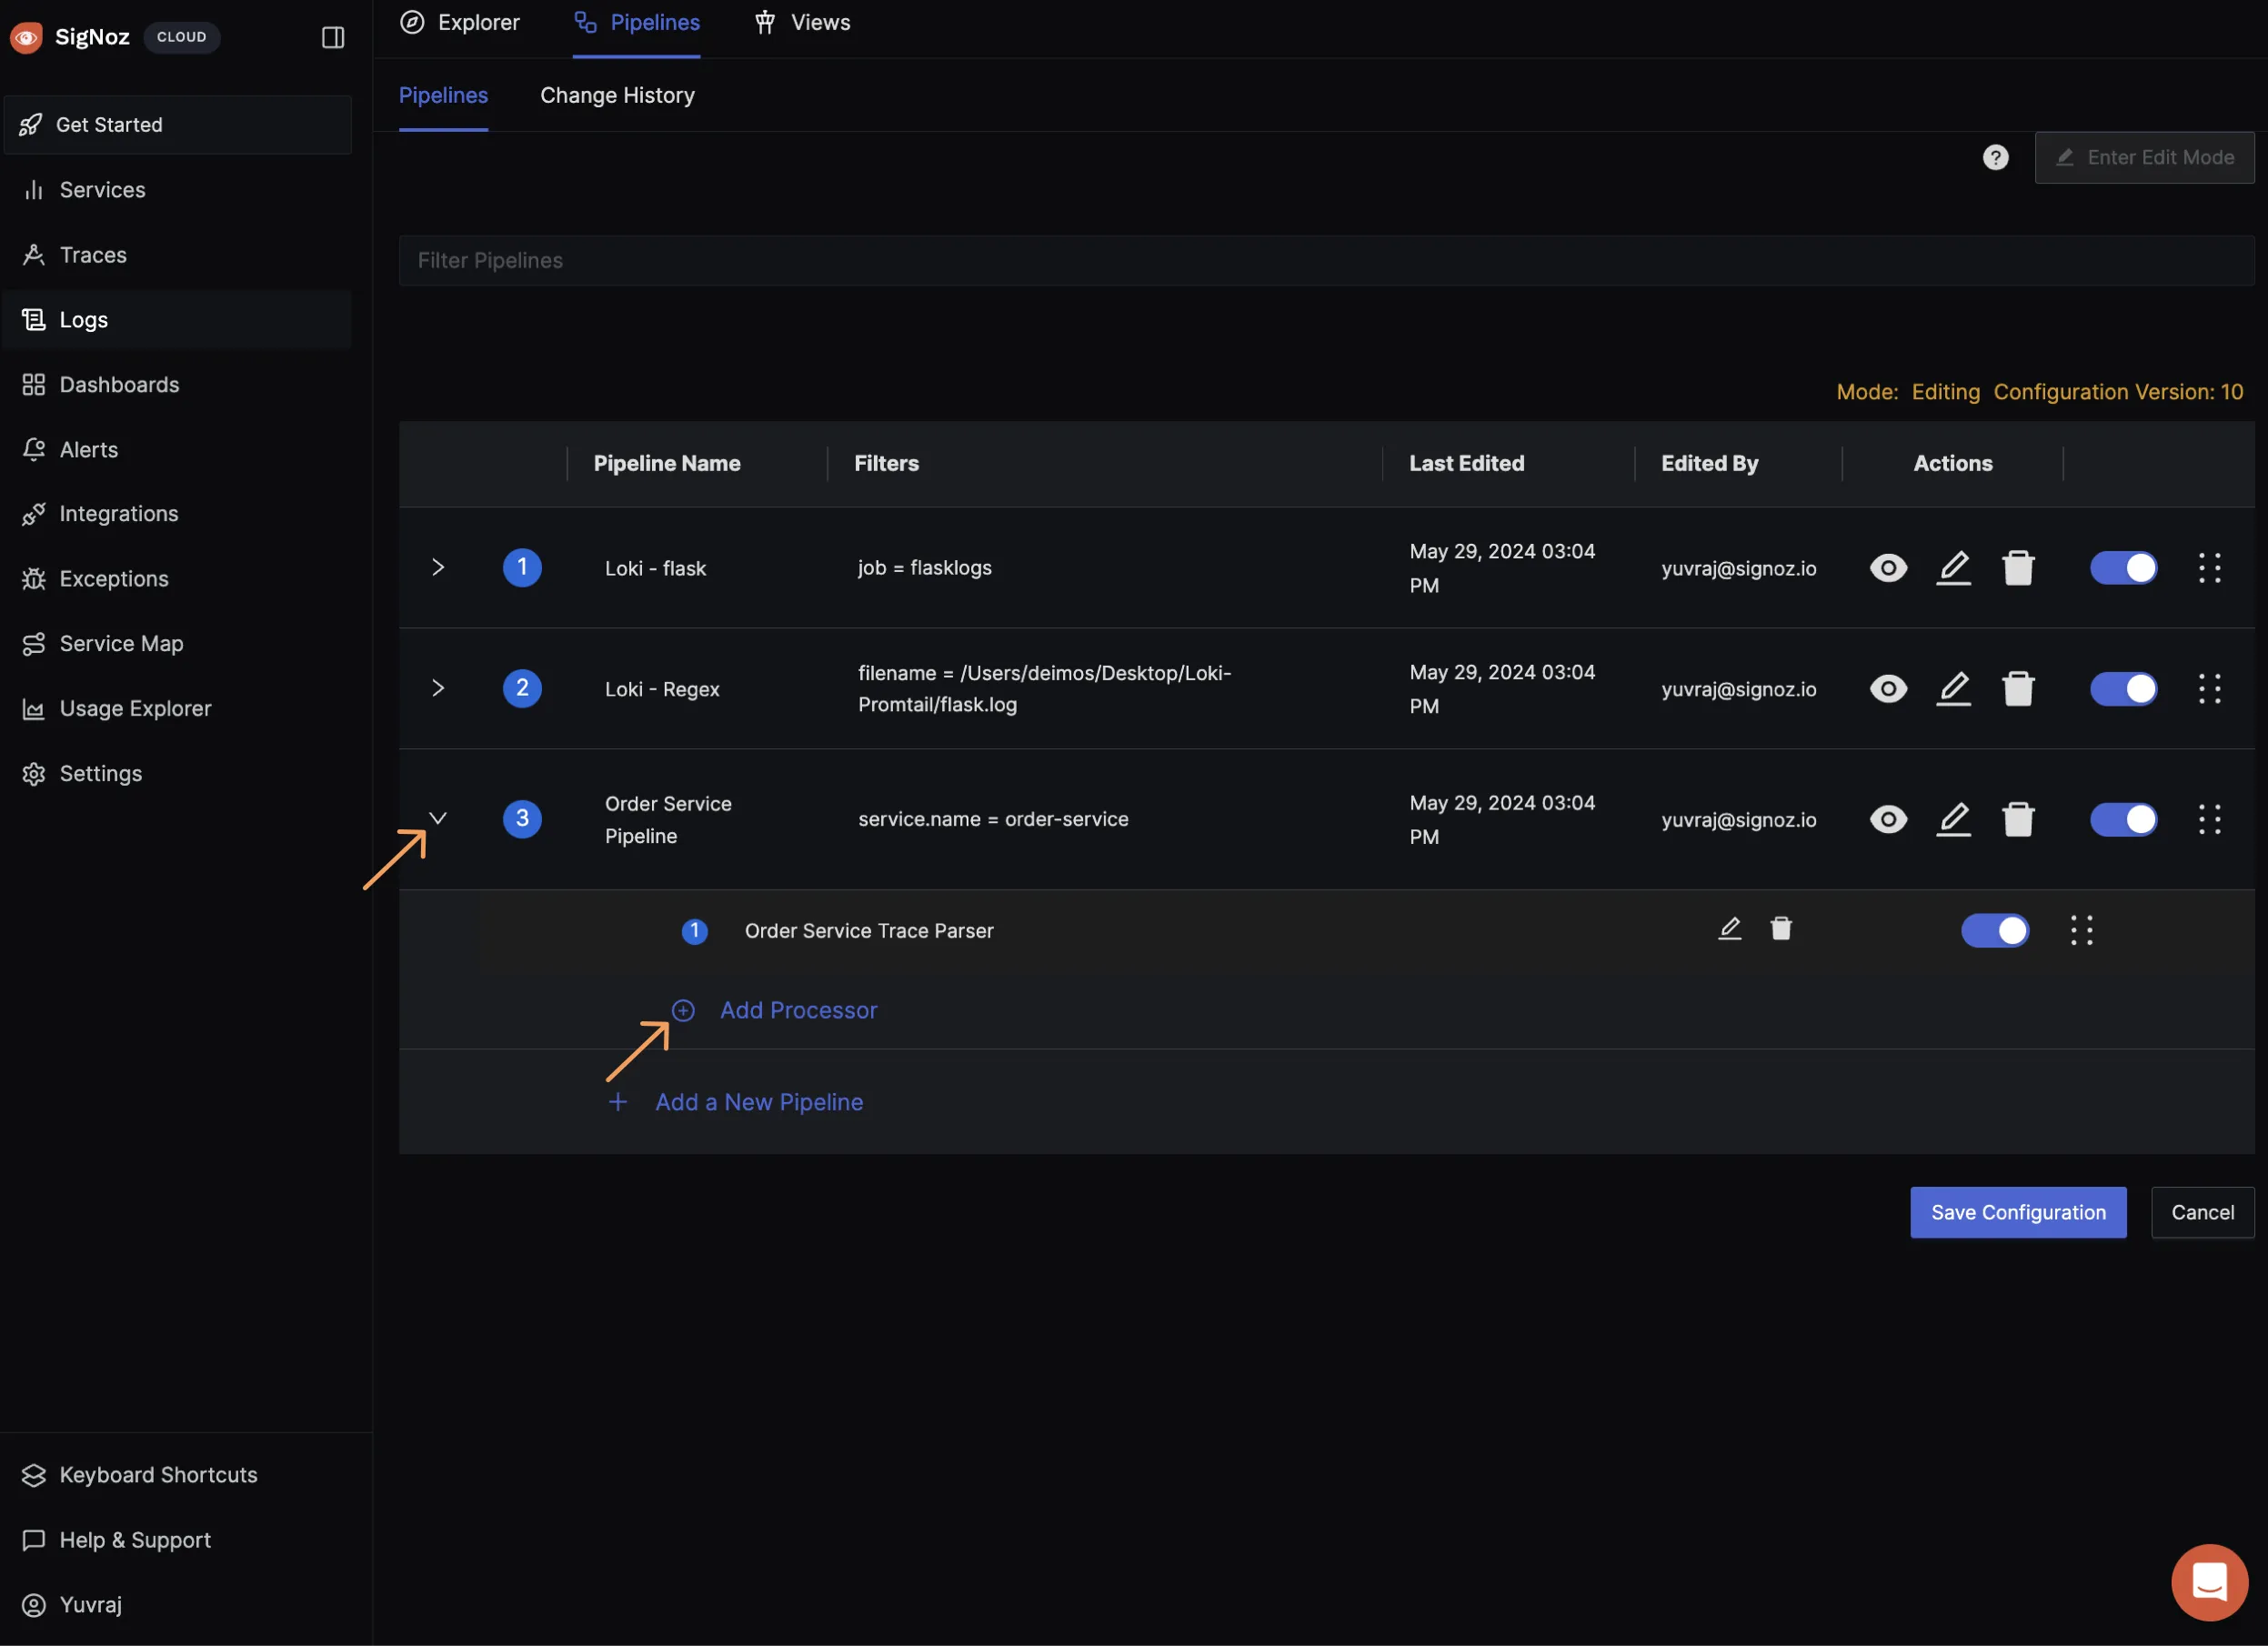
Step 4: Add a processor to the pipeline
Click on the dropdown and add a new processor to the pipeline.
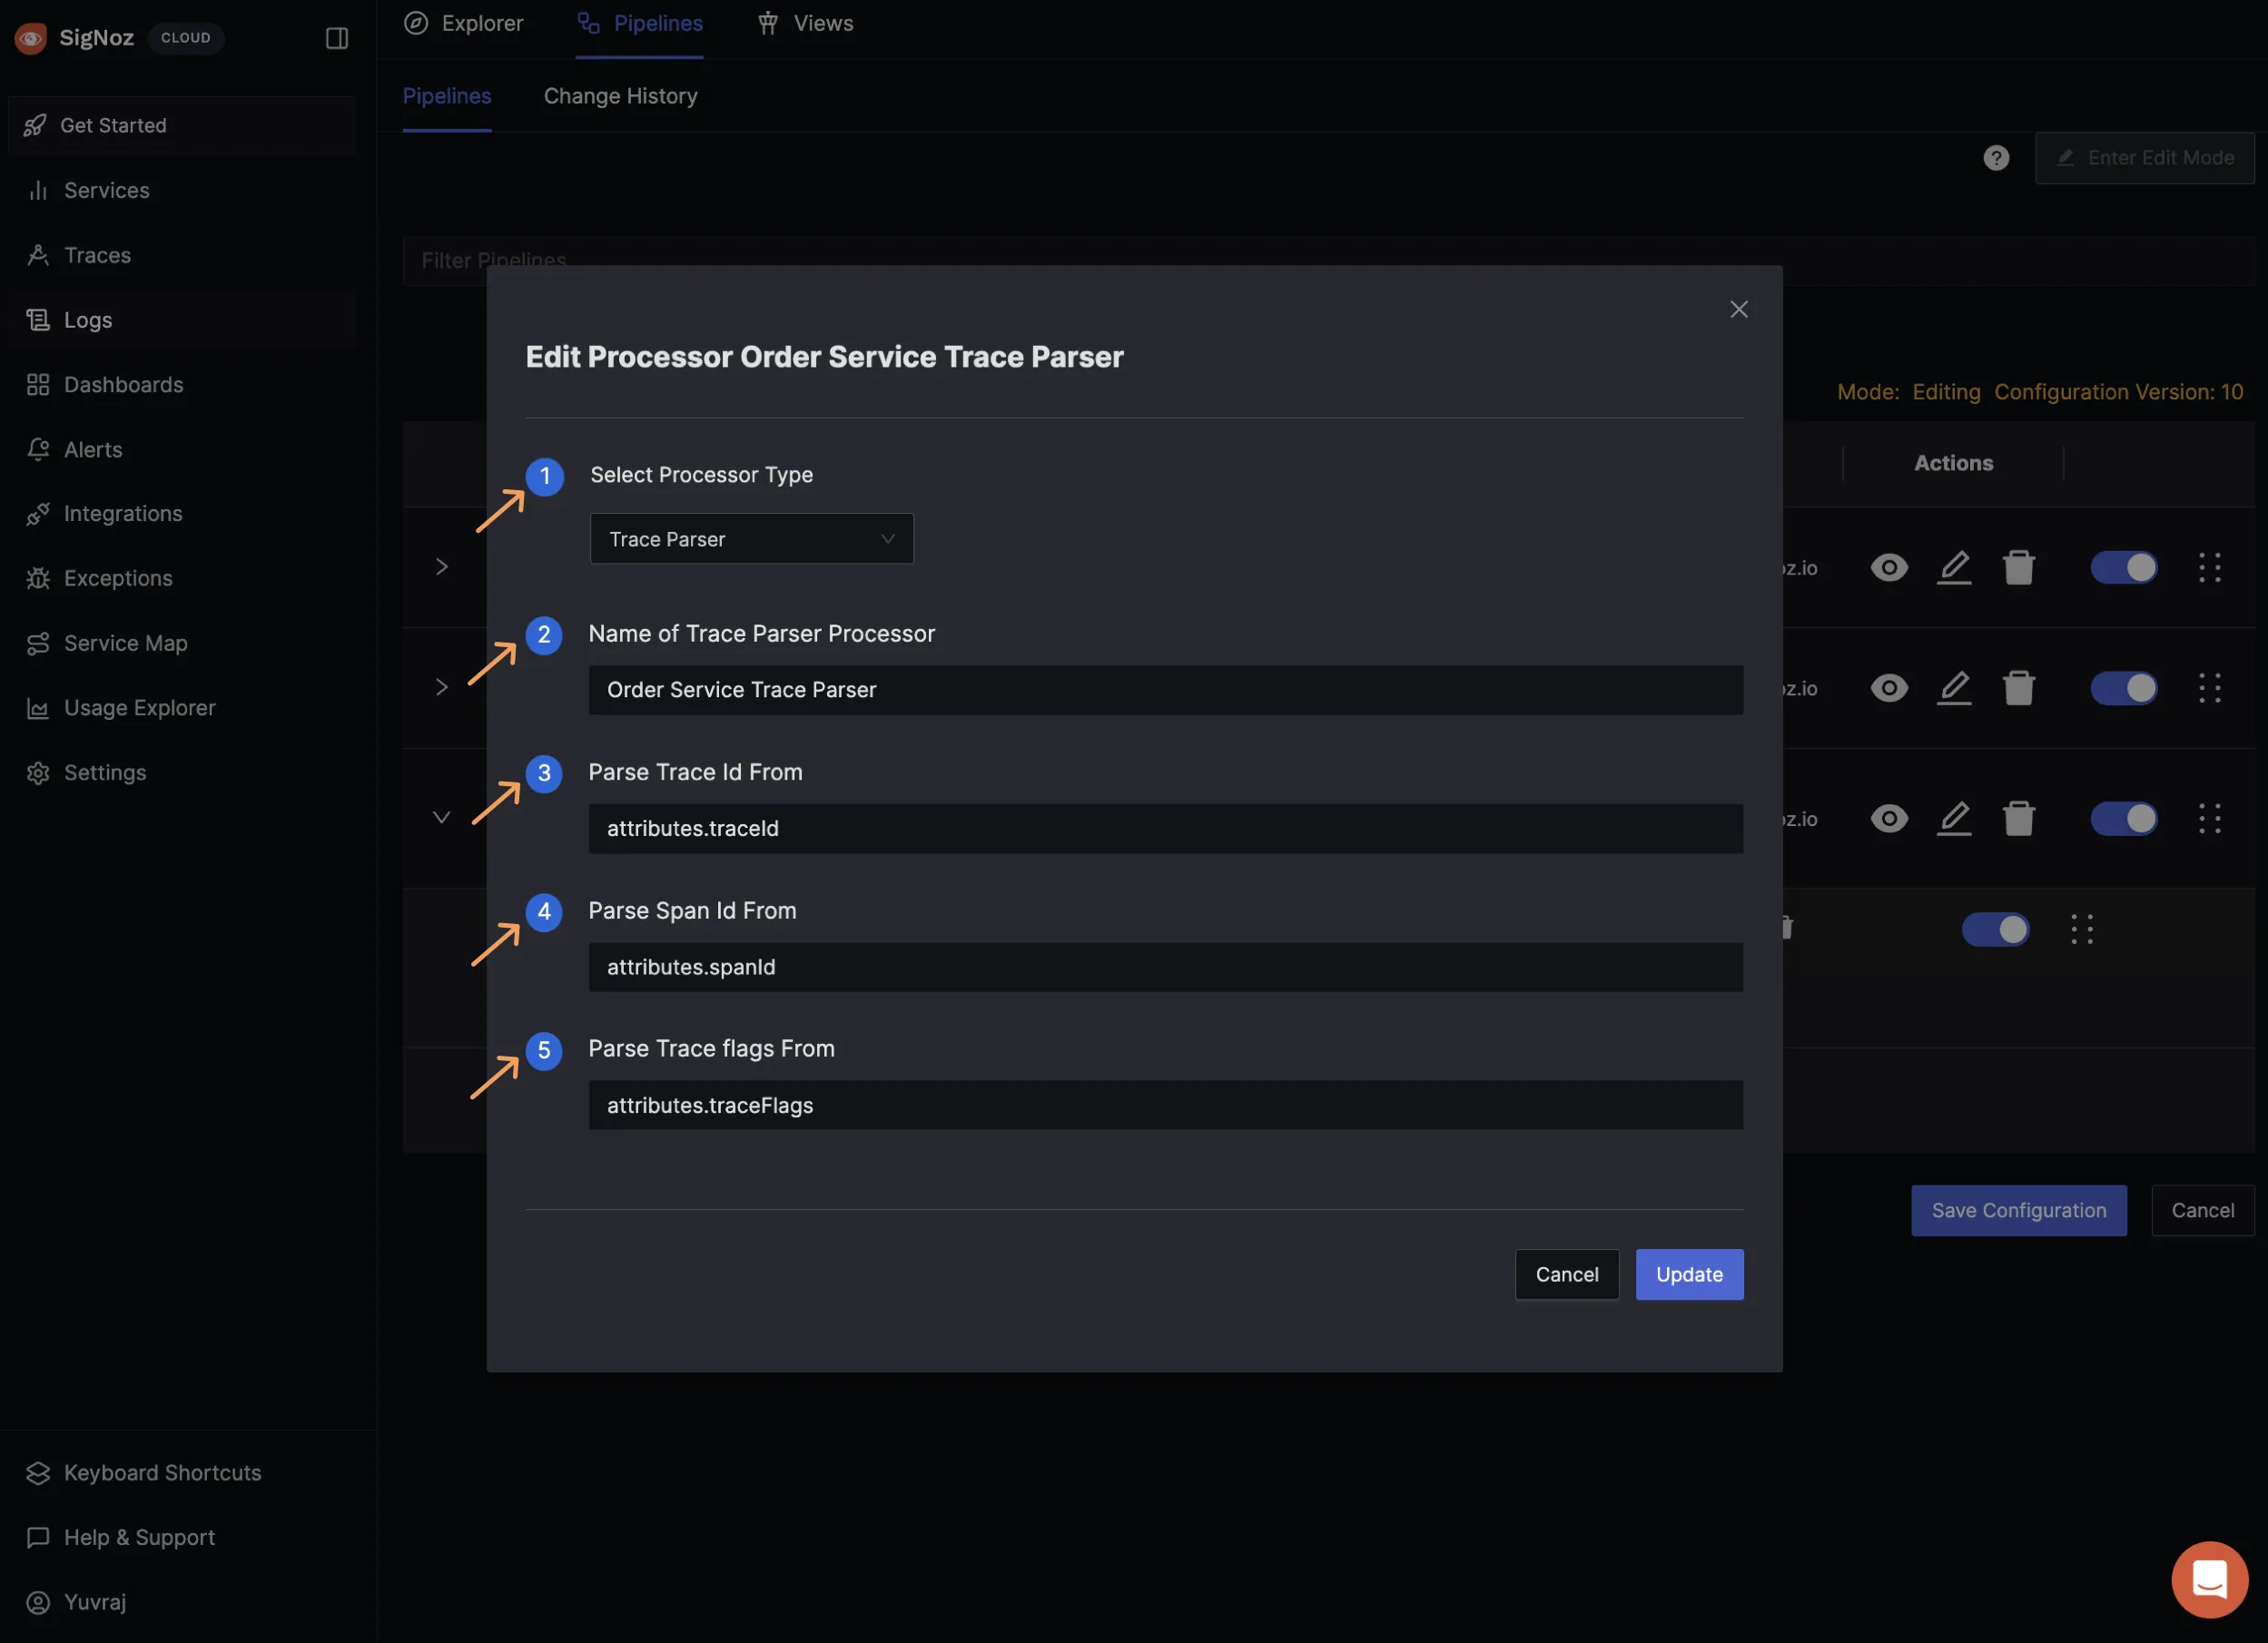
Step 5: Complete the setup for the processor
This allows the pipeline to extract and parse the trace variables from the logs data and add it to the logs in the required format.
Step 6: Simulate the processing
Click on the eye icon on the pipeline and then simulate the processing
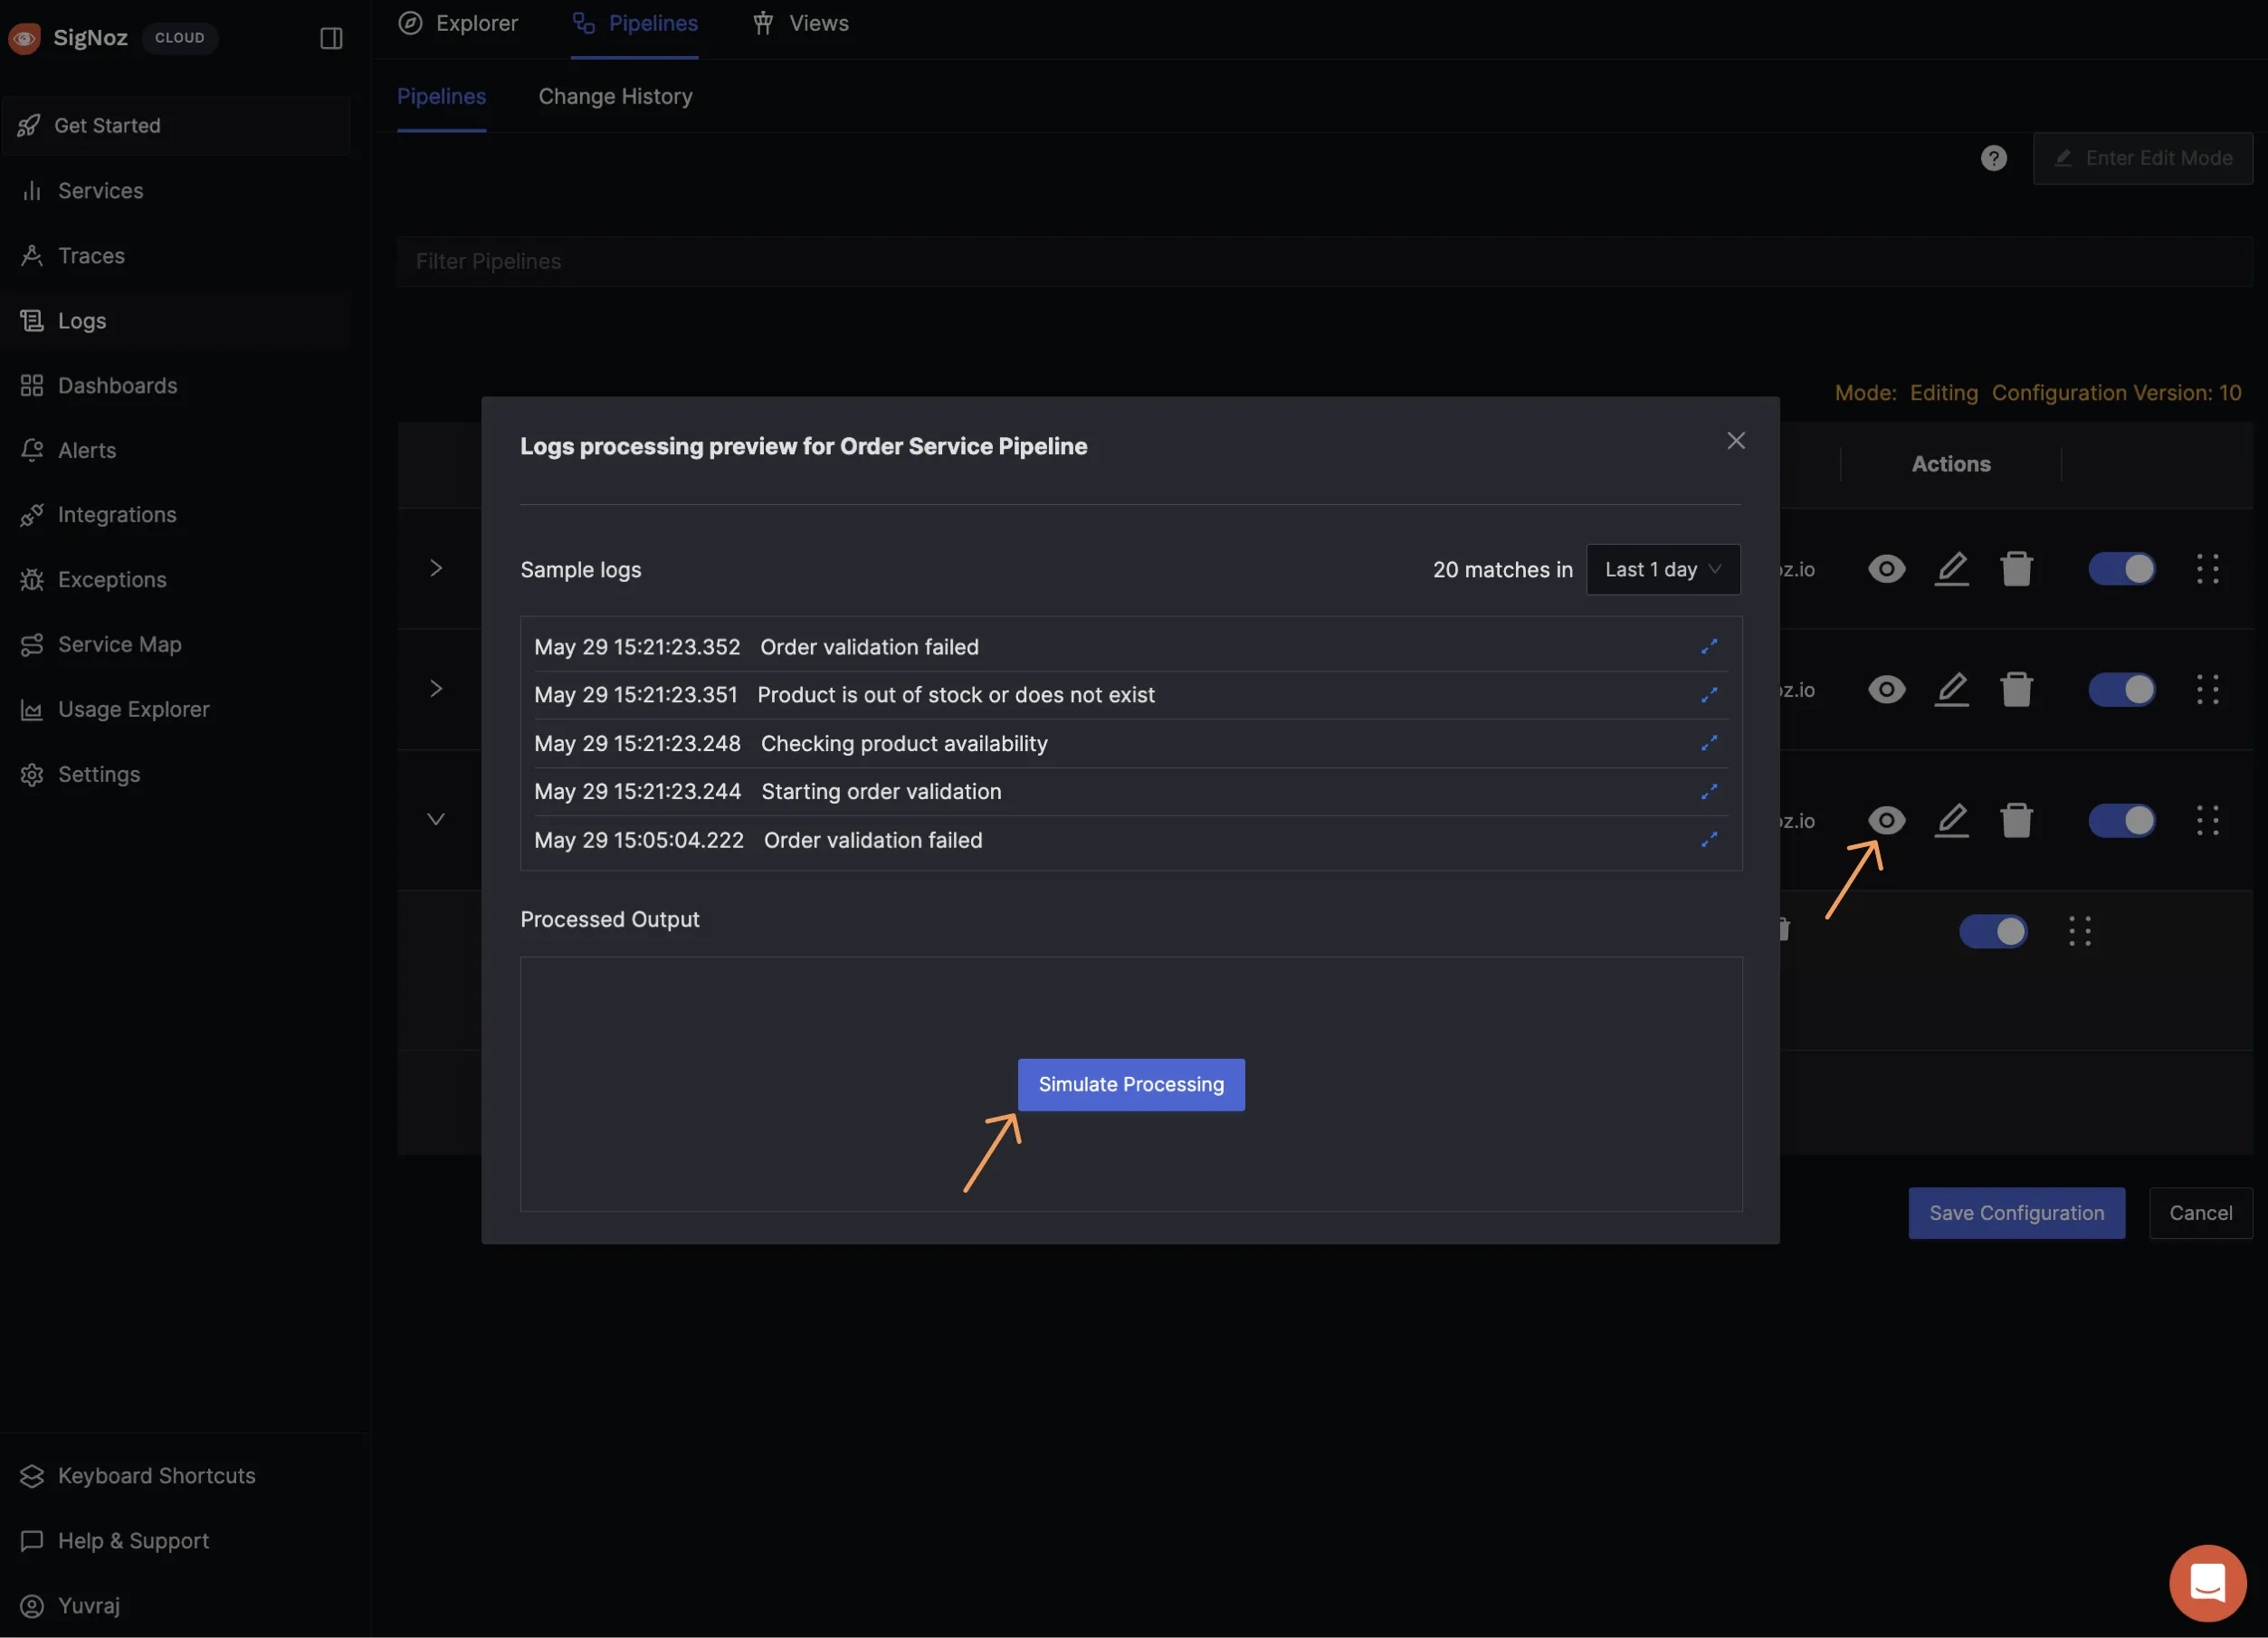
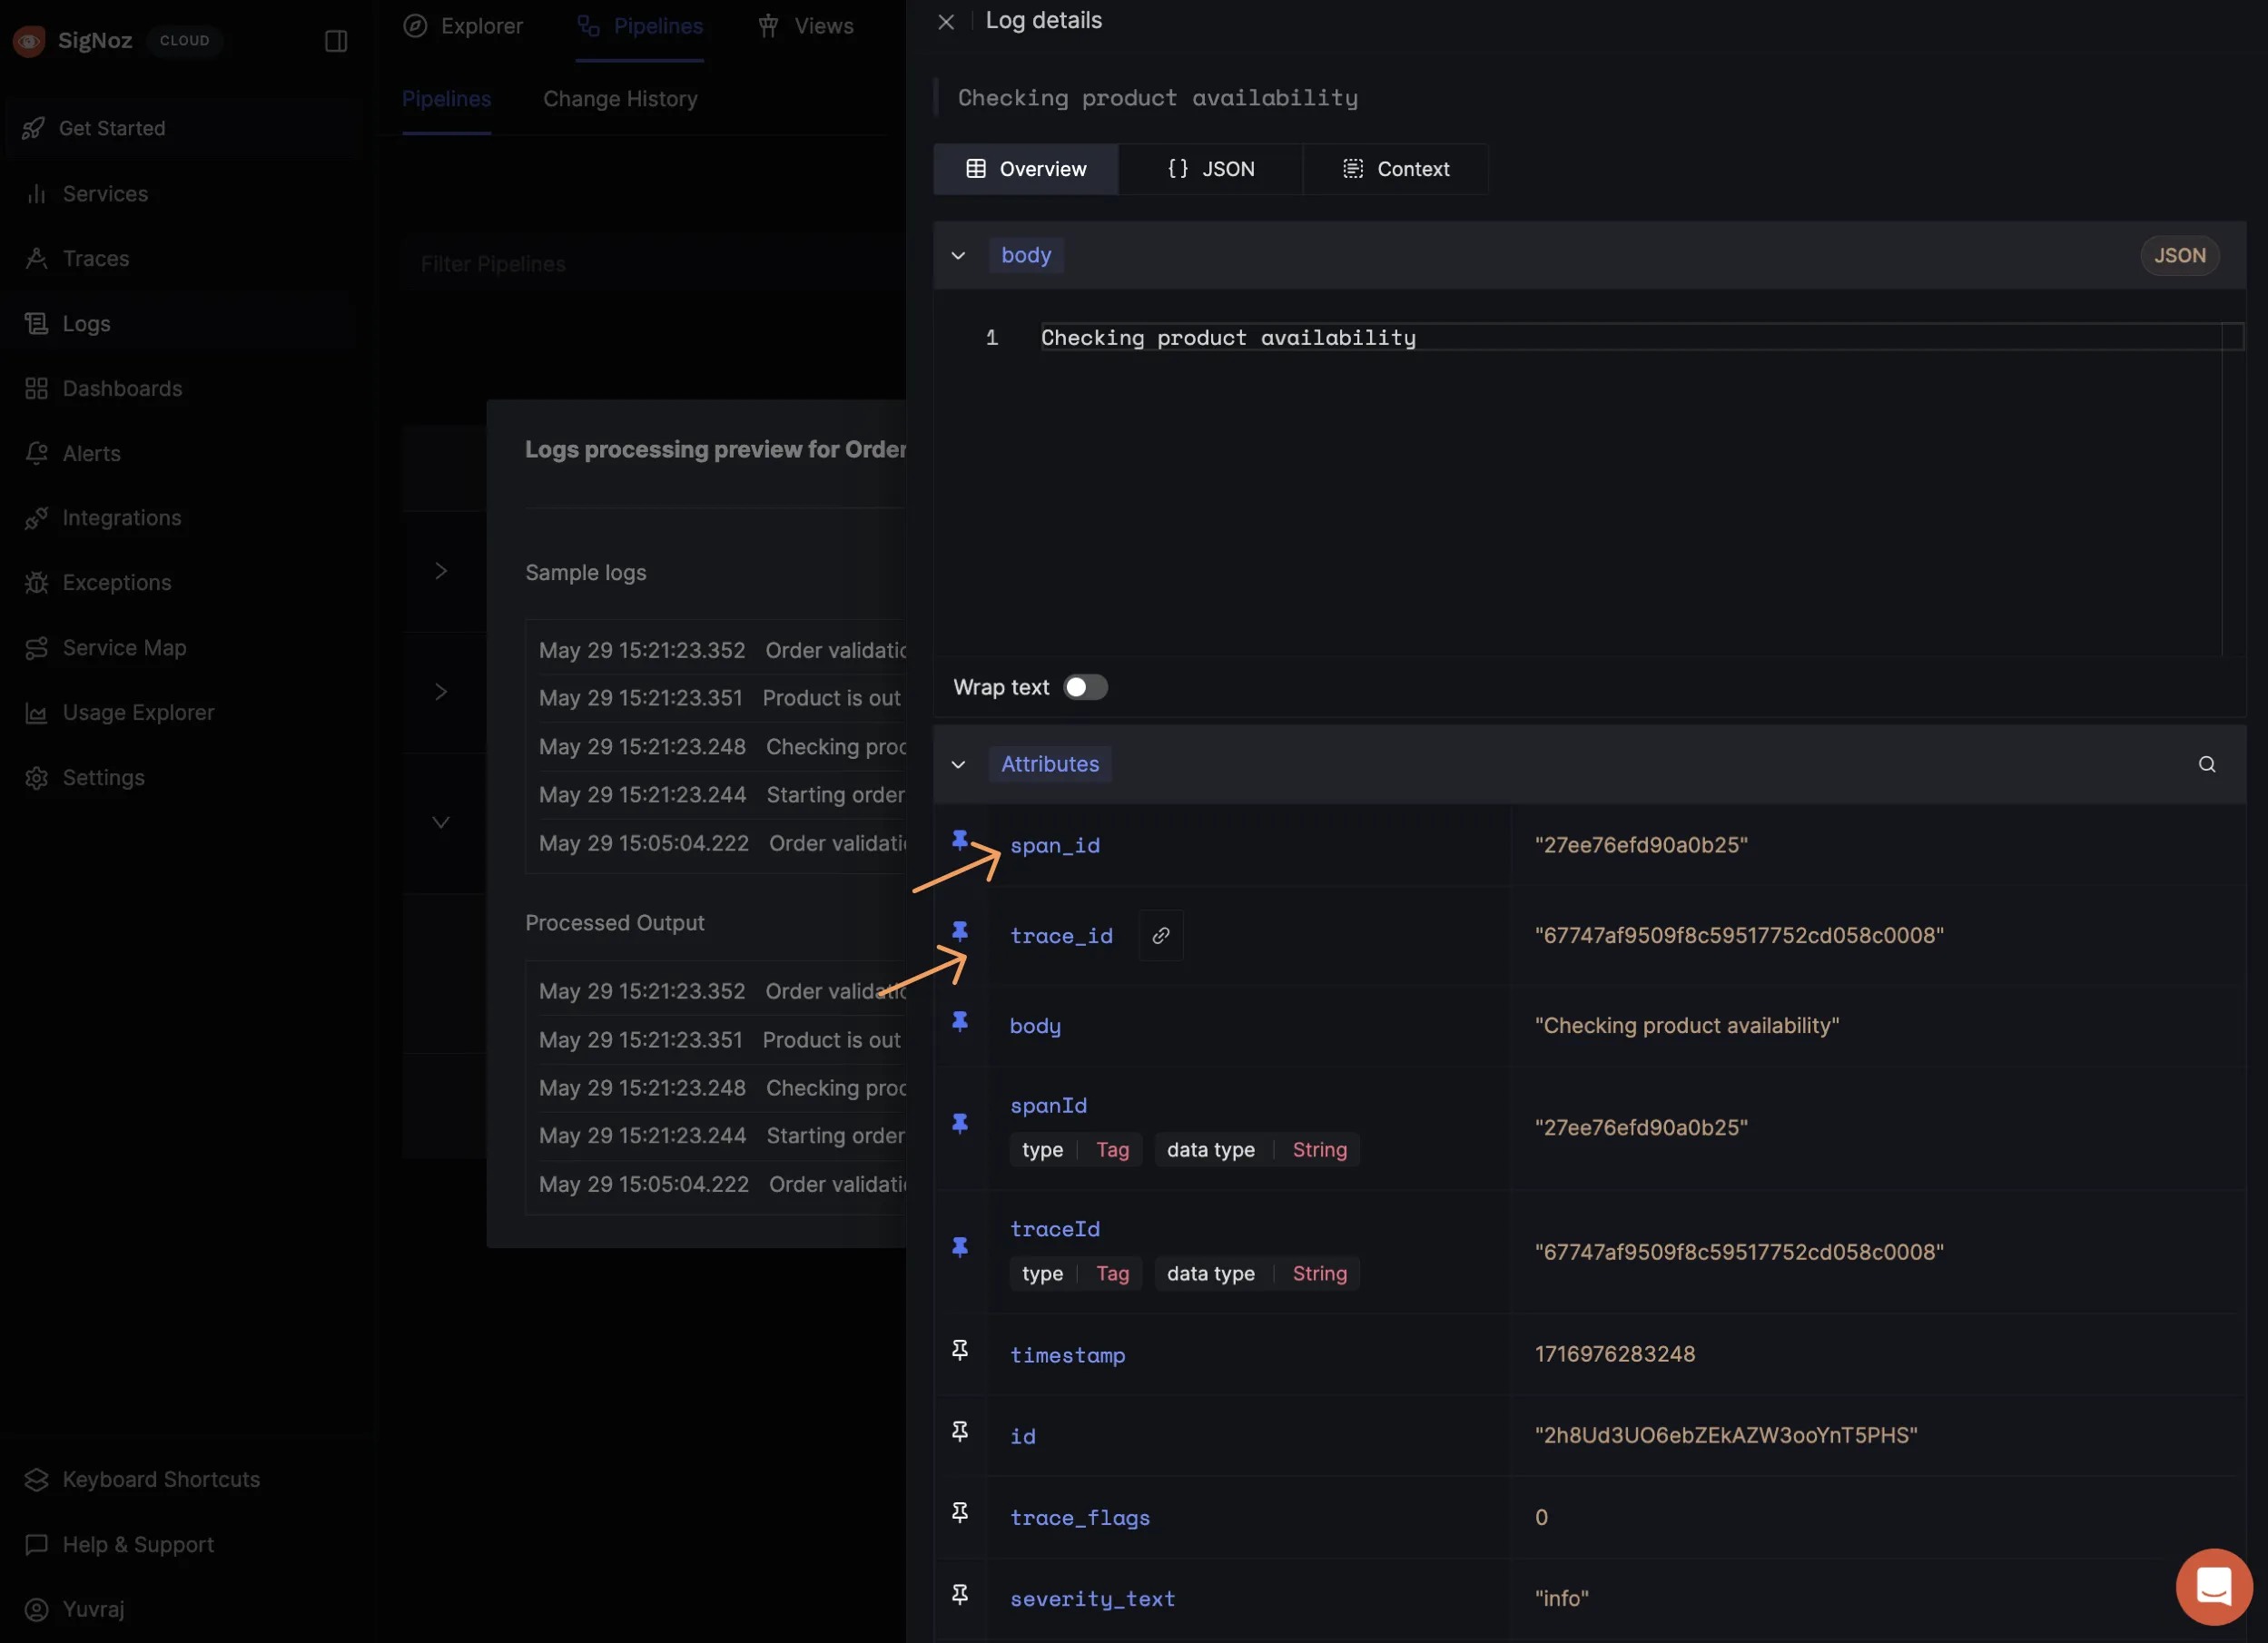
Step 7: Verify the processing
If the span_id and trace_id contains the right value then everything is working alright.
Interacting between Metrics, Traces, and Logs
We can now proceed with checking the panels in SigNoz to go from one telemetry data to another and debug efficiently.
Practical Example
Consider a scenario where an order fails due to an inventory issue. By correlating logs with traces, a developer can quickly identify where the failure occurred and see relevant log statements that provide context about the inventory check, all within the same interface.
Best Practices for Effective Correlation
- Logging Practices: Ensure that logs include key identifiers, such as user IDs, transaction IDs, and any other relevant context that can help link logs with specific operations or transactions.
- Trace Configuration: Set trace configurations to collect enough detail to be useful for debugging while avoiding excessive data collection that could lead to performance issues.
Conclusion
Correlating logs, traces, and metrics provides a powerful way to enhance the observability of microservices. By integrating structured logging with OpenTelemetry and visualizing this data in SigNoz, developers can gain deeper insights into their applications, leading to more effective troubleshooting and improved system reliability.
