Latest Top 11 Observability Tools in Spotlight - 2024's Guide

In microservices architecture, observability tools enable you to create central dashboards to gauge the health of your distributed systems. New age observability tools have shifted to providing quick workflows to debug application issues. In this post we will explore top 11 observability tools that you can consider to use for your software systems.
In today's digital economy, distributed architectures have become the norm. Organizations are also opting for polyglot microservices to boost developer productivity. But how do you manage the operational challenges of such systems?
Customer experience is the key to the success of tech companies of any size, be it startups, mid or large-level enterprises. You need to proactively solve for things like availability and performance of your applications in production. And that's where observability comes into the picture. A robust observability framework is now critical for maintaining your systems in fine health. Observability is powered by telemetry data - a combination of logs, metrics, and traces.
What is an Observability Tool?
The aim of observability is to solve customer issues quickly. Creating monitoring dashboards is useless if it can’t help engineering teams quickly identify the root causes of performance issues.
A modern distributed software system has a lot of moving components. So while setting up monitoring, you might not know what answers you would need to solve an issue. And that’s where observability comes into the picture.
An observability tool enables application owners to get answers to any question that might arise while debugging application issues. Usually, an observability tool helps you to monitor three signals - metrics, traces, and logs.
List of Latest Top 11 observability tools in 2024:
- SigNoz (open-source)
- Dynatrace
- Grafana Labs
- Honeycomb
- New Relic
- Datadog
- Splunk
- Instana
- Appdynamics
- Elastic APM
- Zipkin (open-source)
Top 11 Observability Tools in 2024
Now let's explore the top observability tools in 2024.
SigNoz (Open-Source)
SigNoz is a great observability tool that is open-source and provides three signals in a single pane of glass. You can monitor logs, metrics, and traces and correlate signals for better insights into application performance.
With SigNoz, you can do the following:
- Visualise Traces, Metrics, and Logs in a single pane of glass
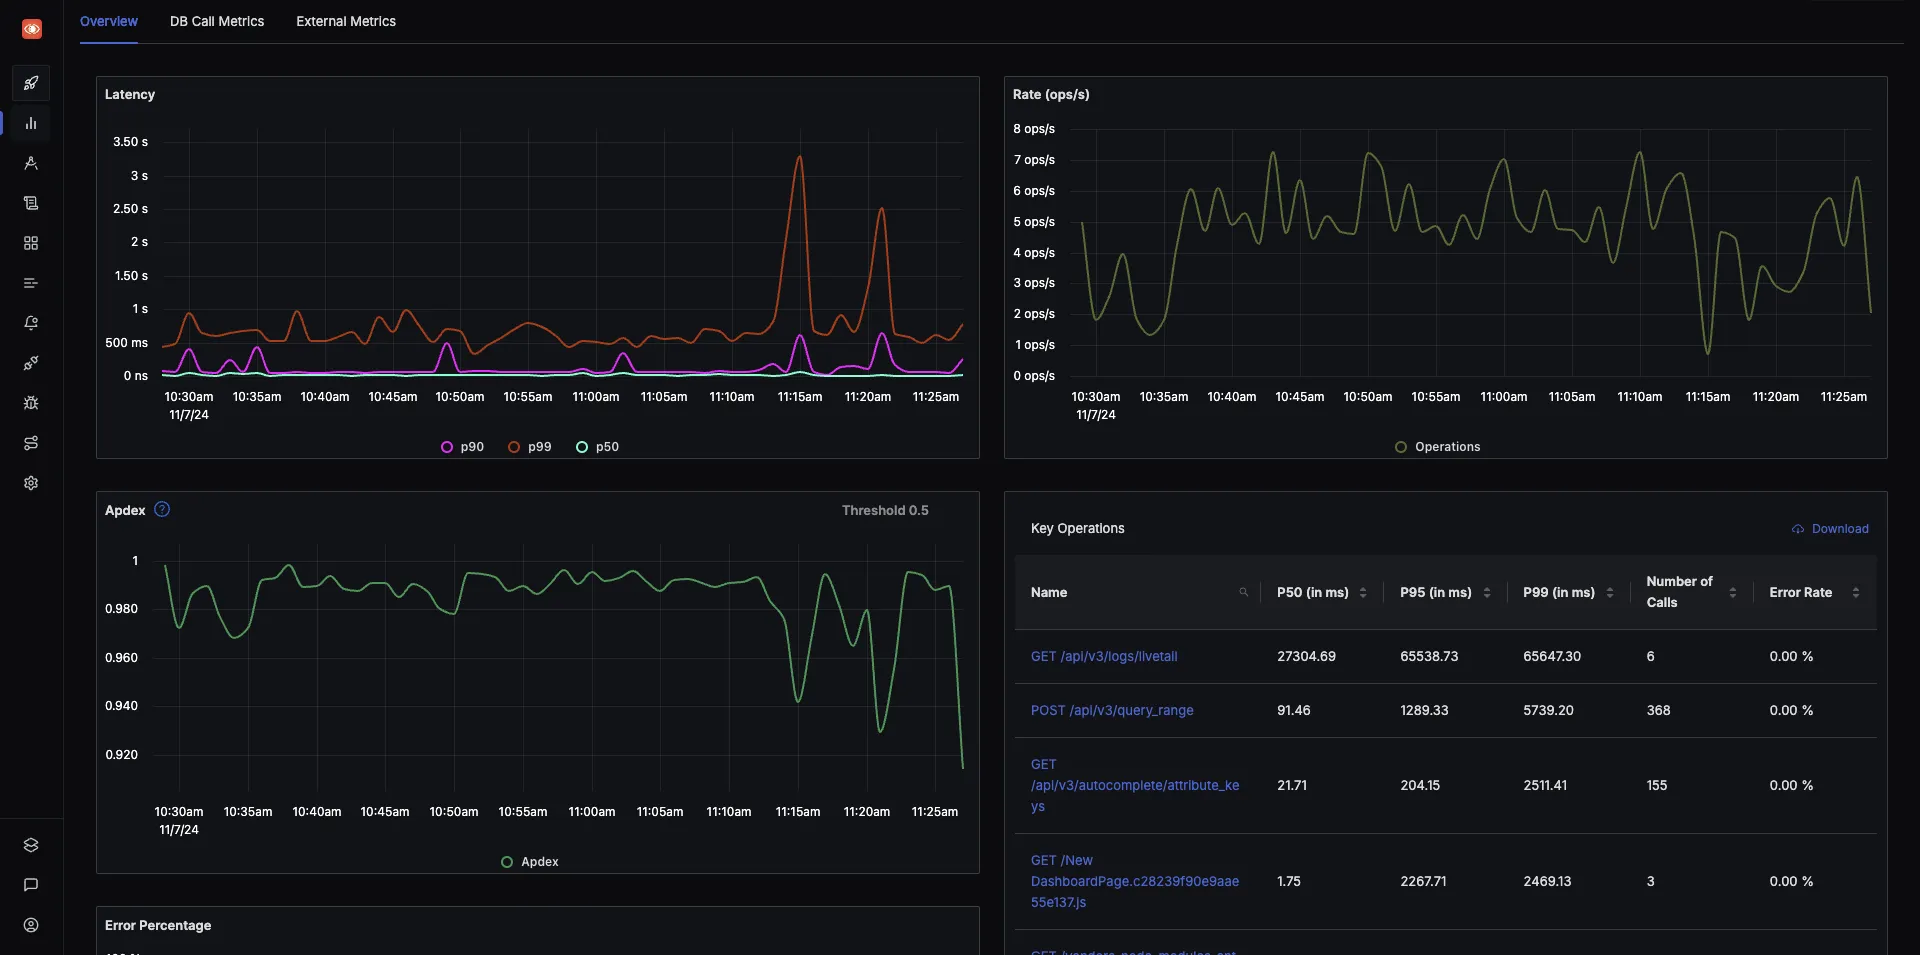
- Monitor application metrics like p99 latency, error rates for your services, external API calls, and individual endpoints.
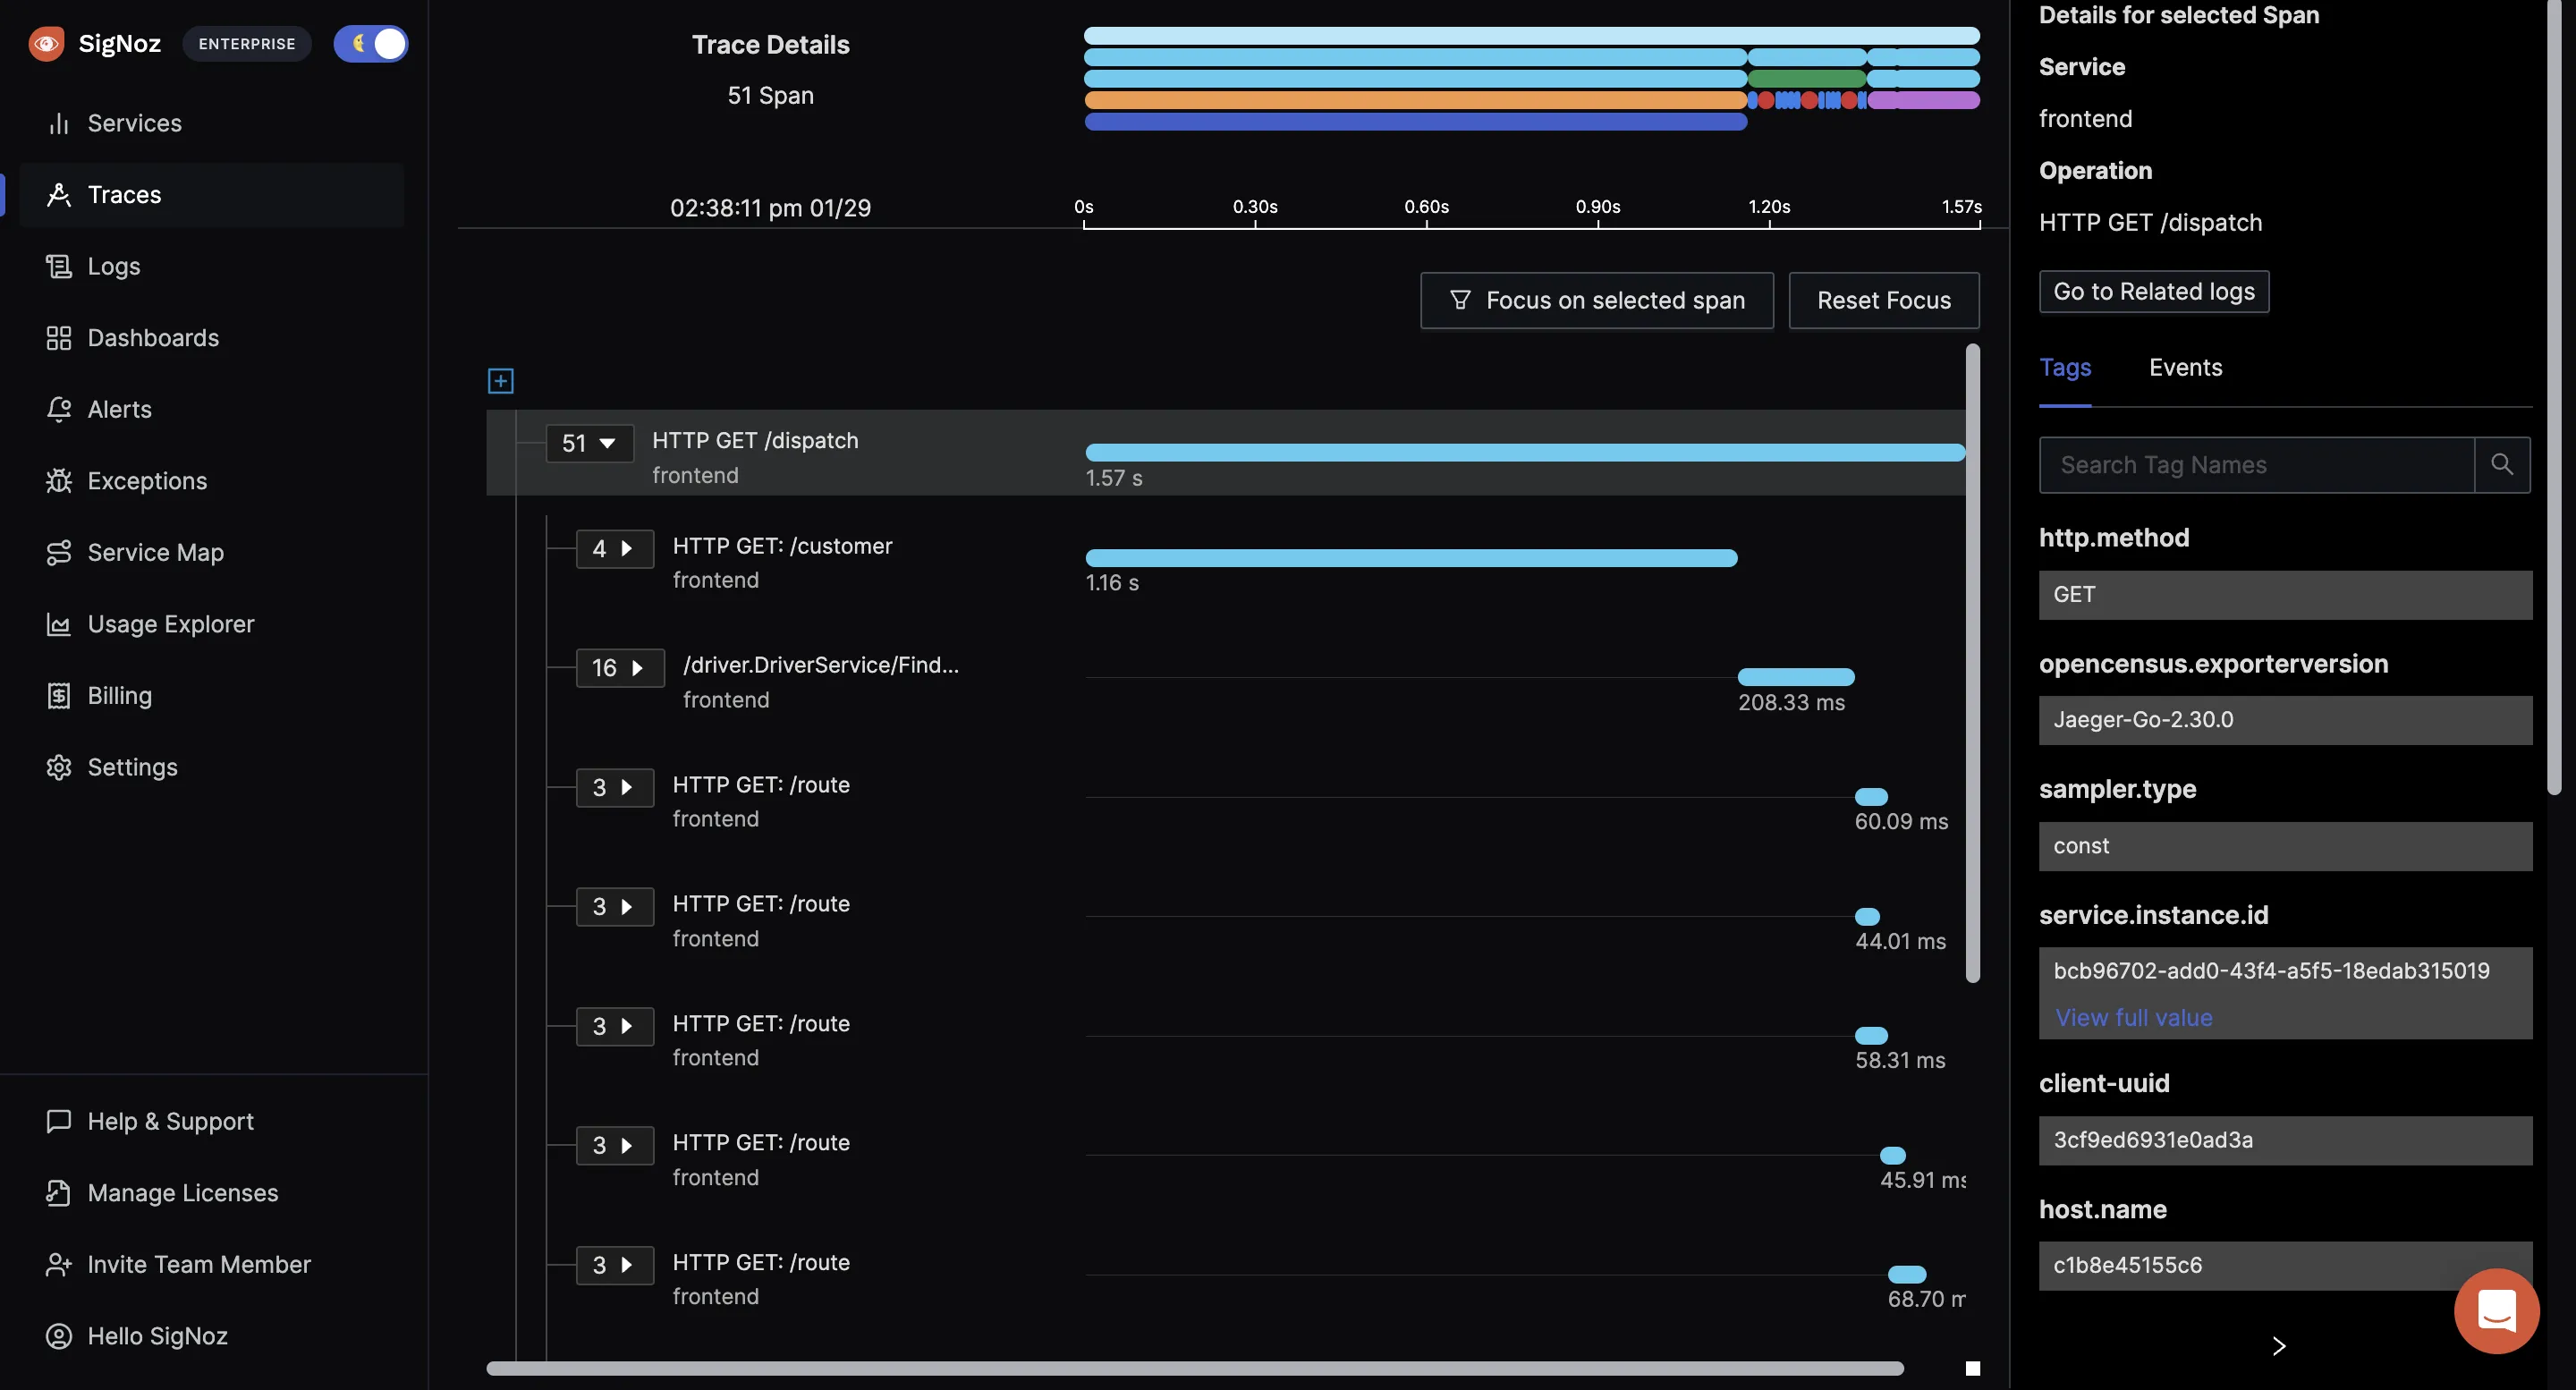
- Find the root cause of the problem by going to the exact traces which are causing the problem and see detailed flamegraphs of individual request traces.
- Run aggregates on trace data to get business-relevant metrics
- Filter and query logs, build dashboards and alerts based on attributes in logs
- Monitor infrastructure metrics such as CPU utilization or memory usage
- Record exceptions automatically in Python, Java, Ruby, and Javascript
- Easy to set alerts with DIY query builder
Detailed flamegraph & Gantt charts to find the exact cause of the issue and which underlying requests are causing the problem.
SigNoz provides Logs management with advanced log query builder. You can also monitor your logs in real-time using live tailing.
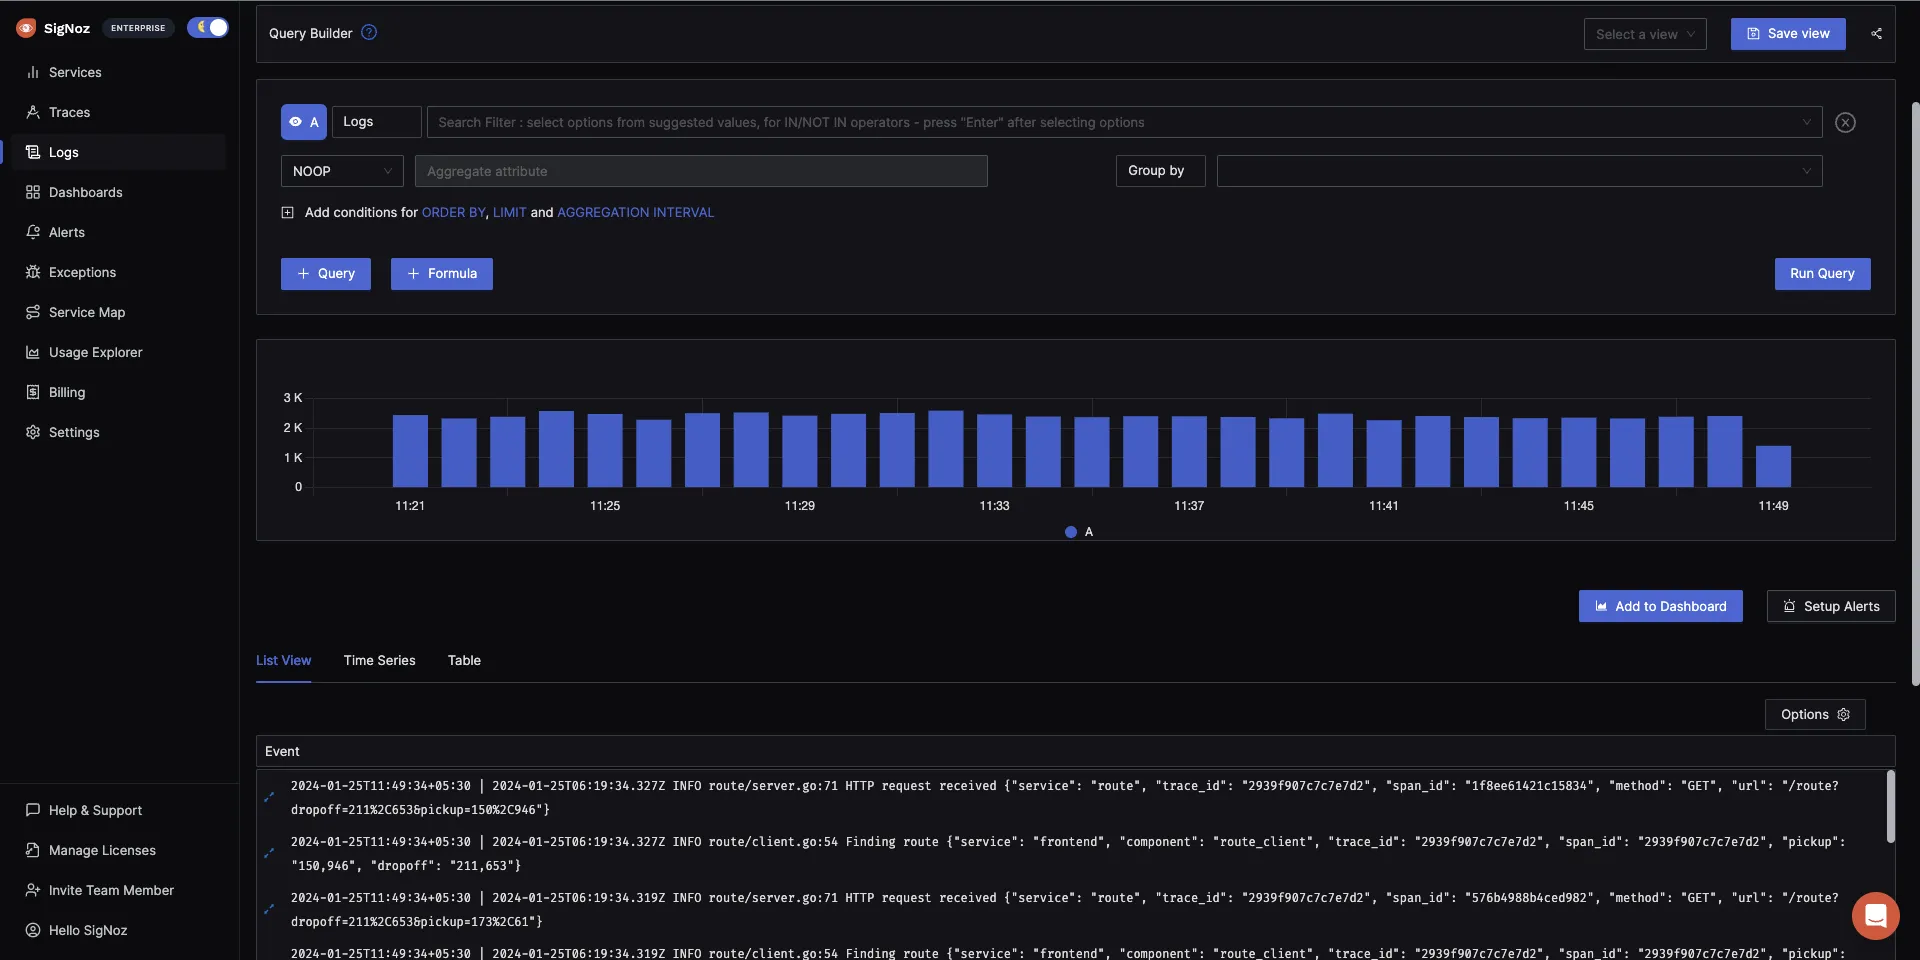
SigNoz is also very cost-efficient and provides a great value for your money. SigNoz cloud is the easiest way to run SigNoz. Sign up for a free account and get 30 days of unlimited access to all features.
Dynatrace
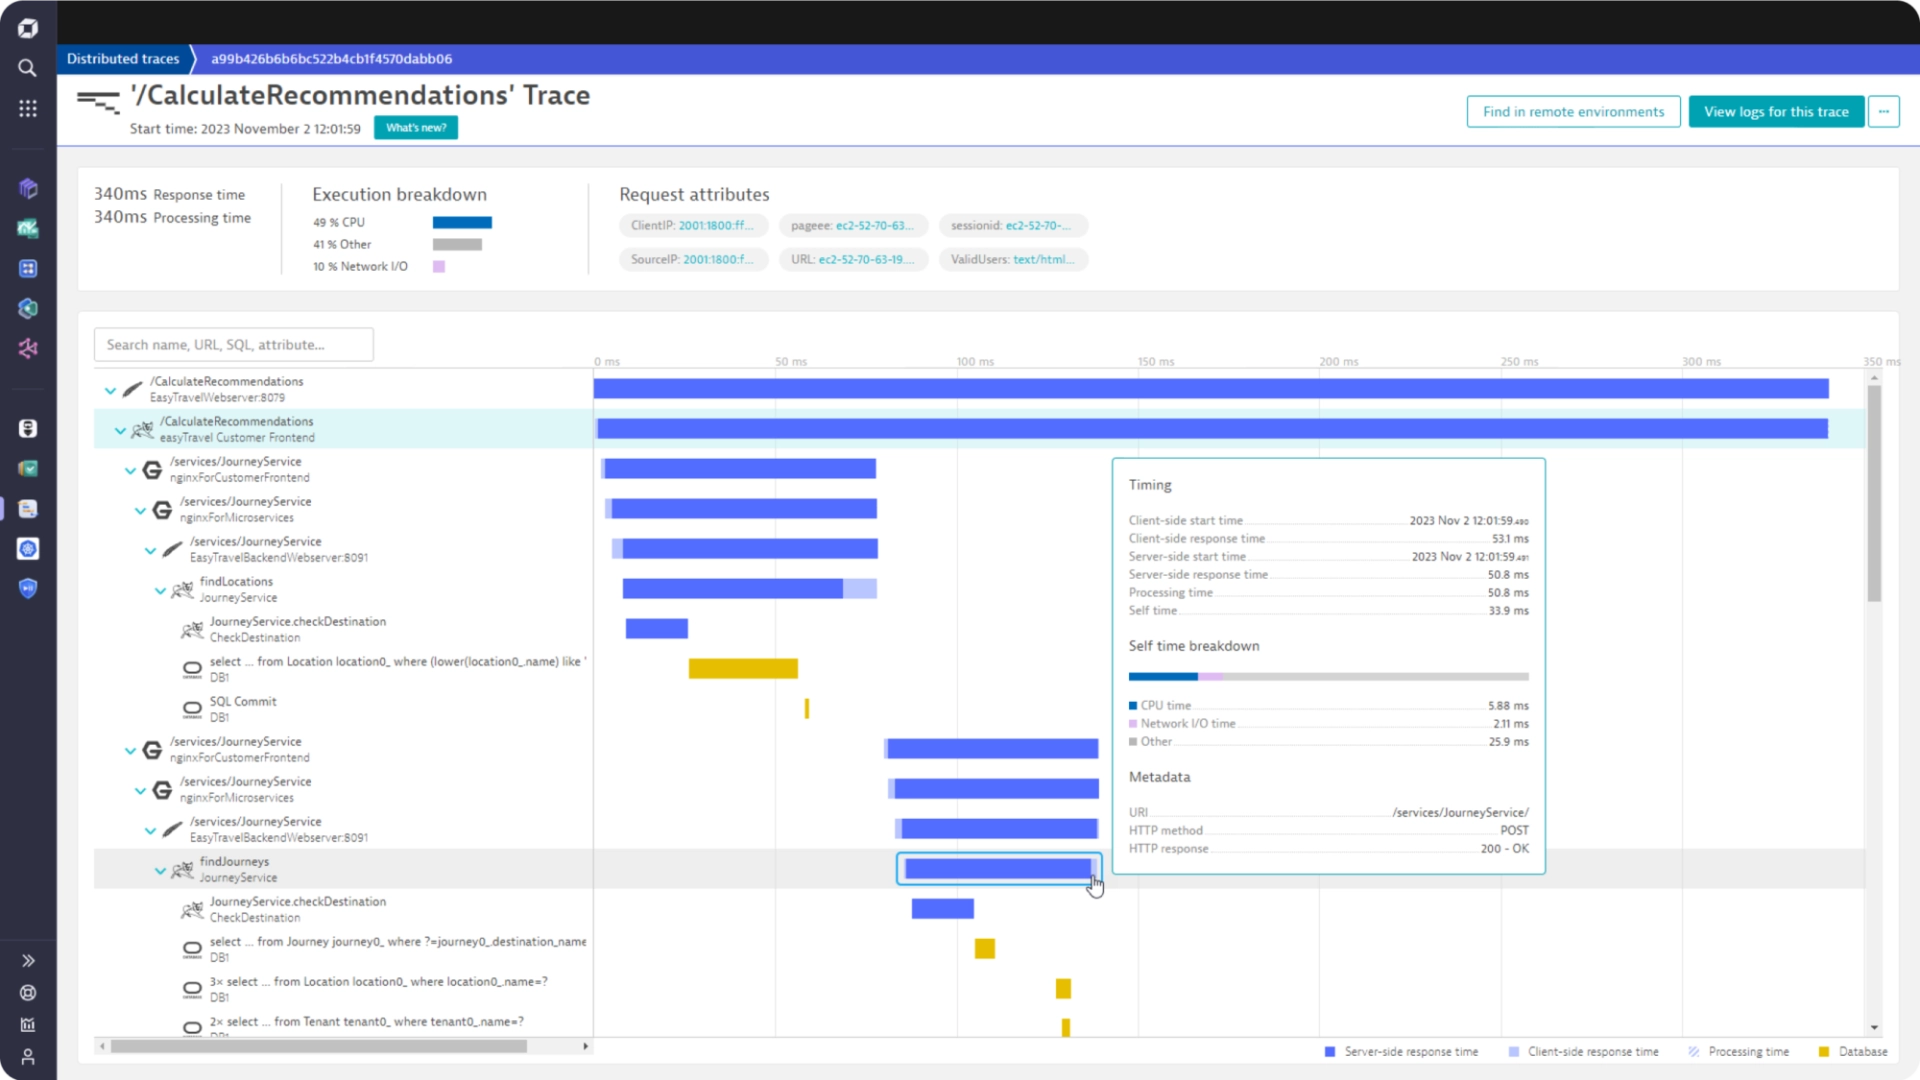
Dynatrace is an extensive SaaS enterprise tool designed for comprehensive monitoring across large-scale IT environments. It provides deep visibility into your entire application, infrastructure, and digital experience through its powerful [AI engine](https://www.dynatrace.com/platform/artificial-intelligence/) for troubleshooting.
Dynatrace offers a comprehensive suite of monitoring solutions designed to cater to various aspects of IT operations and digital experiences such as infrastructure monitoring, application security, and cloud automation, among others. The pricing for each solution varies.
Some of the key features of Dynatrace are:
- Automatic injection and collection of data.
- Automation of root cause analysis and anomaly detection.
- Code-level visibility across all application tiers for web and mobile apps together.
- Always-on code profiling and diagnostic tools for application analysis.
If you want to learn more about Dynatrace, check out our Dynatrace comparison guide with New Relic.
Grafana Labs
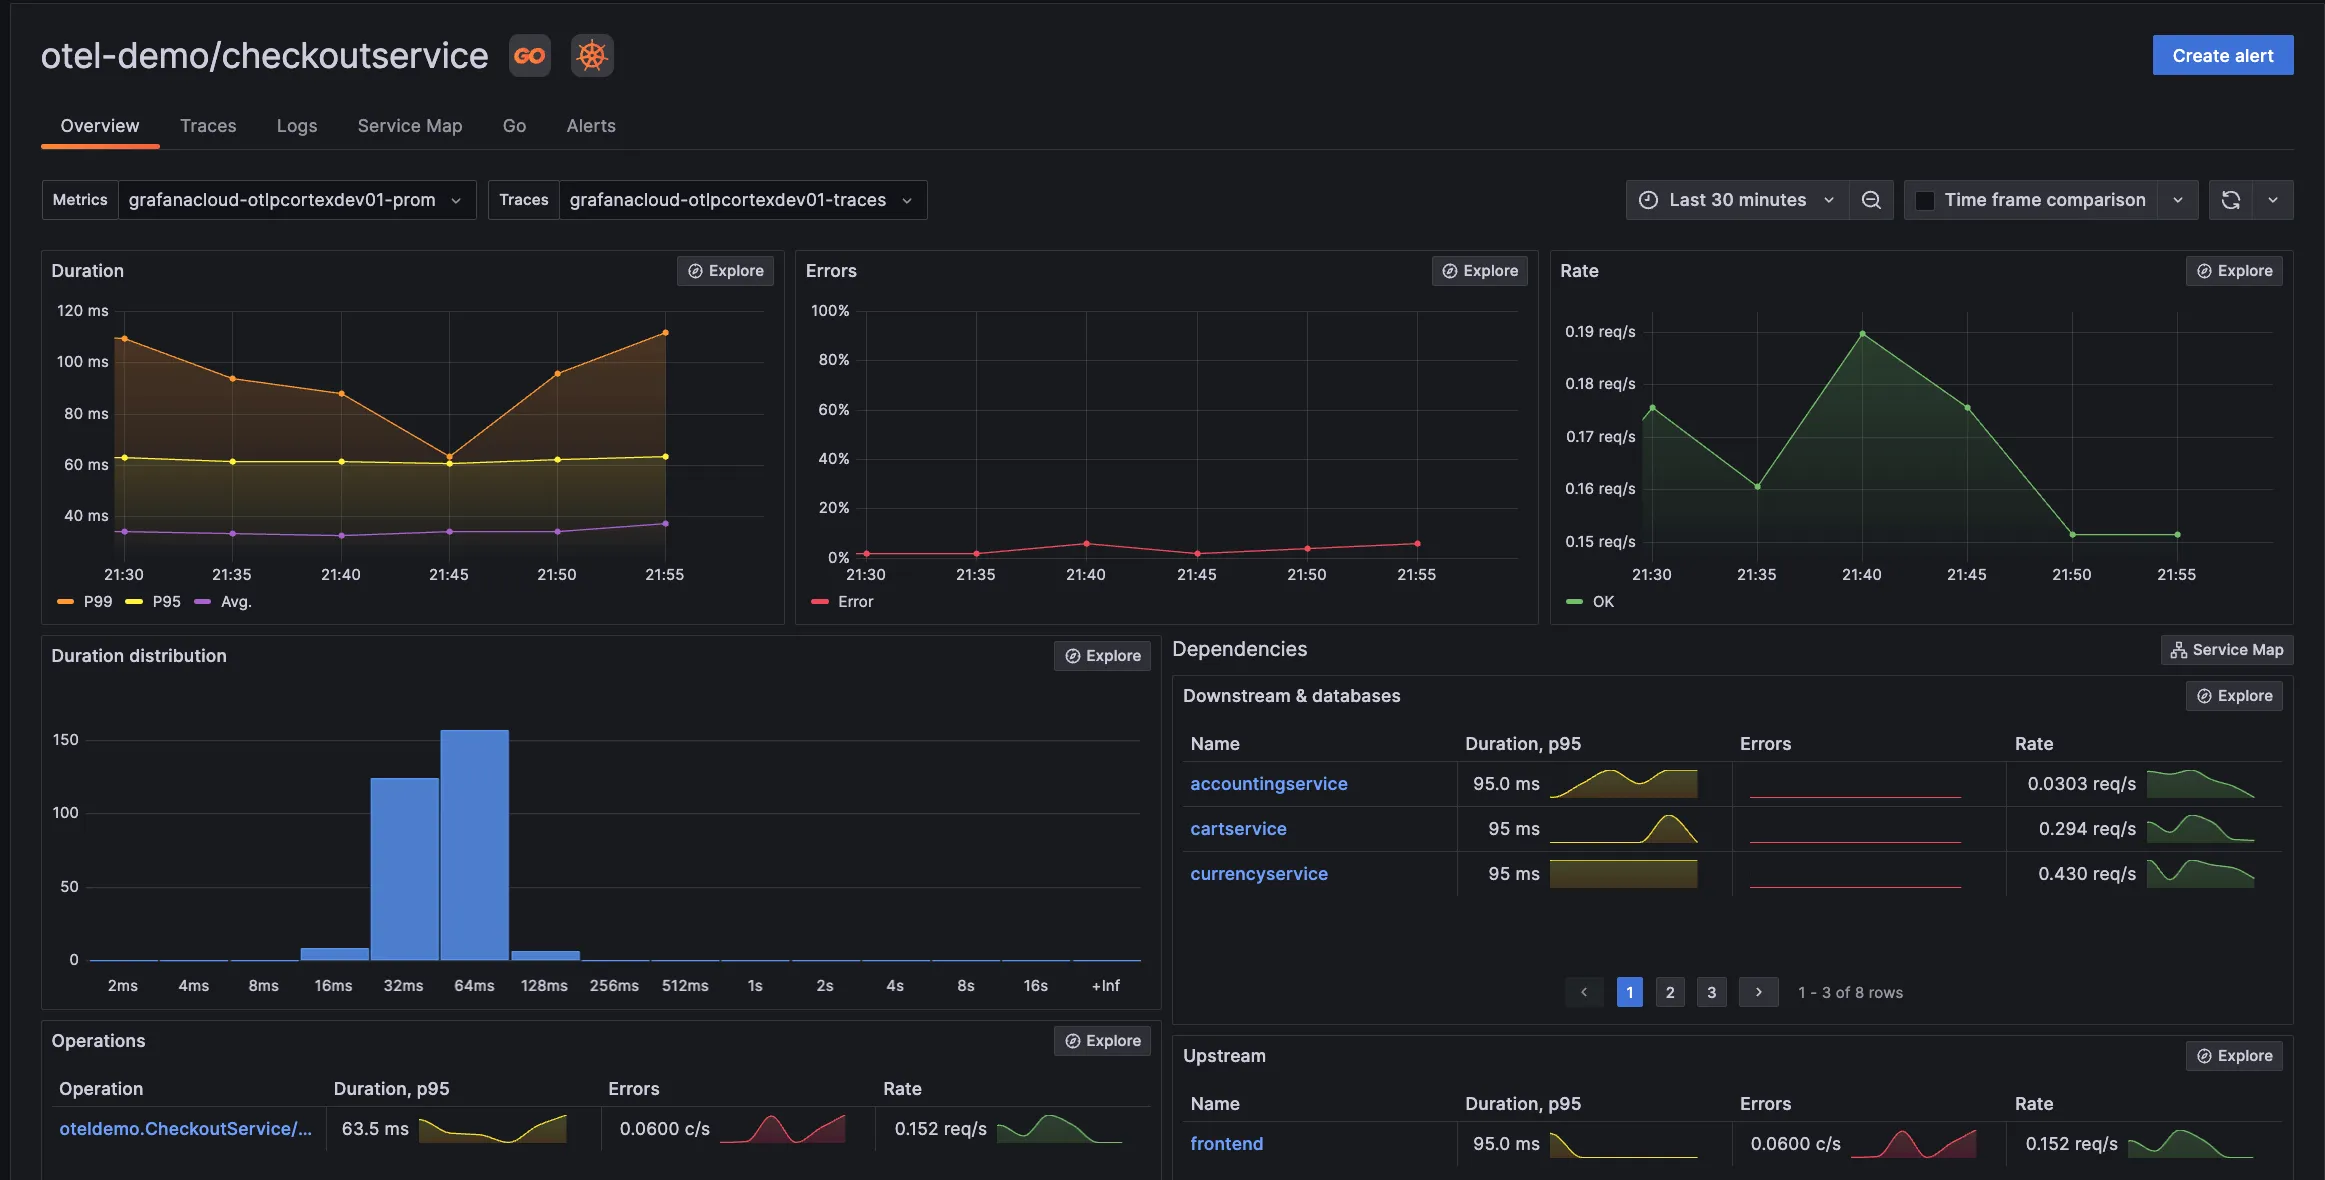
Grafana is a popular open-source analytics and interactive visualization web layer. It offers plugins, dashboards, alerts, and different user-level access for governance as an observability tool. In addition, it provides two versions of services:
- Grafana Cloud: You can send your data to Grafana Cloud dashboards. It provides solutions such as Grafana Cloud Logs, Grafana Cloud Metrics, and Grafana Cloud Traces.
- Grafana Enterprise stack: It provides support for metrics and logs with Grafana installed within your infrastructure. It also comes with expert support.
Some of the key features of Grafana are:
- Collection of data from multiple data sources.
- Rich visualization options like graphs (line, bar, heatmap), gauges, and single stats.
- Customization of dashboards and visualizations.
If you want to learn more about Grafana, check out our Grafana comparison guide with New Relic.
Honeycomb
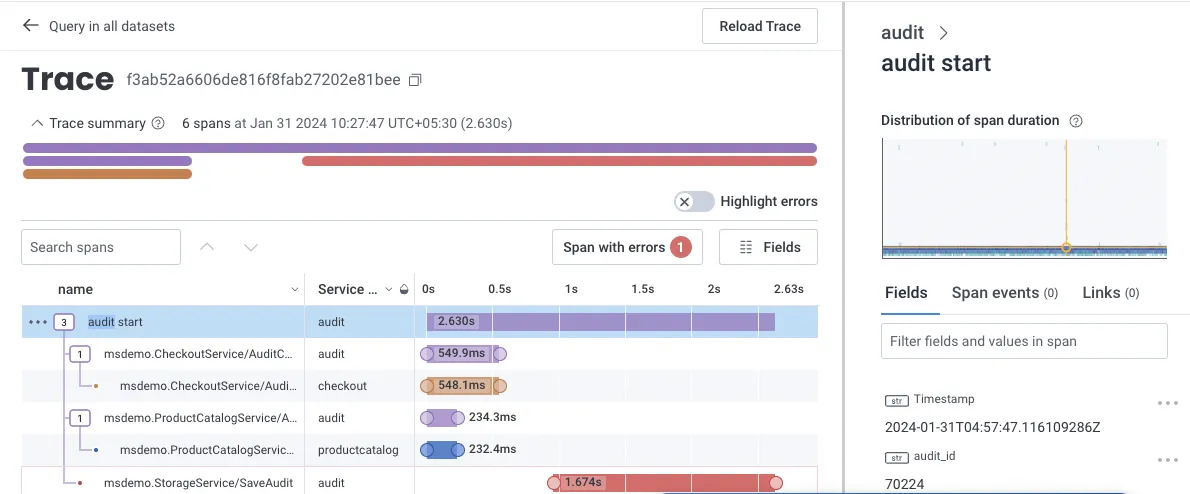
Honeycomb is a full-stack, cloud-based observability tool that provides the visibility engineering teams need to troubleshoot problems in distributed systems.
If your code is not instrumented, Honeycomb has an automatic instrumentation agent called "Honeycomb Beelines" to take care of that for you. It also supports OpenTelemetry for generating instrumentation data.
Honeycomb offers a free-tier version, and its pro version starts at $130. The pricing is based on the amount of data retained and the volume of events captured.
Some of the key features of Honeycomb are:
- Quick diagnosis of bottlenecks and performance optimization.
- Advanced querying capabilities and visualization tools.
- Full-text search over trace spans and toggles to collapse and expand sections of trace waterfalls.
New Relic
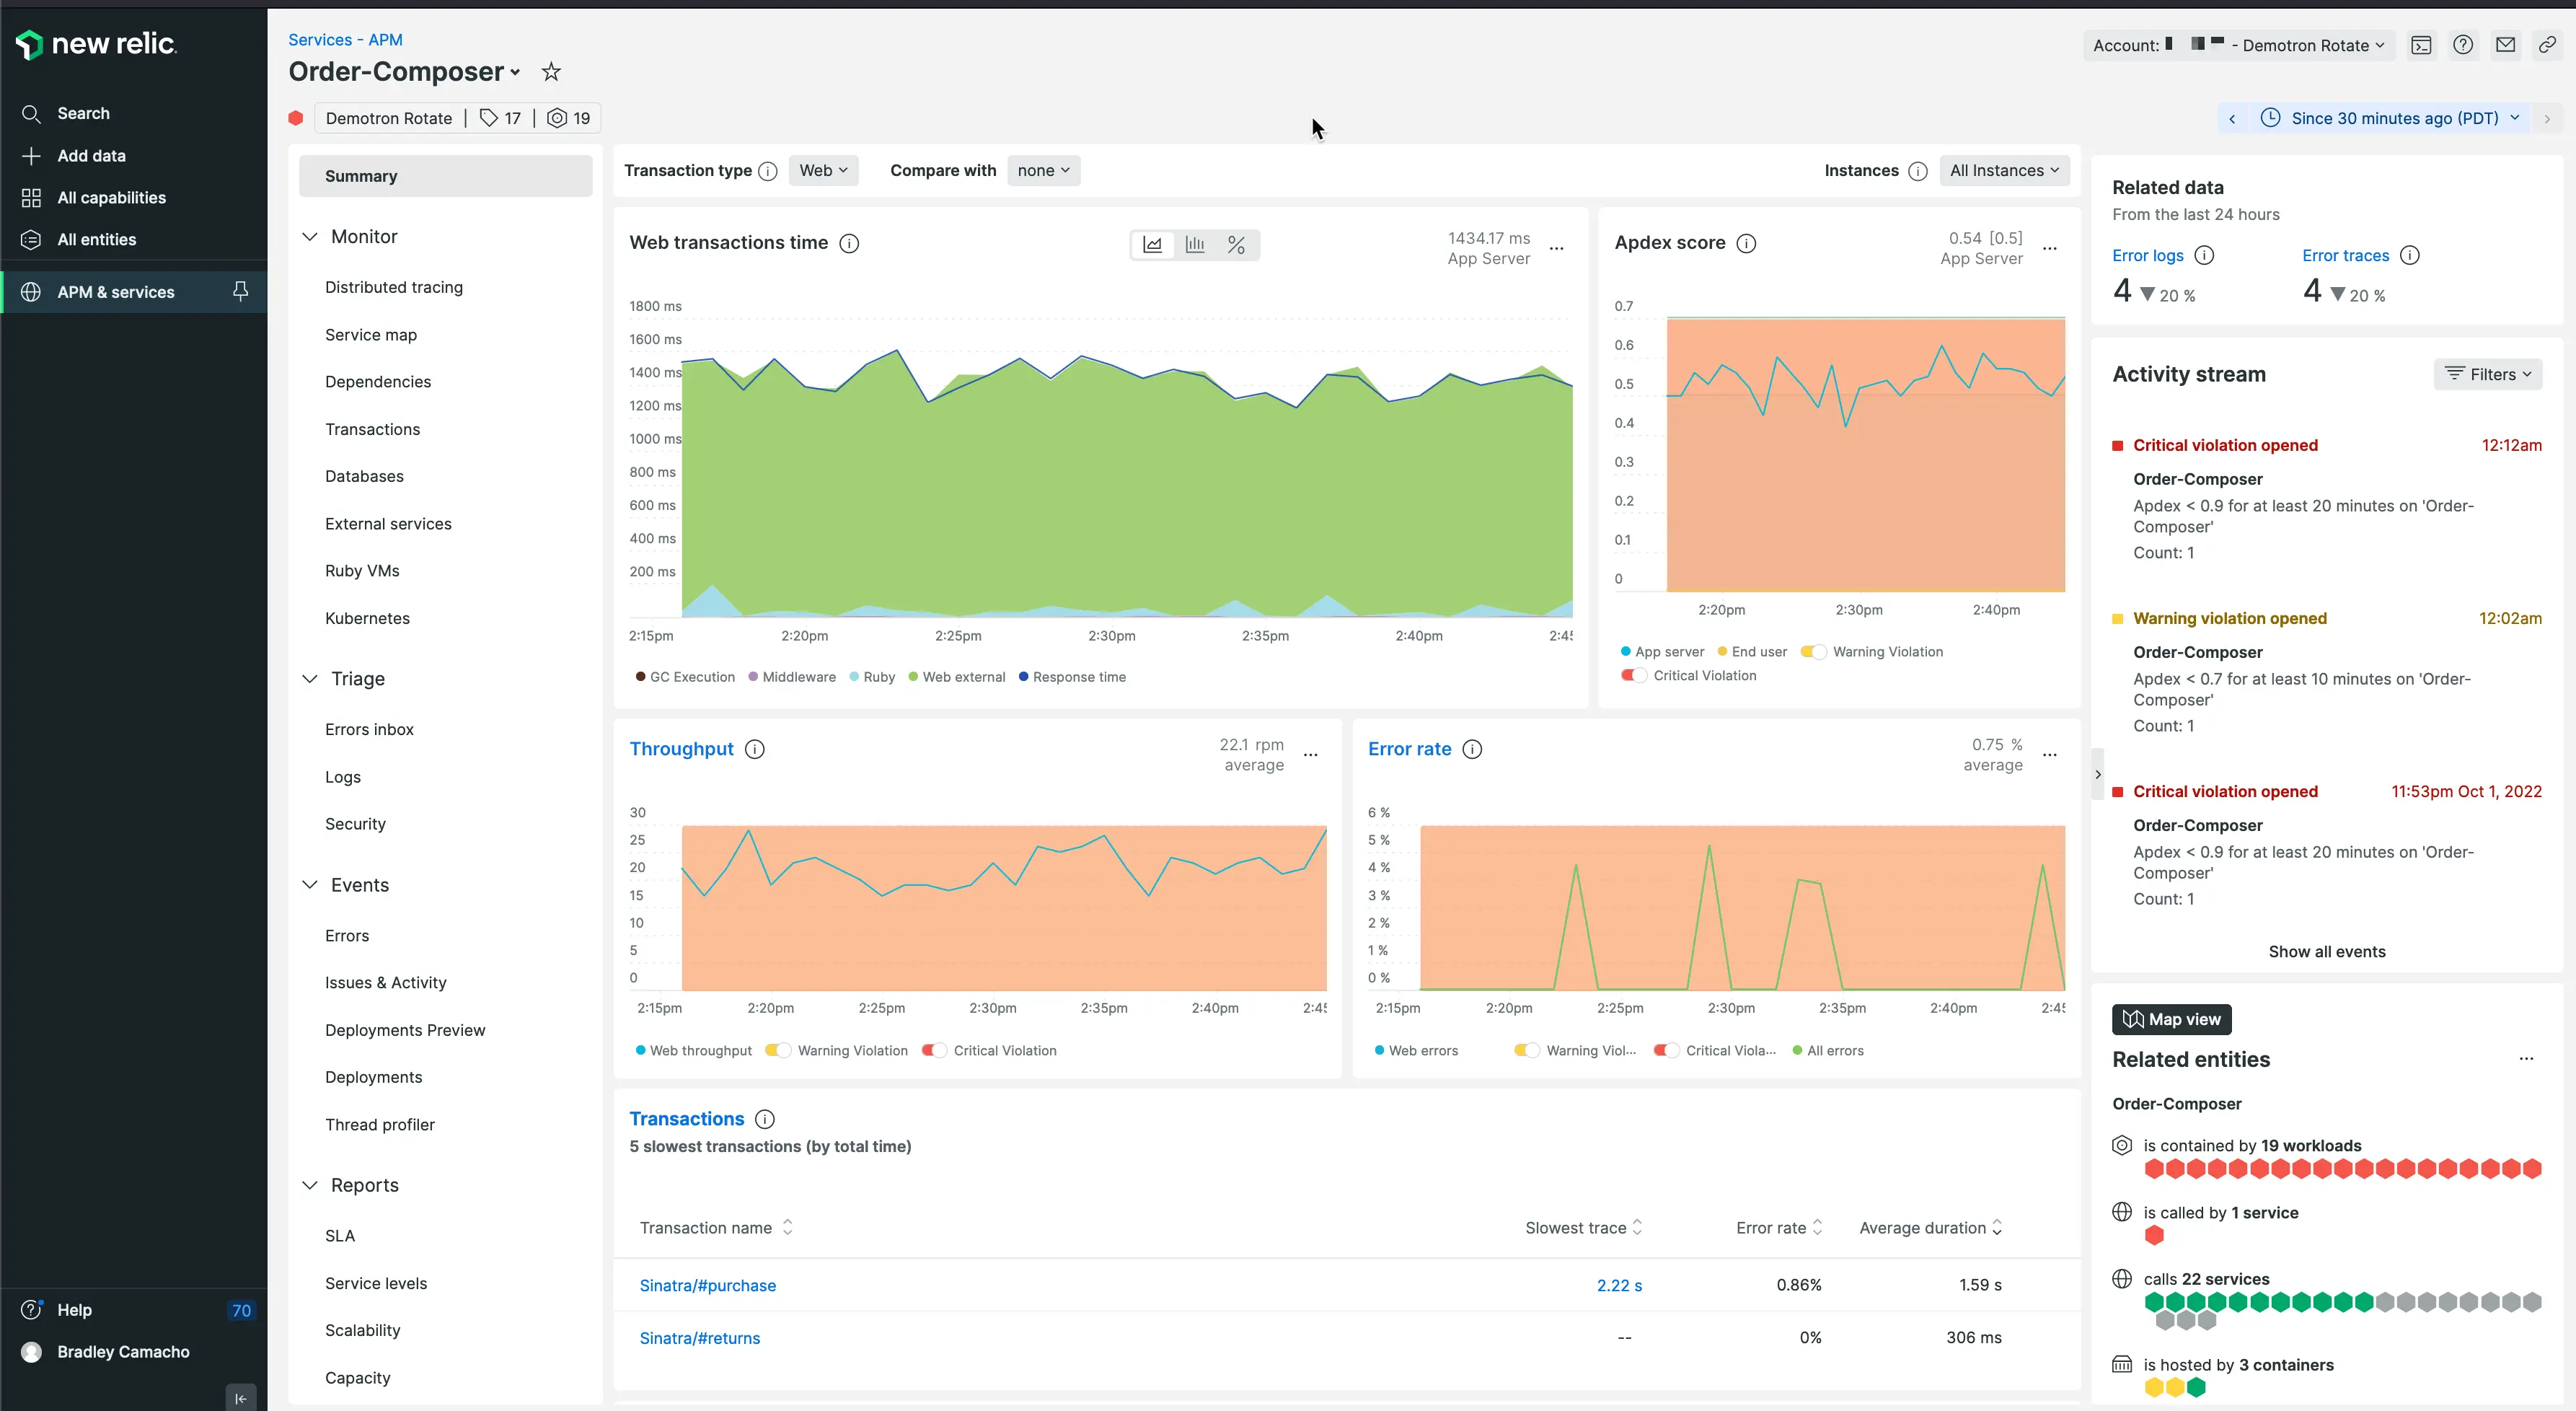
New Relic is one of the oldest companies in the observability domain. It is an observability tool enables you to visualize, analyze, and troubleshoot your software stack in a single platform. It also supports auto-instrumentation for eight popular programming languages.
New Relic provides a free forever version with 100 GB of free data ingest per month and $0.30 per extra GB. The pricing model is based on the amount of data ingested and the user seat.
Some of the key features of New Relic are:
- Connects application performance with infrastructure health for quick troubleshooting.
- Support for open-source tracing tools and standards like OpenTelemetry.
- Management of log data.
- Application security.
If you want to learn more about New Relic’s capabilities, check out our New Relic comparison guide with Splunk.
DataDog
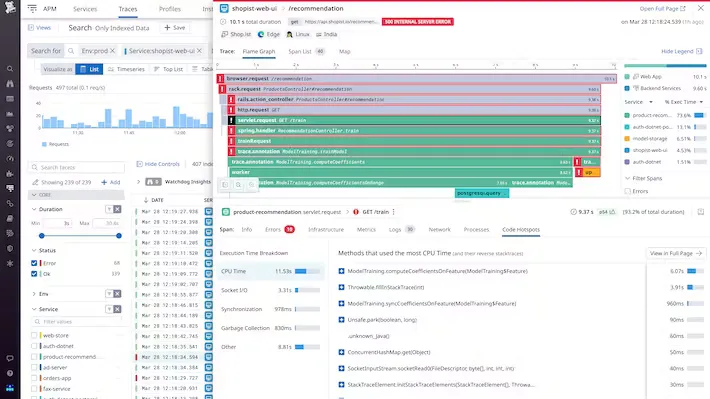
DataDog is a comprehensive monitoring and observability platform that gives insights into the performance of IT infrastructure, applications, and services.
Datadog provides a suite of products for application performance monitoring, such as infrastructure monitoring, log management, application performance monitoring, and security monitoring. The pricing depends on the product you opt for. For example, the APM solution provides end-to-end distributed tracing, starting at $31 per host per month if billed annually.
Some key features of Datadog are:
- Seamless correlation between logs, metrics, and traces.
- End-to-end application performance monitoring.
- Collection of all your traces.
- Code-level visibility for root-cause analysis.
If you want to learn more about Datadog’s capabilities, check out our Datadog comparison guide with Splunk.
Splunk
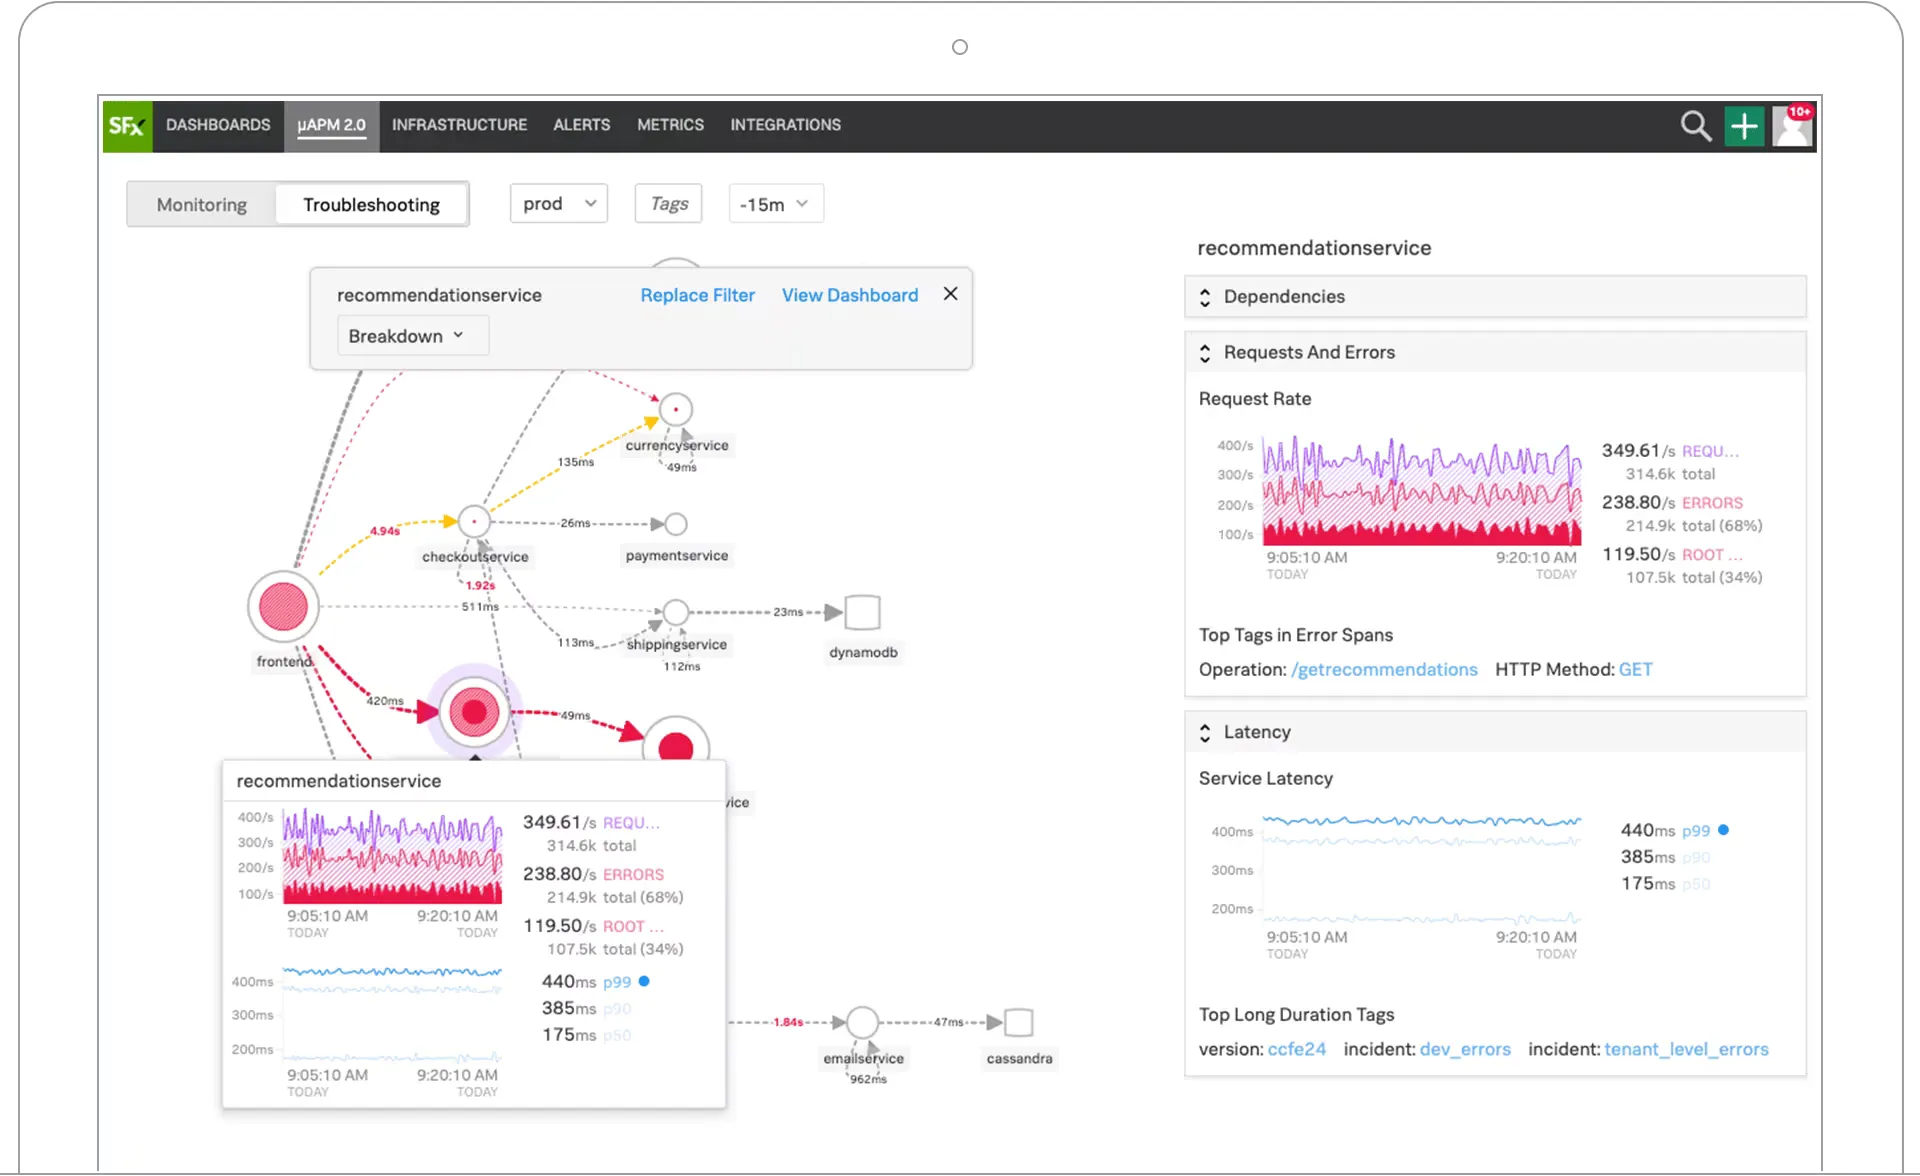
Splunk is a comprehensive observability tool that offers multiple products, including infrastructure monitoring, application performance monitoring, logs observer, real user monitoring, synthetic monitoring, and incident response management.
Splunk allows you to collect all traces instead of a sample set. It also provides service maps to offer DevOps teams visibility into interactions between different services, dependencies, and performance.
Pricing varies based on each product. For example, the Splunk APM solution starts at $55 ****per host per month if billed annually.
Some of the key features of Splunk are:
- Full-stack observability of applications and systems.
- Powerful search, analysis, and visualization capability.
- Correlation of logs with real-time metrics and traces
- AI-driven analytics.
If you want to learn more about Splunk’s capabilities, check out our Splunk comparison guide with Dynatrace.
IBM Instana
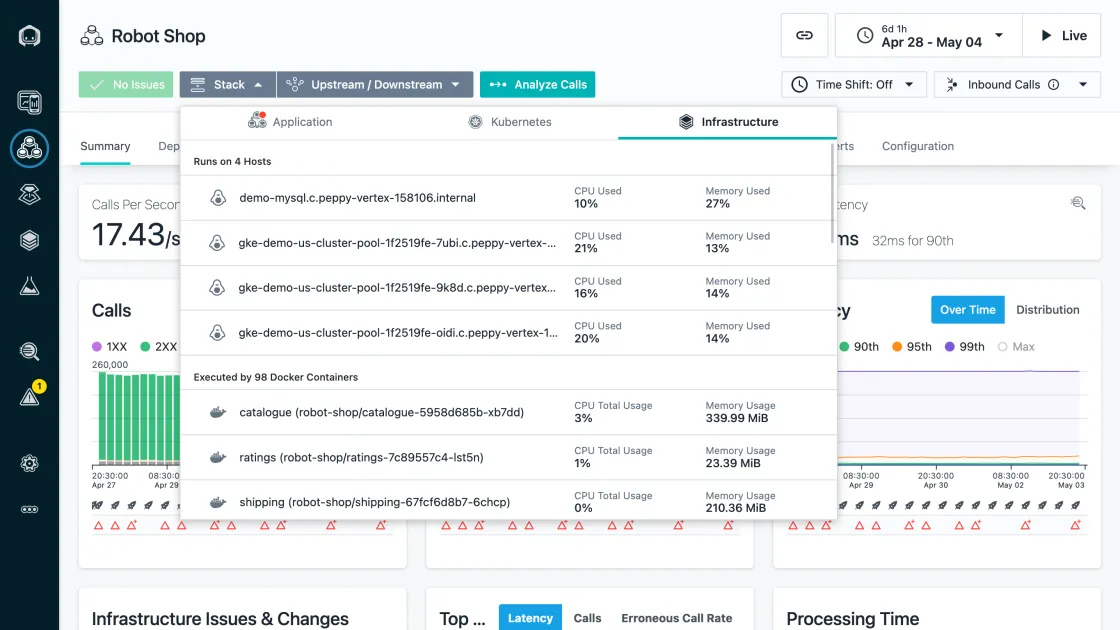
Instana is an enterprise observability and automated application monitoring tool. It uses an agent to discover and monitor components, and this agent needs to be installed on every host that is to be monitored. The agents deploy sensors crafted to capture data from different technologies. Sensors automatically collect configuration, changes, metrics, and events.
Instana charges $75 per host per month if billed annually. It also supports open standards like Prometheus, StatsD, OpenTracing, and OpenCensus.
Some of the key features of IBM Instana are:
- Automatic application discovery.
- Rich integrations.
- Automatic identification of root cause of incidents.
AppDynamics
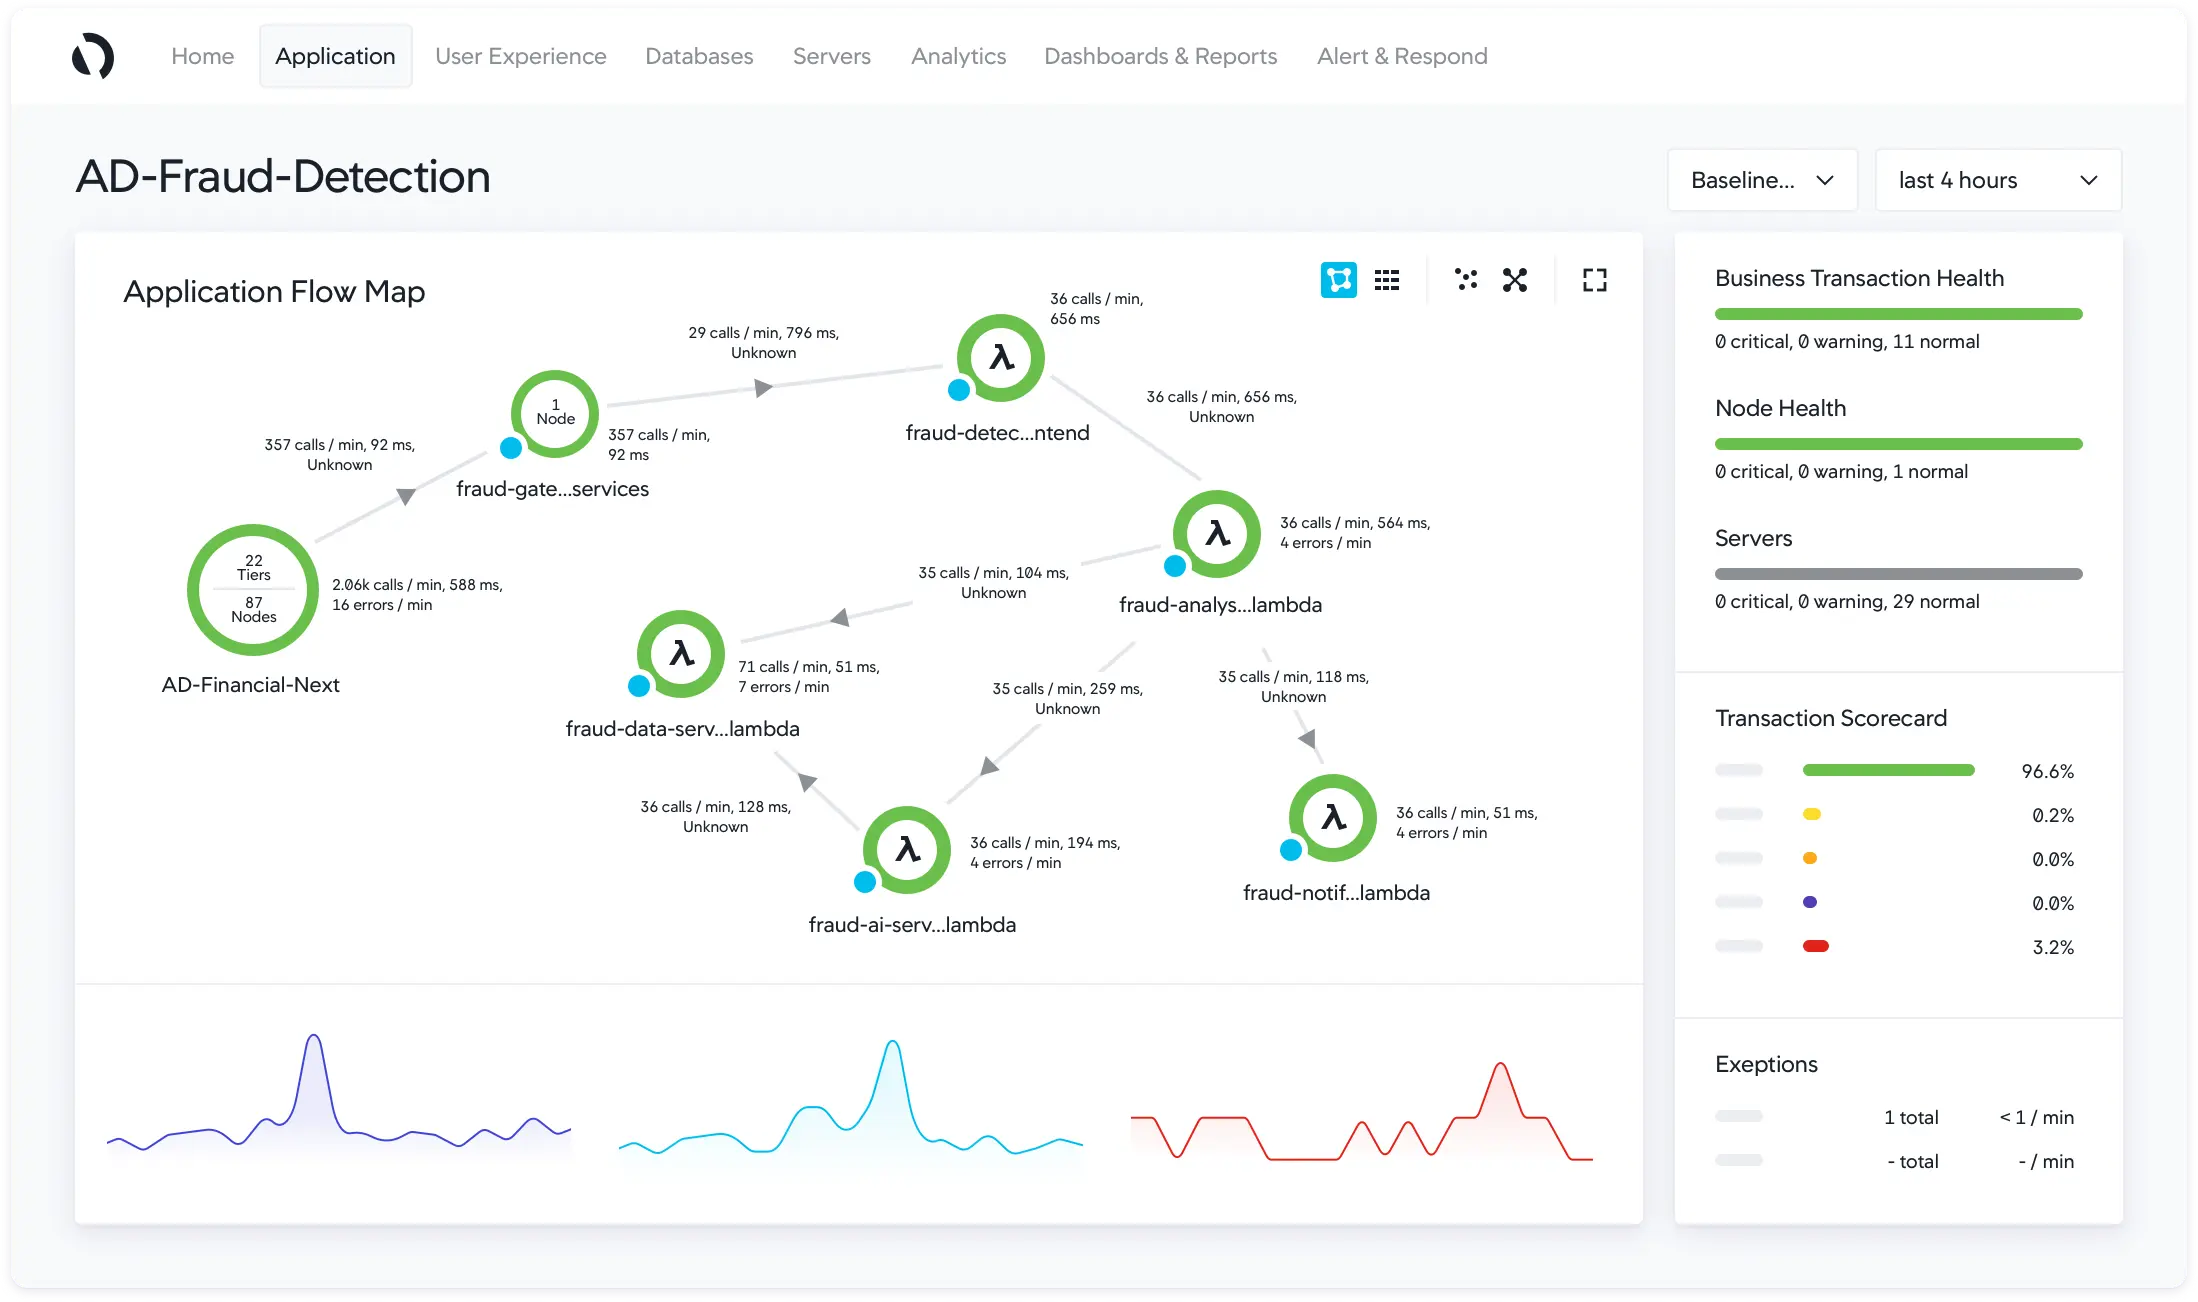
AppDynamics is an observability tool that can be used to monitor performance and analytics. It provides a detailed view of the performance and health of applications, cloud services, and IT infrastructure.
AppDynamics provides multi-cloud support, customizable dashboards for better understanding of user and application behavior, and offers visibility with context through AIOps-powered alerts that help organizations identify, prioritize, and resolve critical issues.
Some of the key features of AppDynamics are:
- Application Performance Management
- Business Transaction Monitoring
- Infrastructure monitoring
- Real-time alerting
- Root cause analysis
If you want to learn more about AppDynamics’s capabilities, check out our AppDynamics comparison guide with New Relic.
Elastic APM
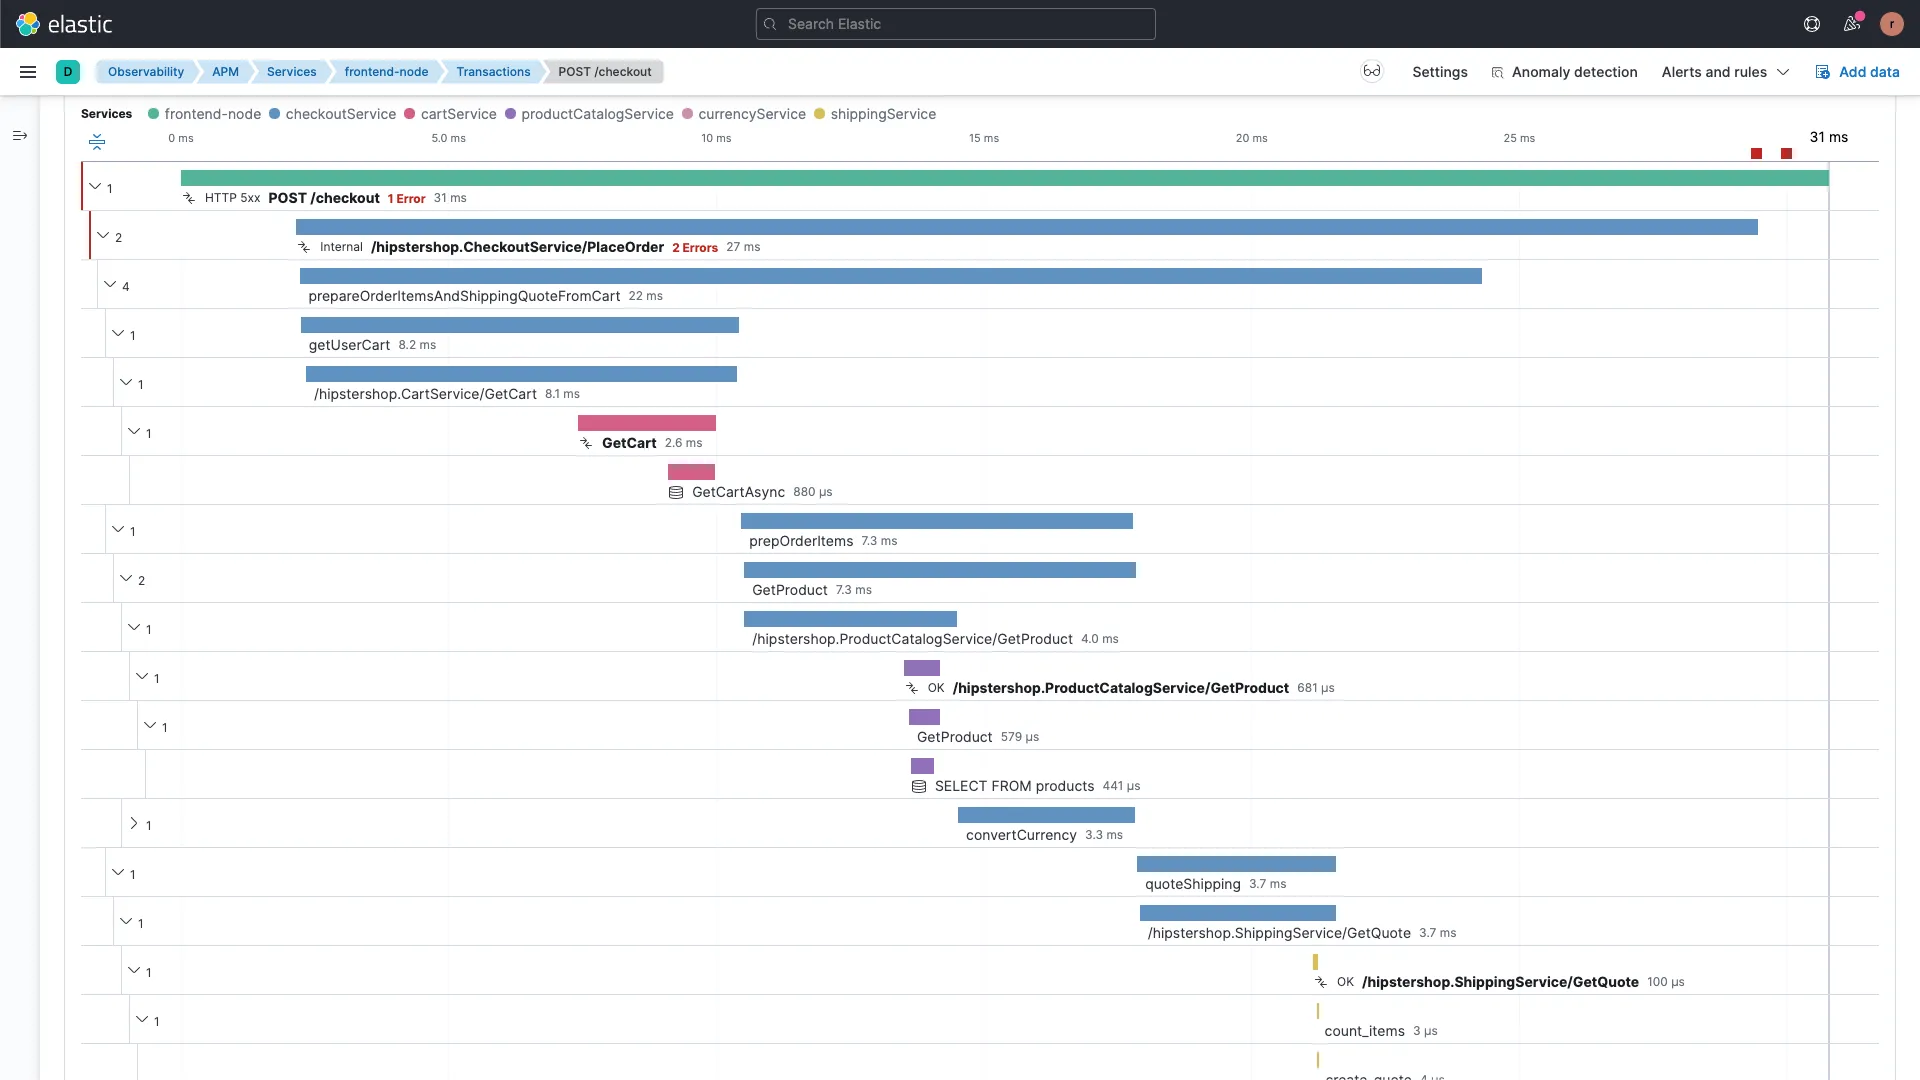
Elastic APM is an application performance monitoring system consisting of APM agents, APM servers, Elasticsearch, and Kibana, that enables you to gain deep visibility into your application's performance, identify bottlenecks, troubleshoot issues, and optimize performance over time.
The simplest way to utilize Elastic APM is by subscribing to the hosted Elasticsearch service on Elastic Cloud. Alternatively, you may choose to self-manage the Elastic stack, in which case you will need to determine how to run and configure the APM server.
Some of the key features of Elastic APM are:
- End-to-end distributed tracing.
- Real user monitoring.
- Error Tracking.
- Anomaly Detection with Machine Learning.
- Root cause analysis.
Zipkin
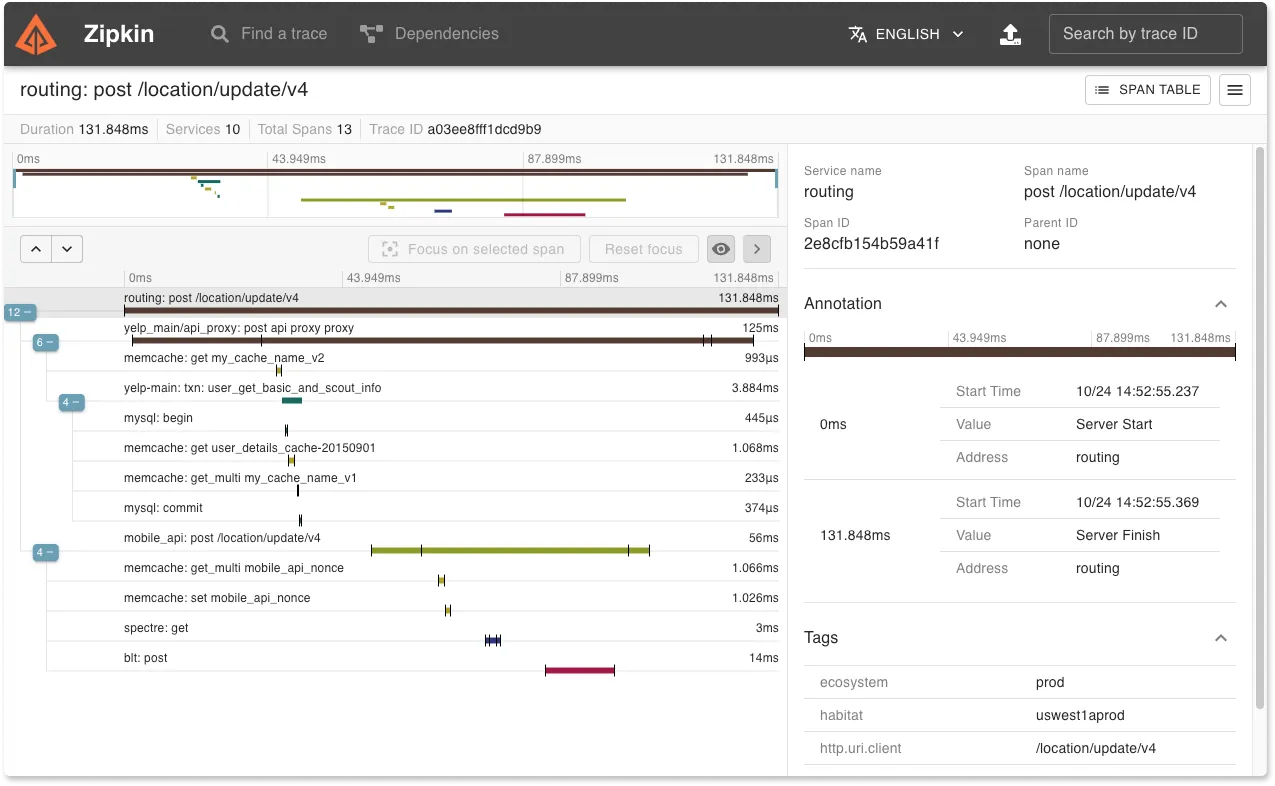
Zipkin is an open-source Application Performance Monitoring (APM) tool designed for distributed tracing. It captures detailed timing data across multiple services in a microservices architecture, providing insights into how requests flow through the system. This data is crucial for diagnosing latency issues and understanding the performance characteristics of web applications. Zipkin has a limited built-in UI and is best used with Grafana or Kibana from the ELK stack for better analytics and visualizations.
Some of the key features of Zipkin are:
- Distributed tracing across services.
- Error detection.
- Latency analysis.
How to choose the right observability tool?
For applications with microservices architecture, observability tools have become critical to meet operational challenges at scale. Without observability, it is almost impossible for your engineering teams to troubleshoot bugs and assess the performance of your applications. Hence choosing the right observability tool for your application is important. A few questions to ask yourself before selecting an observability tool are as follows:
- Are there any privacy laws that you need to take care of while sharing user's data with a third-party tool?
- Does the pricing suit your budget?
- How easy is it to get started with things like instrumentation?
- How much data do you want to retain?
- Does the tool provide seamless integration between metrics, logs, and traces?
An open-source tool like SigNoz, can be your best option in today's privacy-driven digital economy. Moreover, SigNoz uses open-source standards for instrumentation, and its code can be assessed for quality from its GitHub repo. Finally, as the tool is open-sourced, you get the support of the community while having access to out-of-box features like a SaaS vendor.
Getting started with SigNoz
SigNoz cloud is the easiest way to run SigNoz. Sign up for a free account and get 30 days of unlimited access to all features.

You can also install and self-host SigNoz yourself since it is open-source. With 16,000+ GitHub stars, open-source SigNoz is loved by developers. Find the instructions to self-host SigNoz.
___