Why is Distributed Tracing in Microservices needed?
Microservices architecture allows technology companies to build application services around business capabilities. It enables rapid development and also boosts developer productivity. But it also introduces complexity. Troubleshooting and operating an internet-scale application based on microservices is hard. And that’s where distributed tracing comes into the picture.

Traditional monolithic application architecture is easy to develop, deploy and monitor. But once the scale of the application grows, the architecture is not suited for rapid innovation. For example, continuous deployment is very challenging in the case of monolithic application architecture.
Microservices architecture overcomes the challenges faced with monolithic applications with the help of componentization. The components are designed to provide interfaces serving specific functionalities. They are kept small in size enabling smaller teams to own services. The components are also designed to evolve independently.
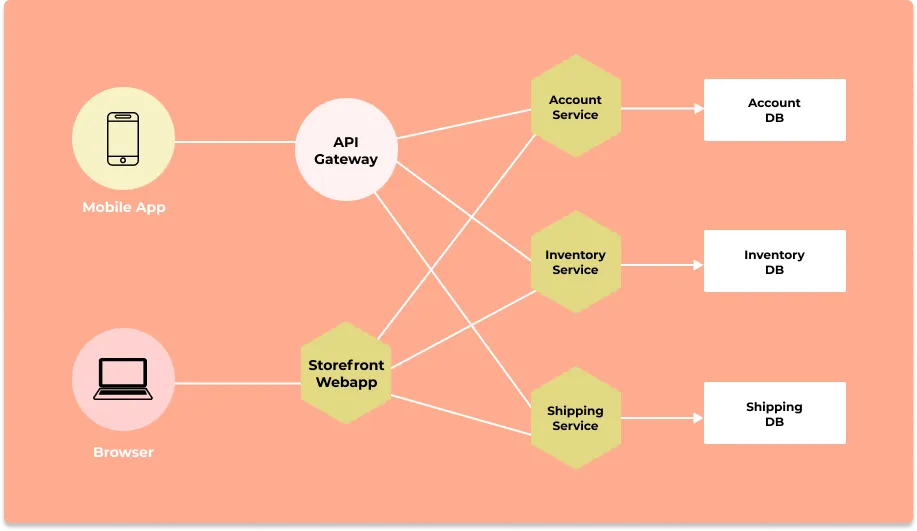
An application can now have thousands of microservices. Organizations require strict DevOps practices in provisioning, deployment, and monitoring to run such an application. Traditional monitoring tools struggle with distributed systems based on microservices architecture. Distributed tracing has become a critical technology that can monitor applications based on microservices.
Challenges in monitoring microservices-based applications
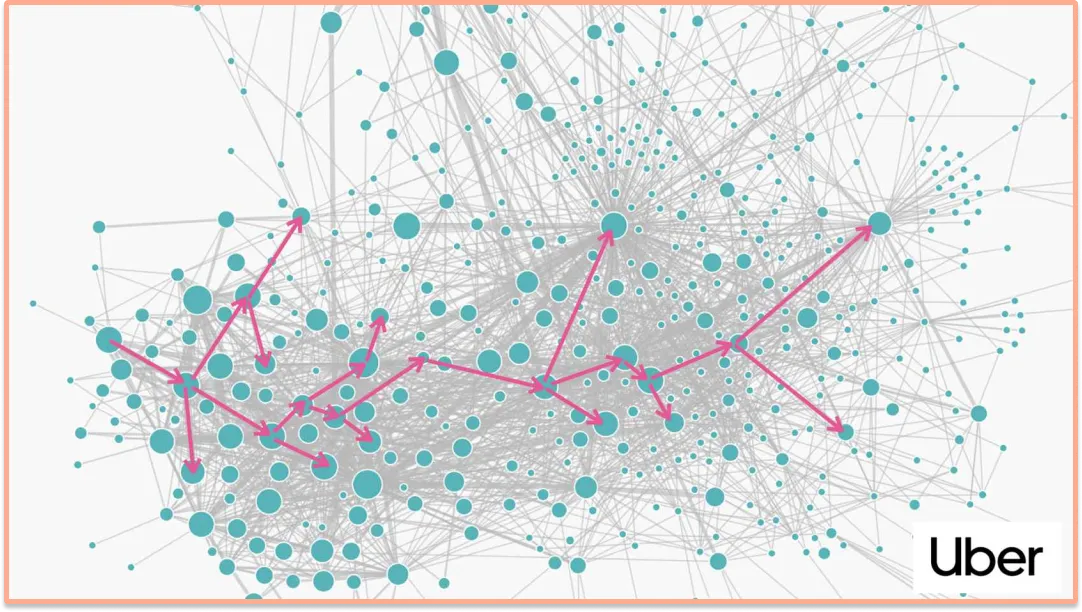
It is hard to monitor a microservices-based application because of its distributed and complex nature. The picture below shows the topology of microservices at Uber. The nodes in the diagram represent services, and the connecting lines represent the connection between the services. A single user click in such a system will spawn a request that can traverse hundreds of these nodes.
Traditional monitoring tools were not designed to monitor such distributed systems. At best, you can monitor a single application instance for aggregated metrics of that instance. These metrics are important, but they lack the context to troubleshoot microservices-based distributed systems.
For example, if you have to troubleshoot a slow user request in a microservices-based application, you won’t find the answers from a traditional monitoring tool. A complete picture of how a user request fared across all the nodes is necessary to debug microservices-based applications. And distributed tracing is the most promising technology to accomplish that.
What is Distributed Tracing?
Distributed tracing is a method to track user requests in their entirety as it travels across components of a distributed system like microservices-based applications.
A context ID is passed along the path of a user request as it traverses different nodes, protocols, and networks. It enables the reconstruction of the entire user request in a sequential flow that shows exactly how a system processed a request.
Read our complete guide on Distributed Tracing
The two most important data points collected with distributed tracing are:
- time taken to traverse each component in a distributed system
- the sequential flow of the request from its start to the end
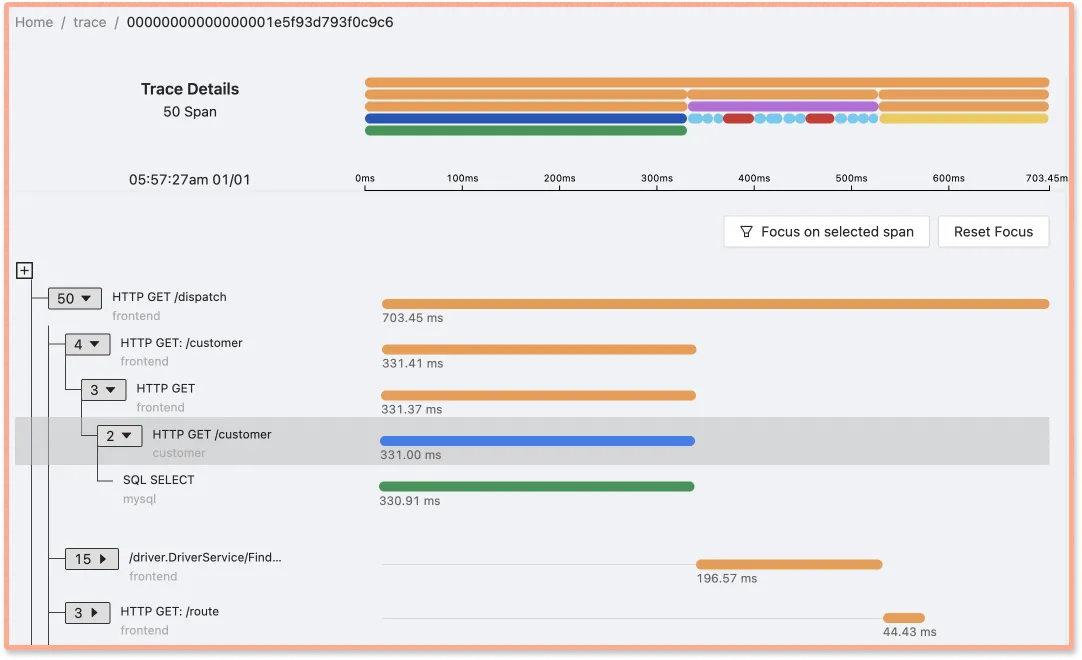
The tracing data can then be visualized in various formats like Flamegraphs and Gantt charts to show the journey of the entire user request.
Why is Distributed Tracing the right choice to monitor microservices?
For a microservices-based application, we want to know the story of how different components interact together to process user requests. Engineering teams often own single services, and there is no central overview to know how the system is performing as a whole.
When a request is triggered, we want to know what happened to the request across all touchpoints. Having this knowledge enables engineering teams to understand their systems better and troubleshoot faster in case of performance issues.
Distributed tracing provides answers to various questions during a debugging process:
- Which services did a user request go through?
- How much time it took each service to process the request?
- How are the services connected?
- What was the failure point in case of a request failure?
Tracing data can also be aggregated to answer questions at the macro level. Aggregated tracing data can tell us things like error rate or 99th percentile latency of specific components in a microservices-based application.
Getting started with Distributed Tracing in microservices
In order to get started with distributed tracing, you need to enable your application to generate tracing data. Thankfully, there are solutions available in the market for it. SaaS vendors provide agents that can be integrated with your application code to generate tracing data.
But organizations are now moving towards an open-source standard called OpenTelemetry for generating tracing data. It is a set of APIs, SDKs, tooling and integrations that are designed for the creation and management of telemetry data such as traces, metrics, and logs. OpenTelemetry client libraries can be used to generate tracing data.
You can then select a backend of your choice to store and visualize the tracing data for analysis. SigNoz is an open-source APM that is built natively on OpenTelemetry.
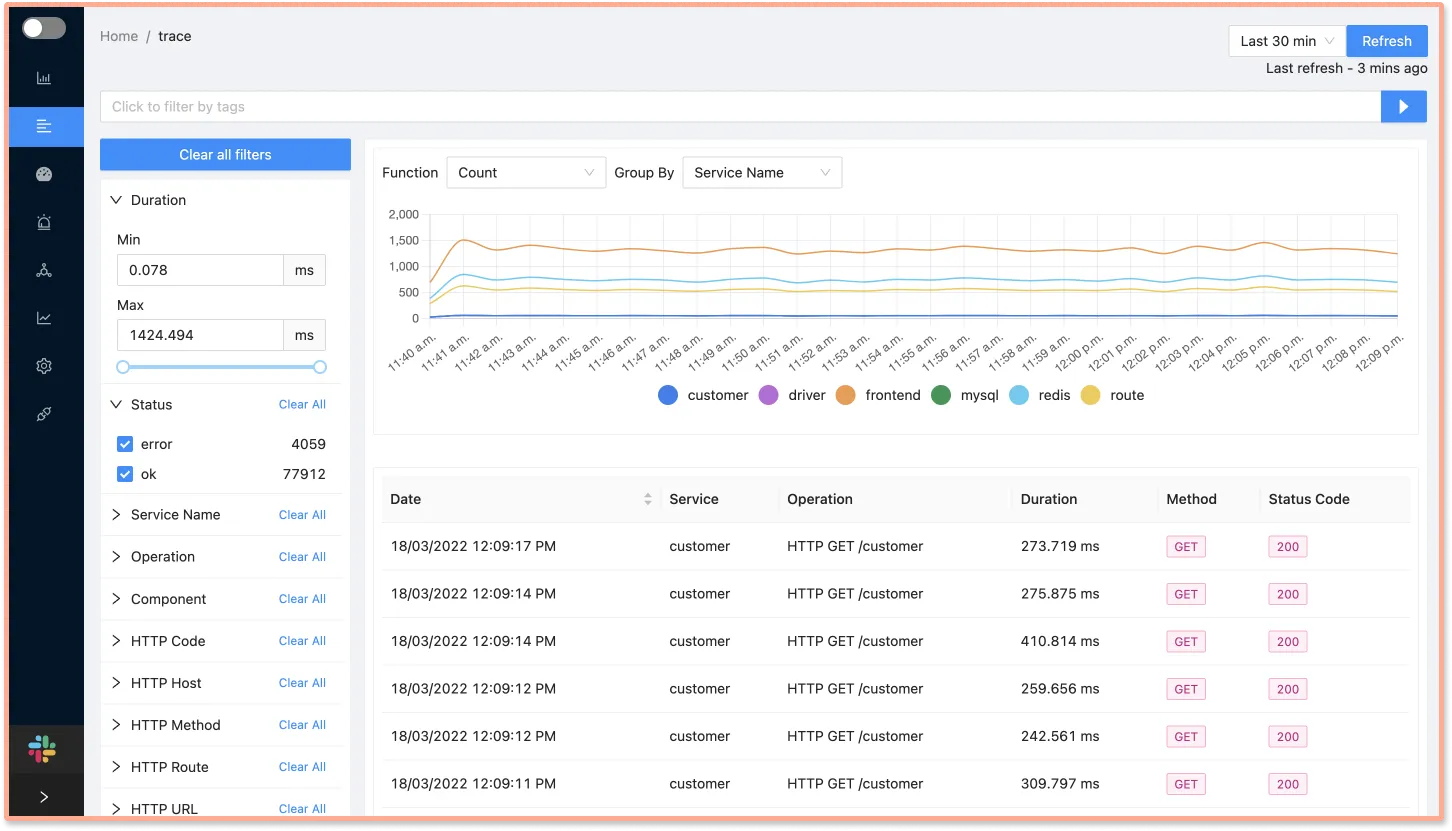
SigNoz comes with out of box visualizations for your tracing data. The Traces dashboard of SigNoz provides you with powerful filters that can be used to analyze your tracing data.
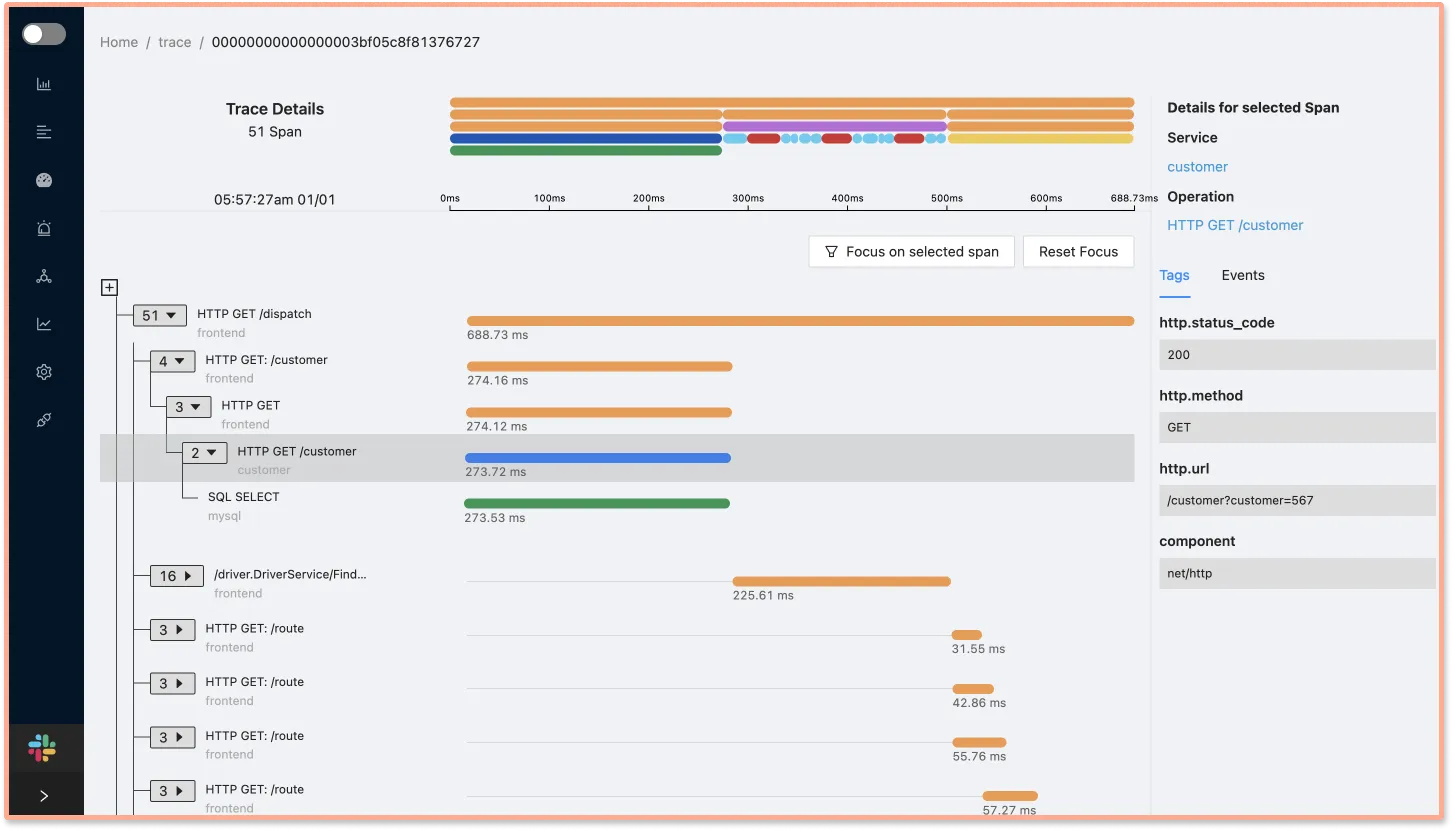
You can also view a selected span(a single logical unit of work that is a part of trace) as part of the entire request with the help of Flamegraphs and Gantt charts.
SigNoz Cloud is the easiest way to run SigNoz. Sign up for a free account and get 30 days of unlimited access to all features.

You can also install and self-host SigNoz yourself since it is open-source. With 24,000+ GitHub stars, open-source SigNoz is loved by developers. Find the instructions to self-host SigNoz.
Further Reading
Examples of Distributed Tracing
More articles on Distributed Tracing
