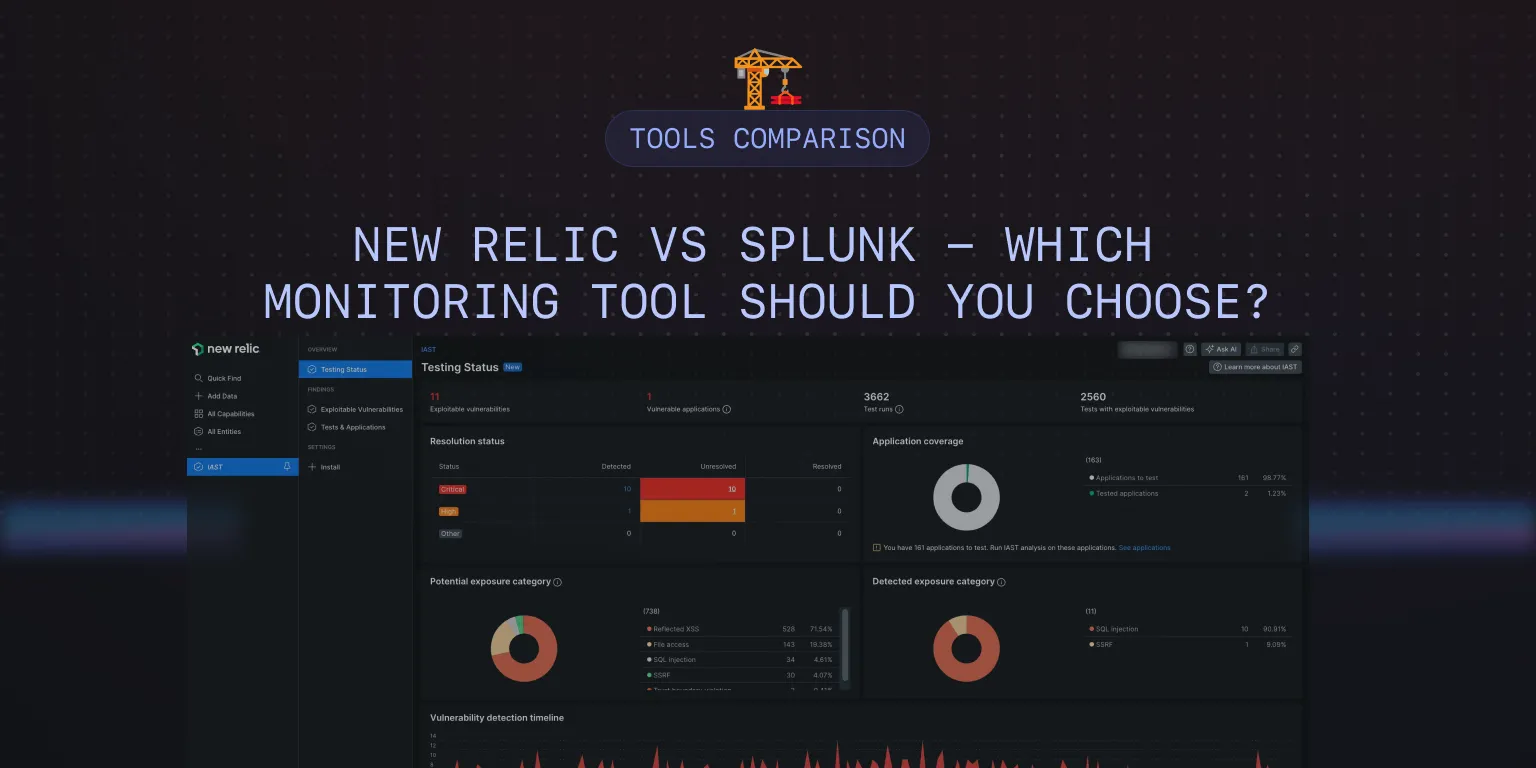
New Relic vs Splunk - Which Monitoring Tool should you choose? [2026 Guide]
New Relic and Splunk are popular monitoring and observability tools that provide a wide range of products with similar features. In this post, I have compared New Relic and Splunk on important features like APM, log management, search capability, application security, etc.
New Relic vs Splunk: Overview
New Relic and Splunk are monitoring and observability tools with similar features. However, both tools differ in terms of their application and use cases.
New Relic is easier to get started and is cheaper to use compared to Splunk. Splunk on the other hand has more strength in log management and application security.
Here’s a quick overview of the overall platform features and functionality of New Relic and Splunk.
| Feature | New Relic | Splunk |
|---|---|---|
| Getting Started | ✅ | 🟡 |
| APM | ✅ | ✅ |
| Log Management | ✅ | ✅ ✅ |
| Cloud SIEM | ❌ | ✅ |
| Application Security | 🟡 | ✅ |
| Infrastructure Monitoring | ✅ | ✅ |
| OpenTelemetry Support | 🟡 | ✅ |
| Real User Monitoring | ✅ | ✅ |
| Synthetic Monitoring | ✅ | ✅ |
| UI/UX | ✅ | 🟡 |
| Free Tier | ✅ (Free forever) | 🟡 (15 days free trial) |
✅ - Available
❌ - Not Available
🟡 - Limited
Getting Started: New Relic
New Relic is widely known for its user-friendly interface and ease of use. I found the onboarding process for New Relic to be seamless. It was very easy to set up and start monitoring my application.
Splunk, on the other hand, has a steep learning curve. As someone with no prior experience using Splunk, it was difficult to understand and navigate the platform. As someone who is used to monitoring and observability platforms using a unified interface, it was surprising to find out that Splunk had different platforms for different use cases.
Overall, New Relic is easier to get started with.
APM: New Relic
I instrumented a sample Python application and sent data to both New Relic and Splunk for APM. The steps taken in New Relic were straightforward and simpler compared to Splunk. New Relic required the installation of the New Relic agent as well as the agent specific to my application, which, in my case, was the Python agent. Splunk had more setup steps.
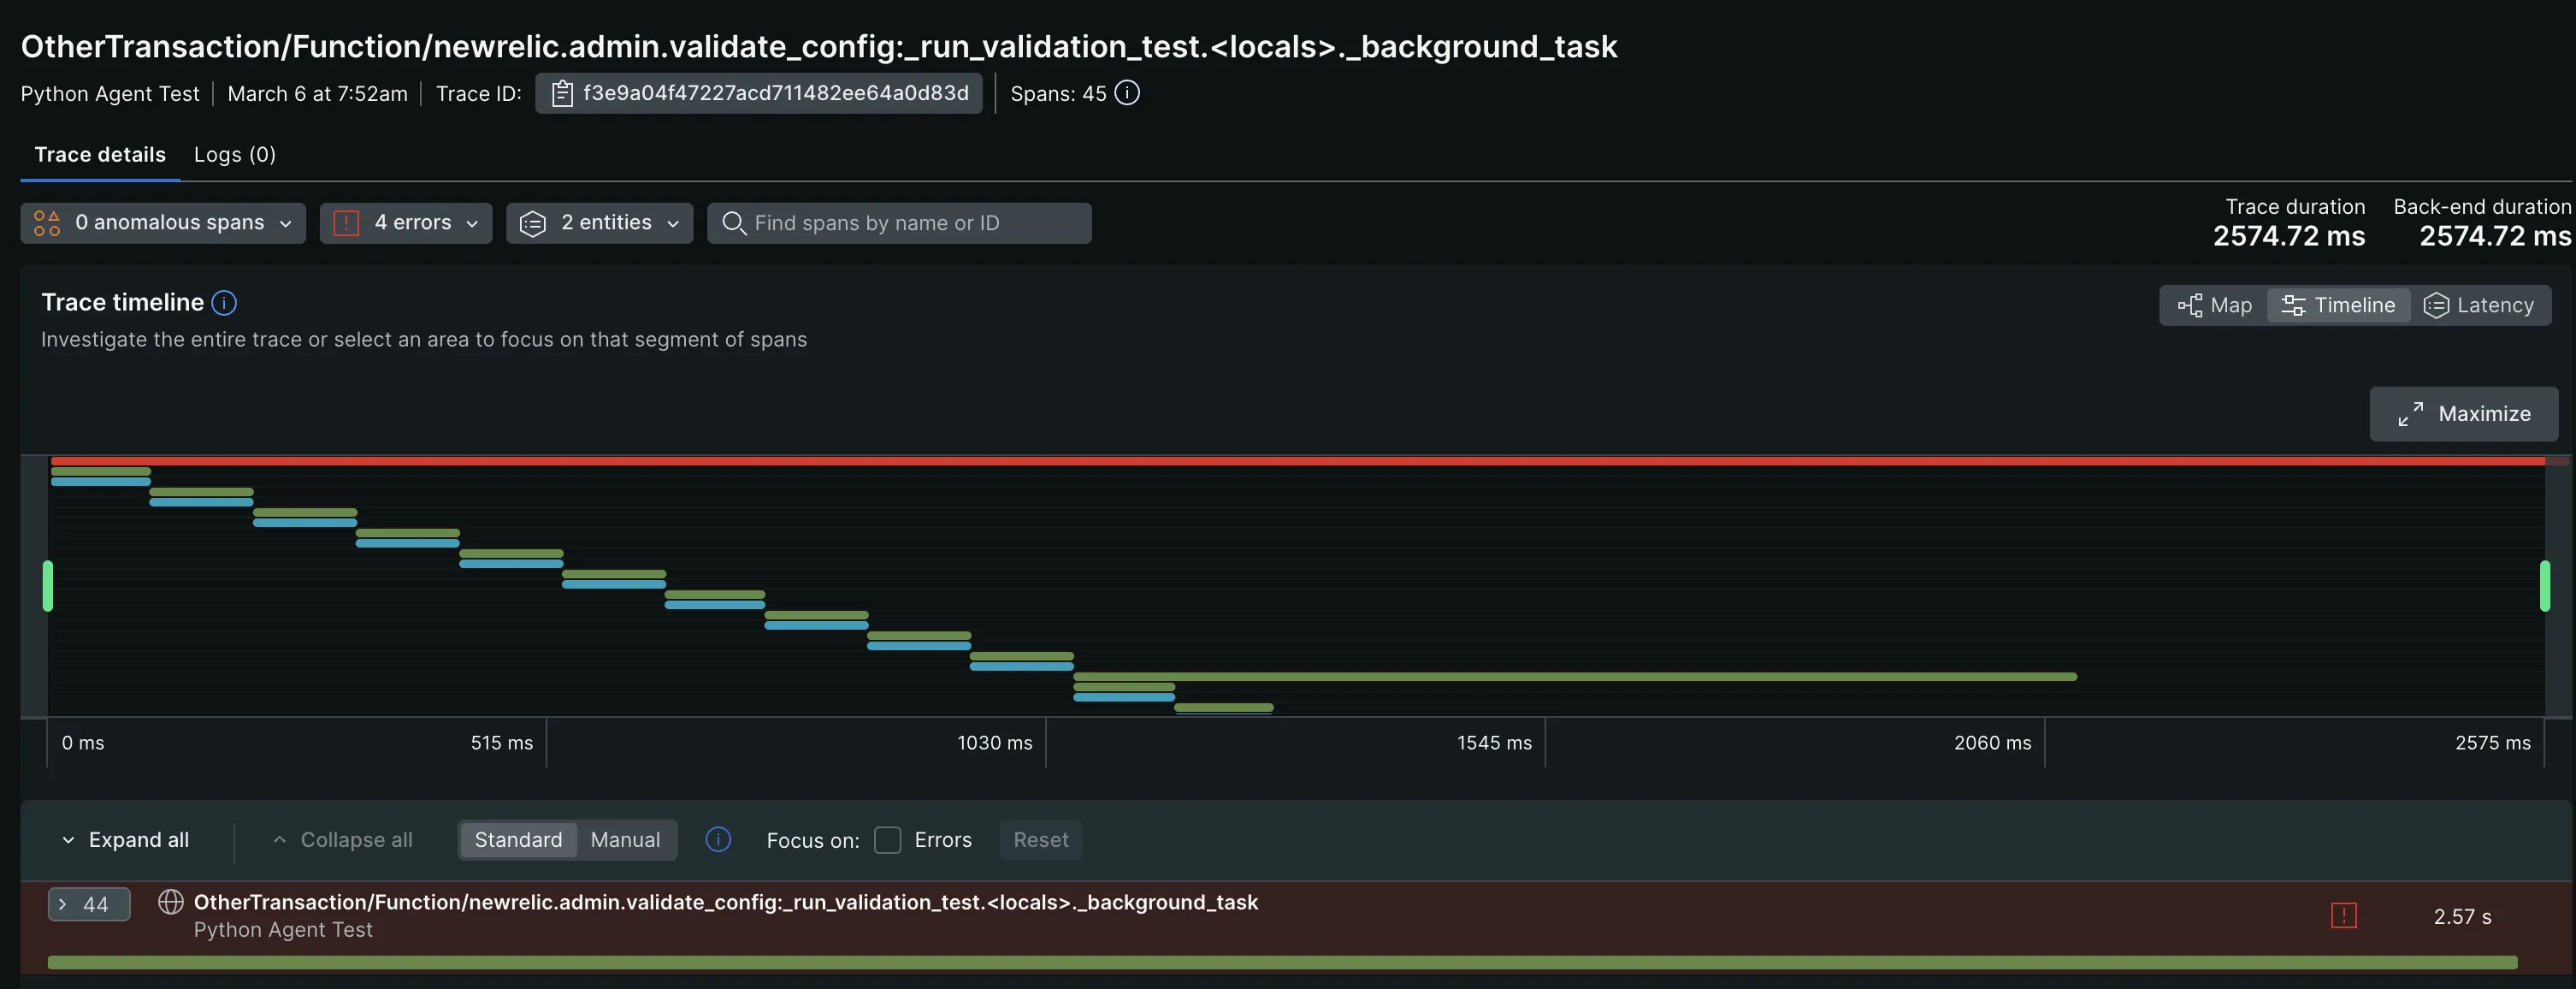
With New Relic, you can effectively monitor your application's trace data through its pre-built dashboards. Within the Distributed Tracing page, you can filter traces by Trace Groups, Root entry span, Root entity, and Errors. This allowed me to focus more on specific traces with failures and latency issues.
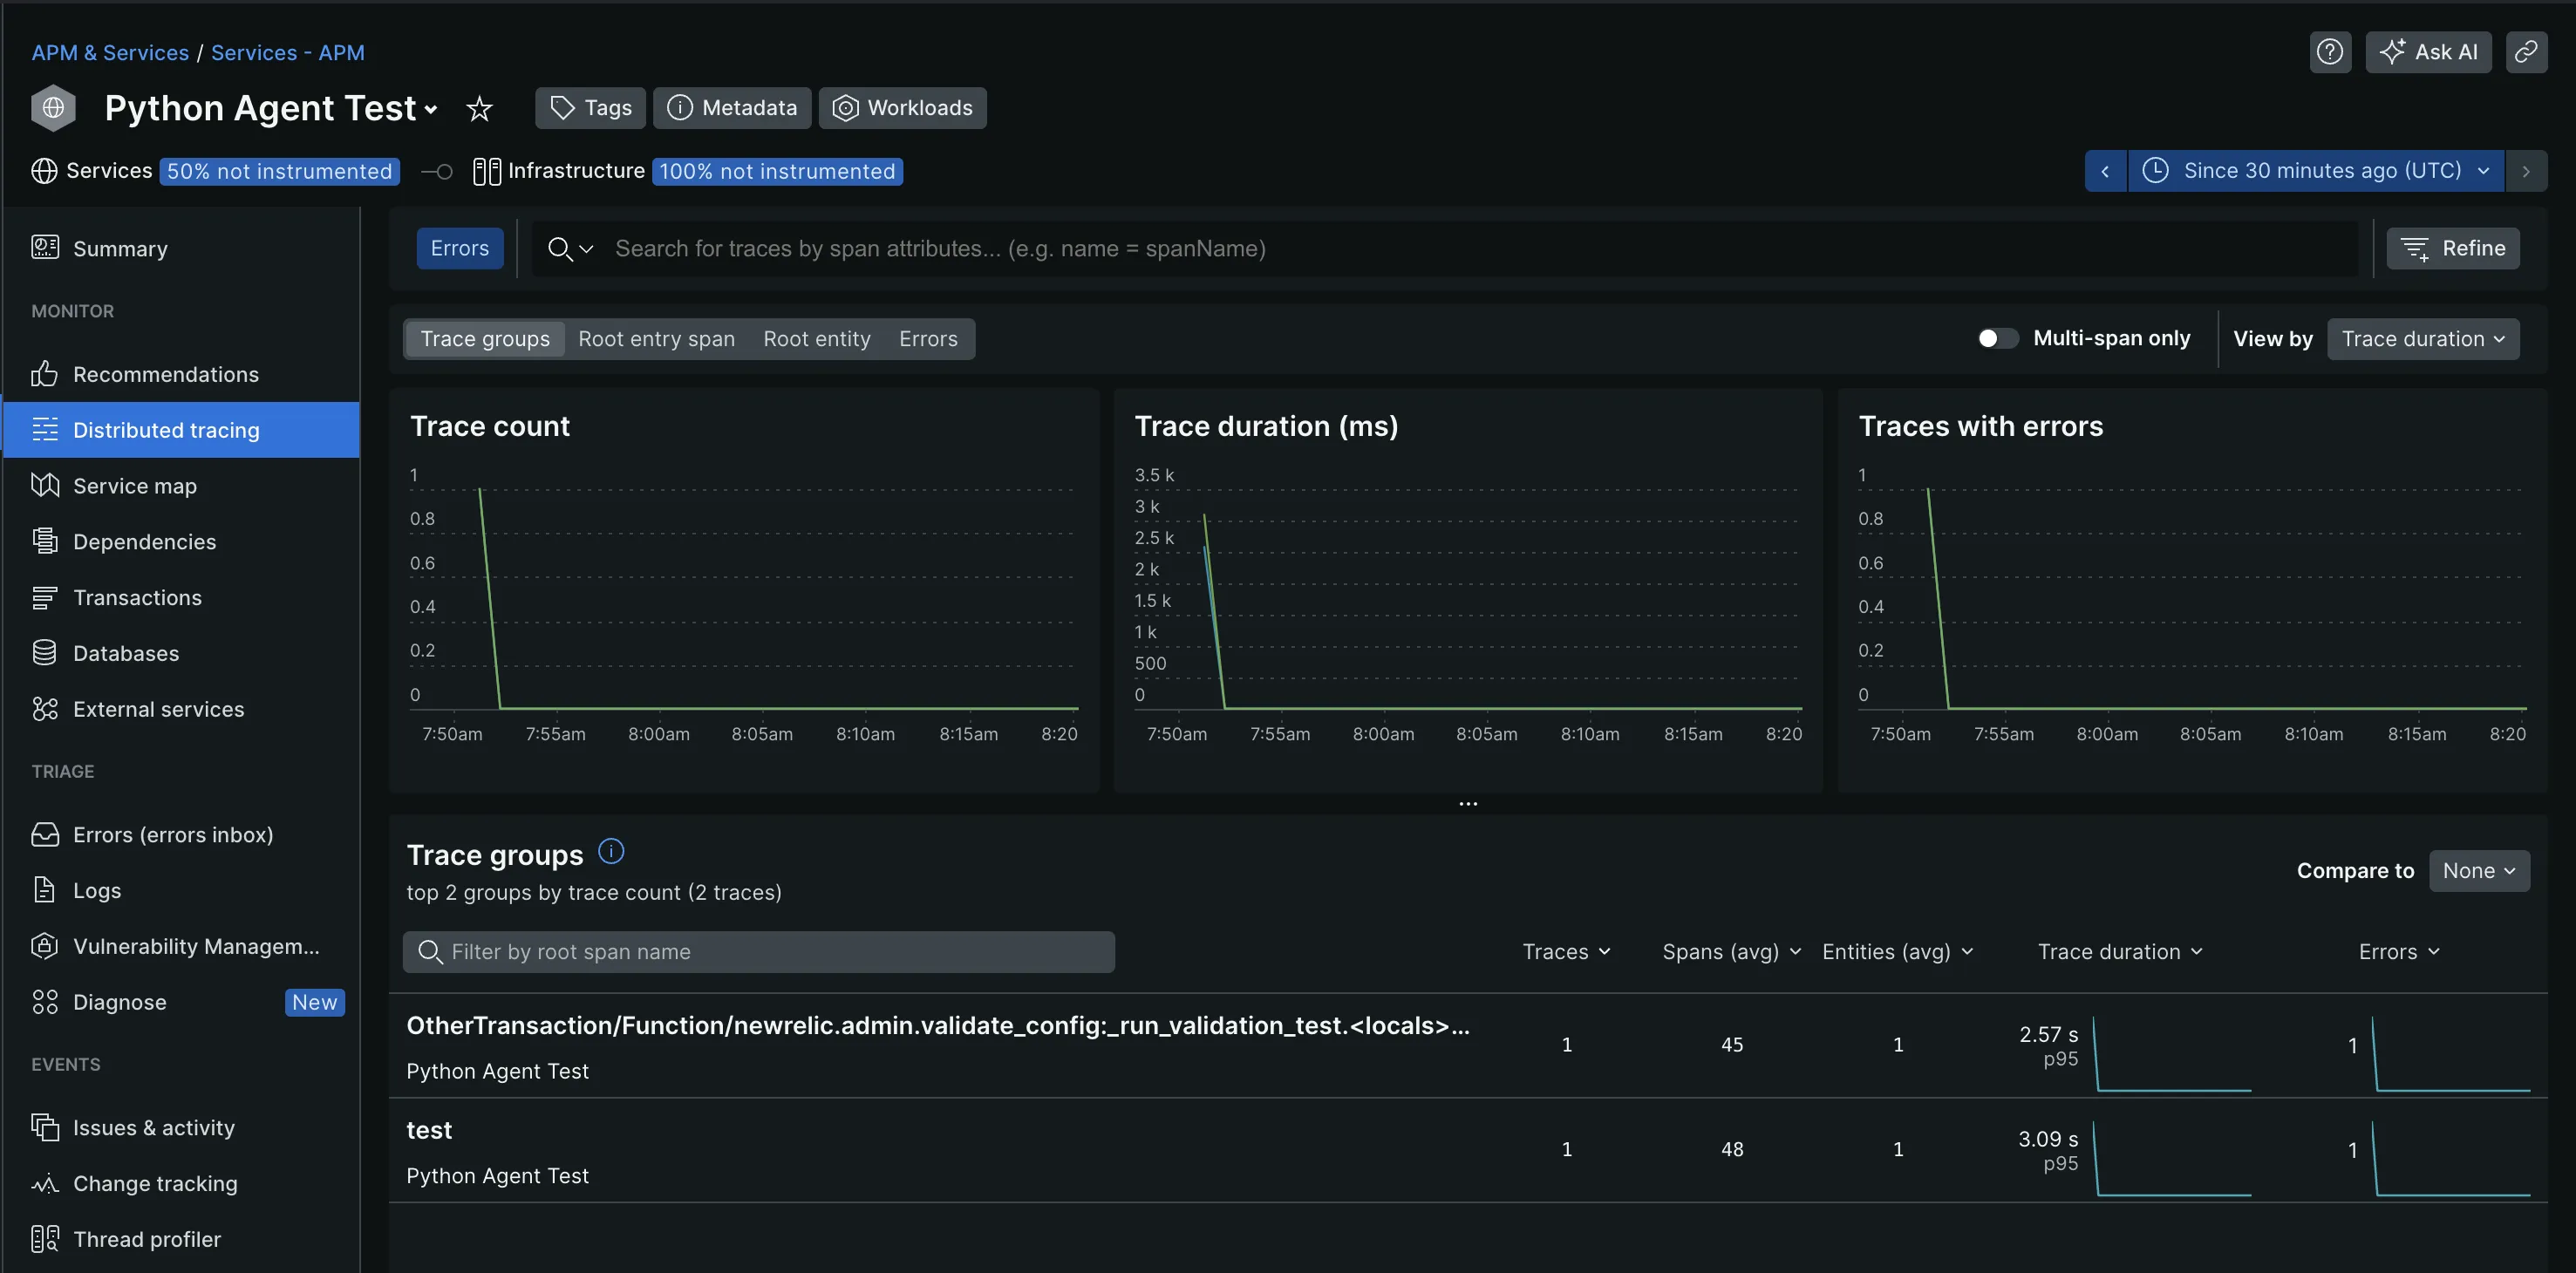
The visualization options it offers helped me better understand and analyze my trace data. This includes flame graphs, service maps, tables, and charts. The flamegraphs, most especially, provided end-to-end visibility into the time spent on each function or service call, which I find useful for troubleshooting.
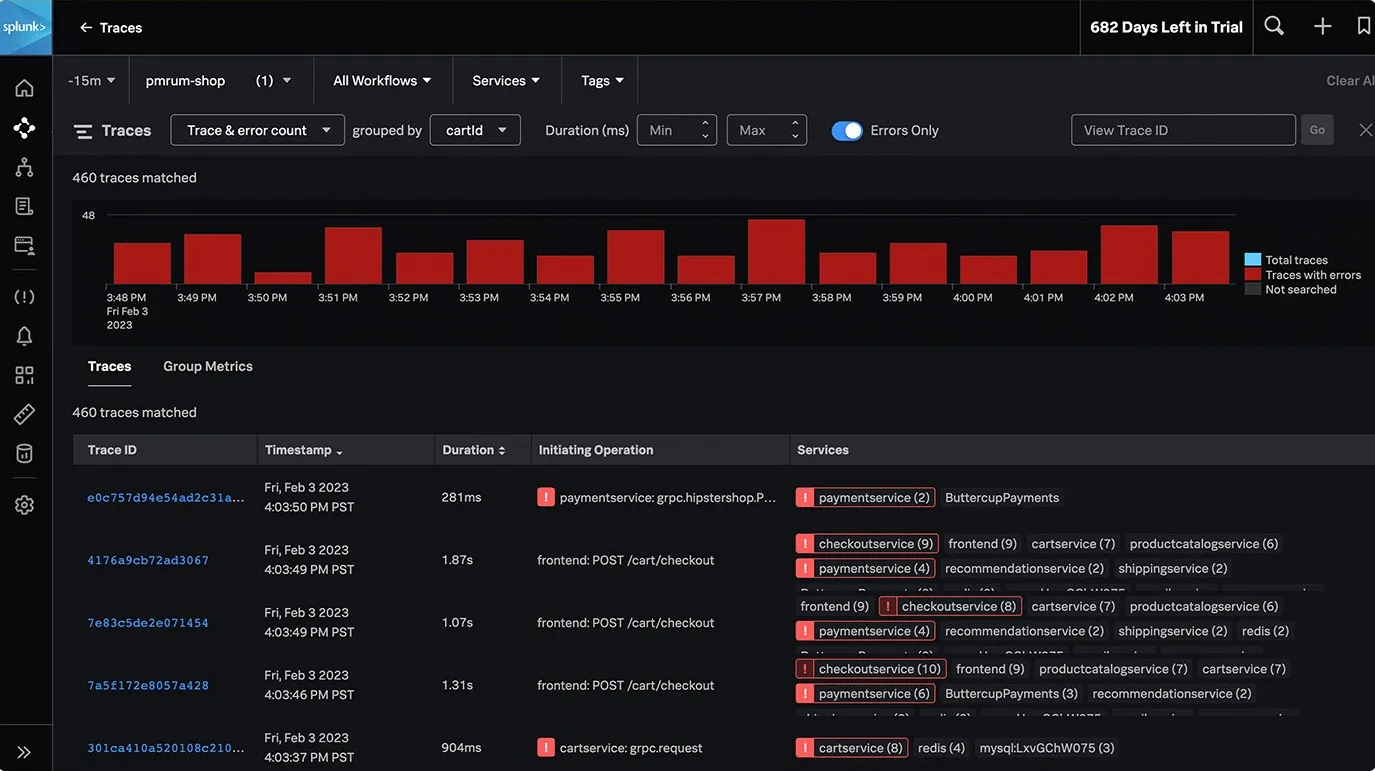
With Splunk, you can efficiently collect and analyze all your trace data to get insights into your application’s performance. Additionally, it supports tag-based grouping of traces and provides visualization options such as service maps and flame graphs for better analysis.
Splunk employs AI-driven directed troubleshooting to quickly identify and highlight the root causes of issues within microservices, even in high-volume environments, offering a centralized view of trends in latency and errors, ranked by error rate or latency.
Some other Splunk APM features include:
- Infinite cardinality exploration: To understand how different factors impact your application’s performance.
- Real-time streaming analytics: Detects and alerts on customer issues within seconds.
- Full-stack observability: Access to Splunk logs and events for better troubleshooting and root-cause analysis.
For a seamless APM experience, New Relic’s APM feature is a good option. If you need more options and customizations, use Splunk.
Log Management: Splunk
New Relic doesn’t require an extra setup for log management. It automatically collected the logs from my application and displayed them in the Logs tab. These logs can be queried through the use of Lucene, an open-source search library, and the New Relic Query Language (NRQL). If you're familiar with SQL queries, using NRQL should be straightforward due to its SQL-like syntax.
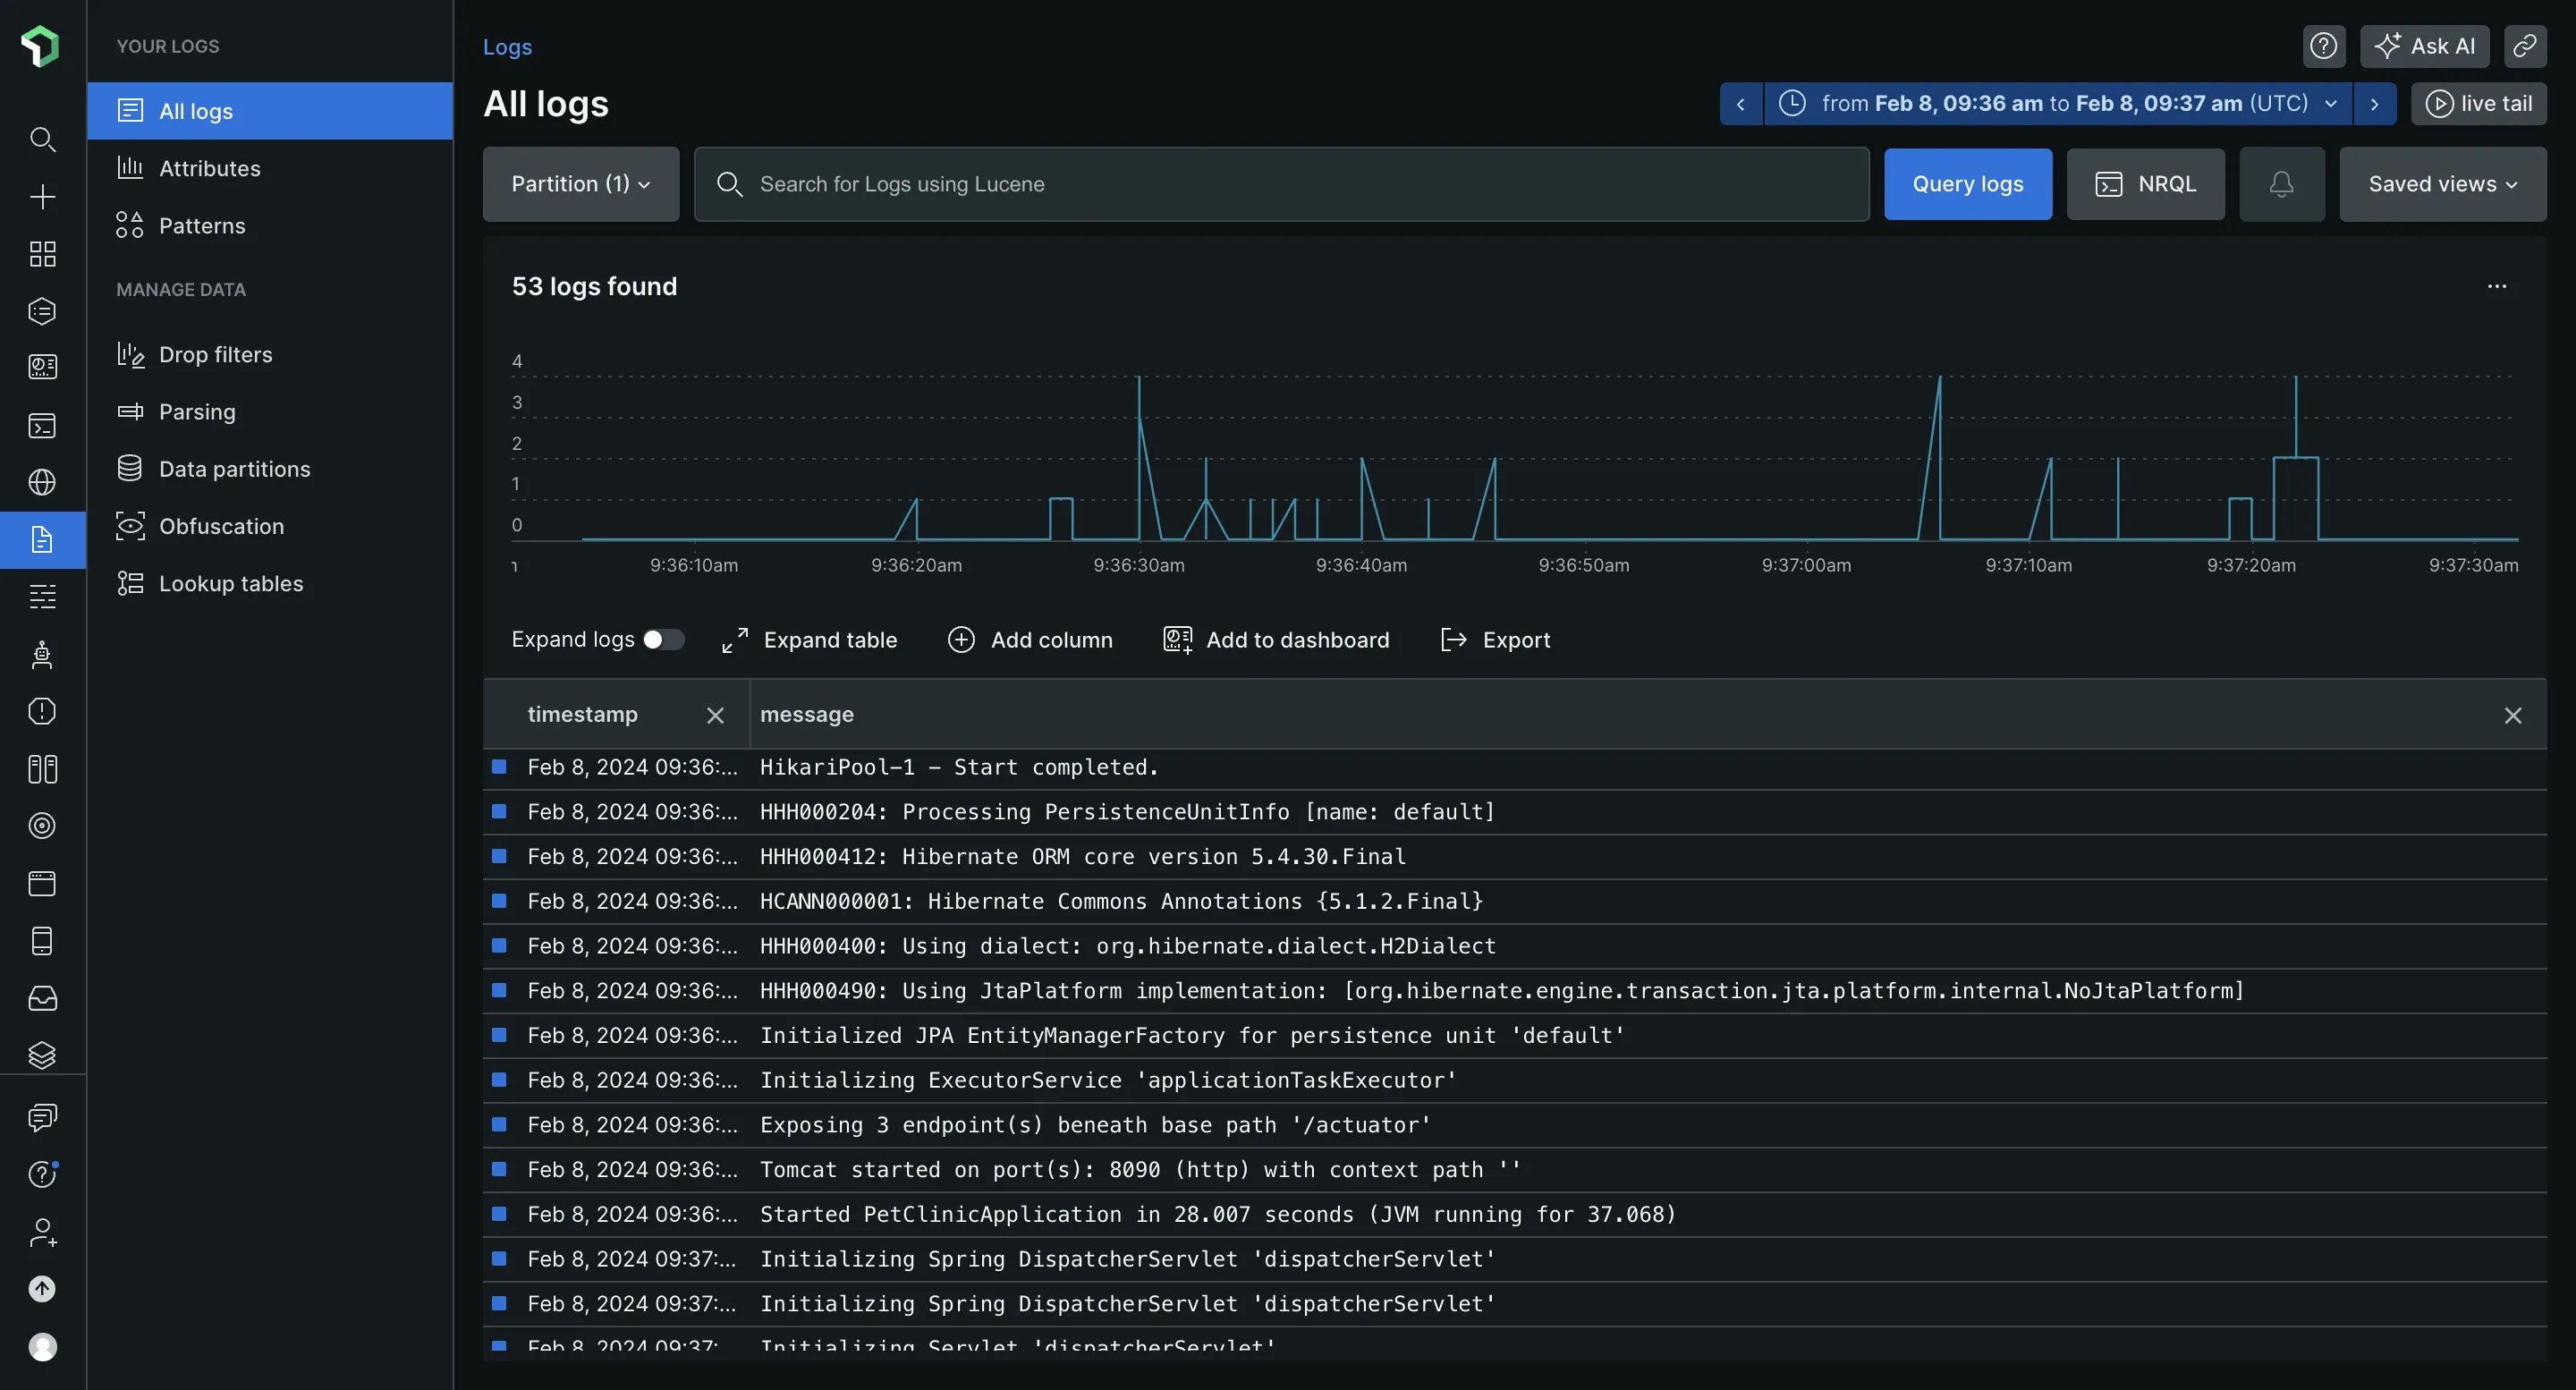
Some other log management features New Relic provides include:
- Attributes: Provides additional context and information about the event being logged, such as error codes or user IDs.
- Patterns: Groups log events based on common characteristics or sequences of attributes.
- Obfuscation: Hides sensitive information in your logs.
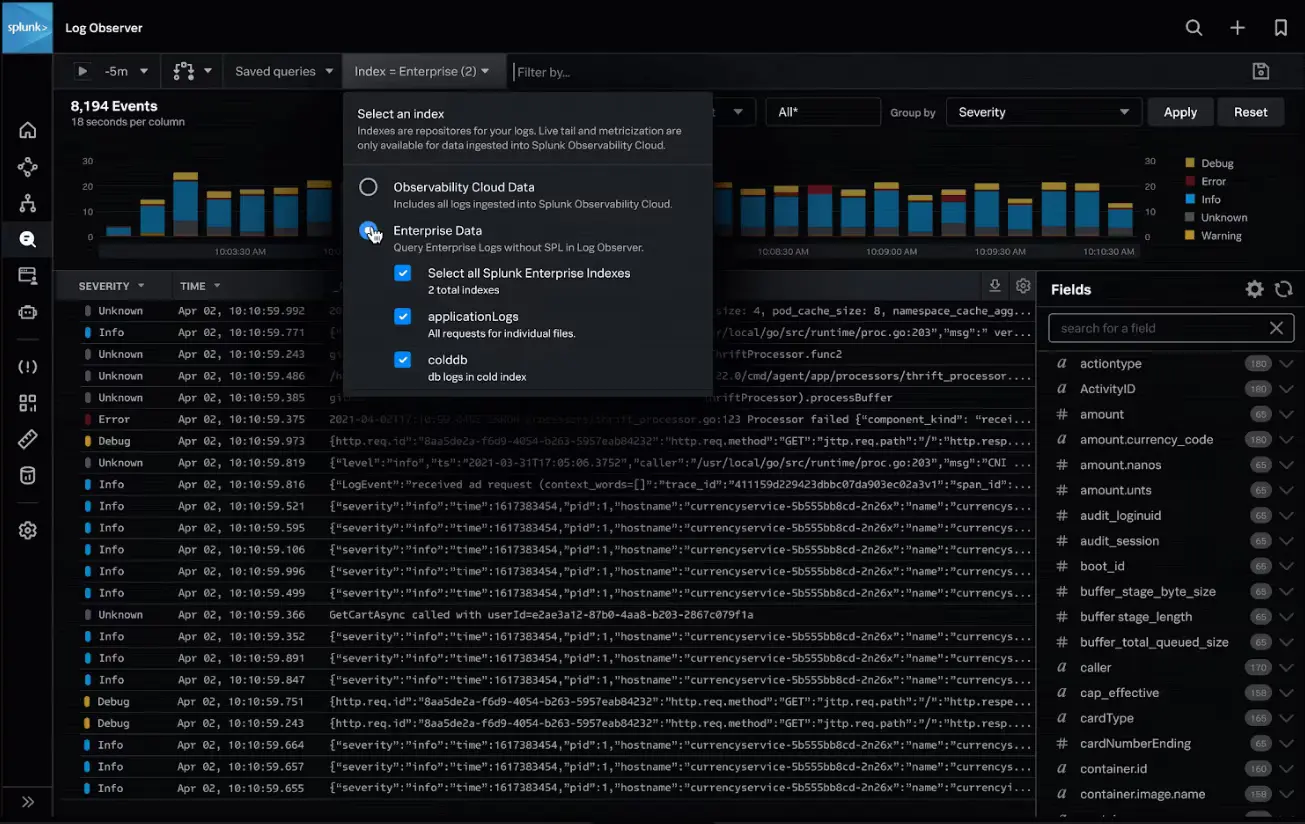
Splunk is well known for its log management capabilities, it can manage large volumes of data. Splunk aggregates data from various Splunk platforms into the Splunk Observability Cloud, where it is centrally managed. It didn’t automatically ingest my data like New Relic, I had to set this up manually.
Log management in Splunk can be carried out using the Log Observer Connect feature. This allows for the correlation of logs with real-time metrics and traces, and log-based analysis to better understand patterns in your data.
For enterprise-level log management capabilities, Splunk is an excellent choice. If you have less log management requirements, you can consider New Relic.
Migrate from New Relic - Save up to 67% on your New Relic bill
Tired of New Relic's user-based pricing? Even for teams of 10-15 devs, New Relic's pricing for user seats can be a significant portion of your monthly bill.
Application Security: Splunk
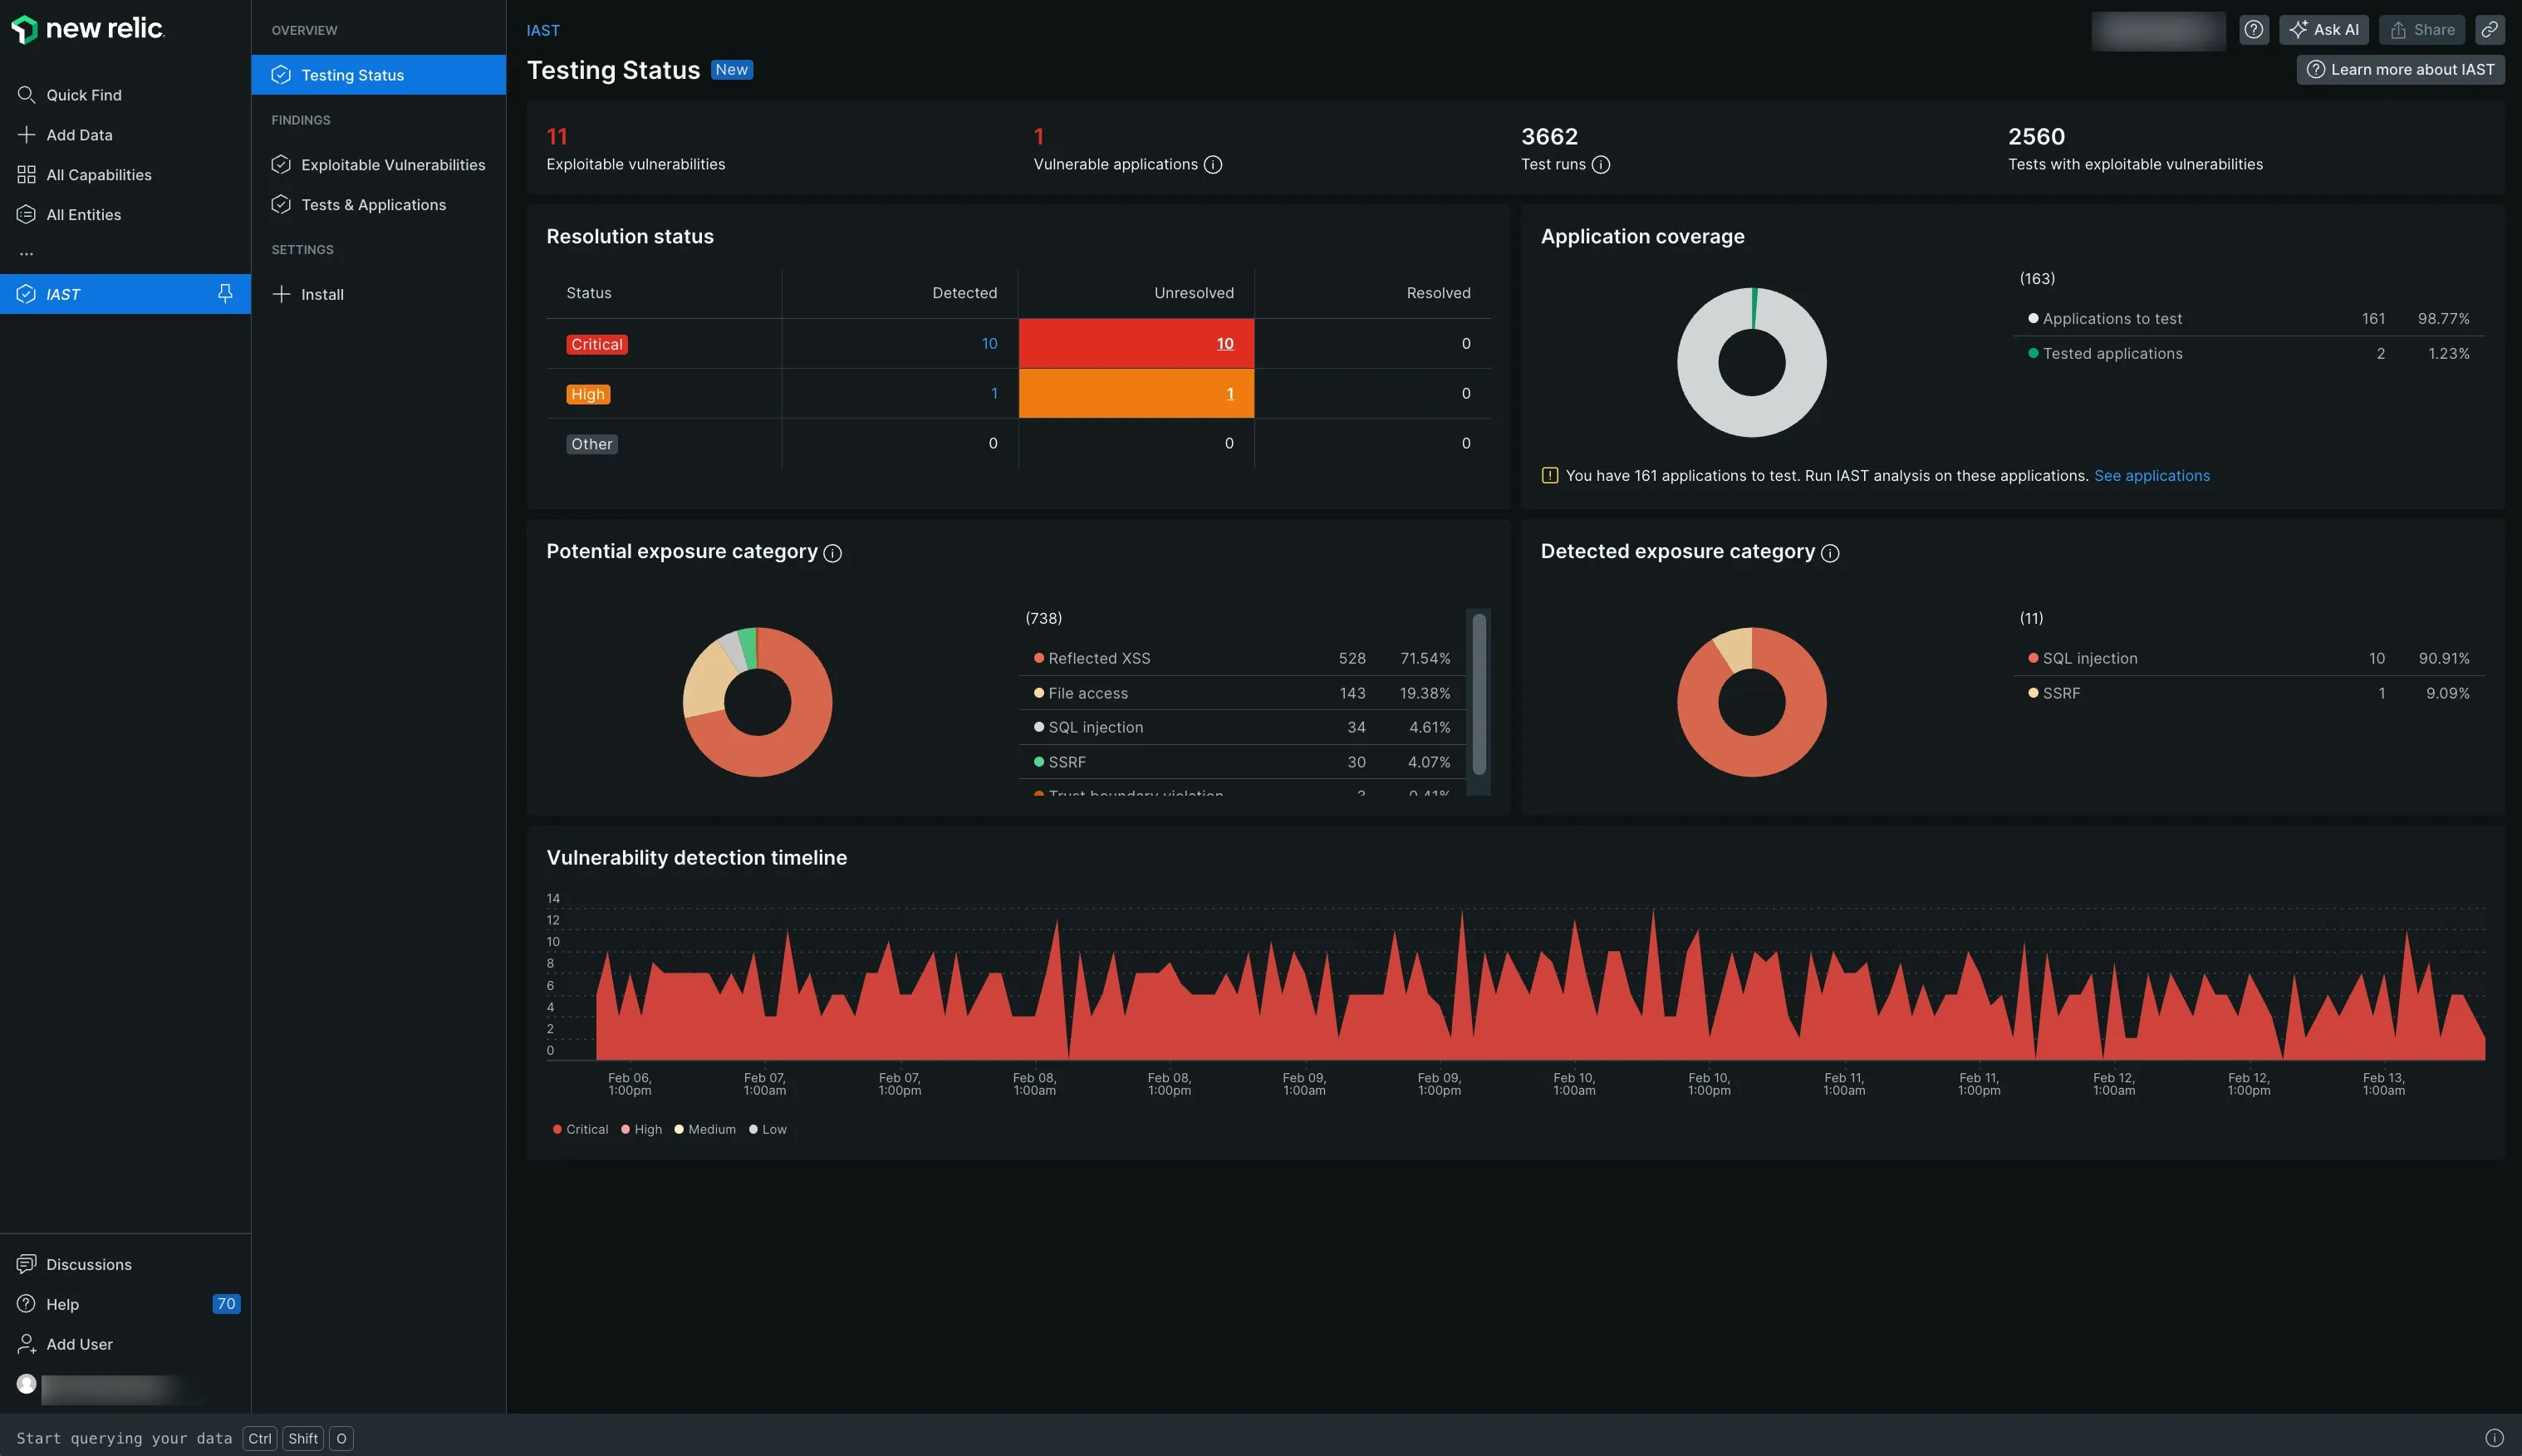
Application security in New Relic is carried out using the Interactive Application Security Testing (IAST) feature. IAST was able to identify and fix vulnerabilities in my application environment. It displayed the types of risk being introduced into the environment and categorized them based on the level of severity. Currently, IAST supports only Java, Node.js, and Go.
Splunk on the other hand has different security products and apps that protect applications and the overall system from attacks.
Here’s what some of Splunk’s security products can do:
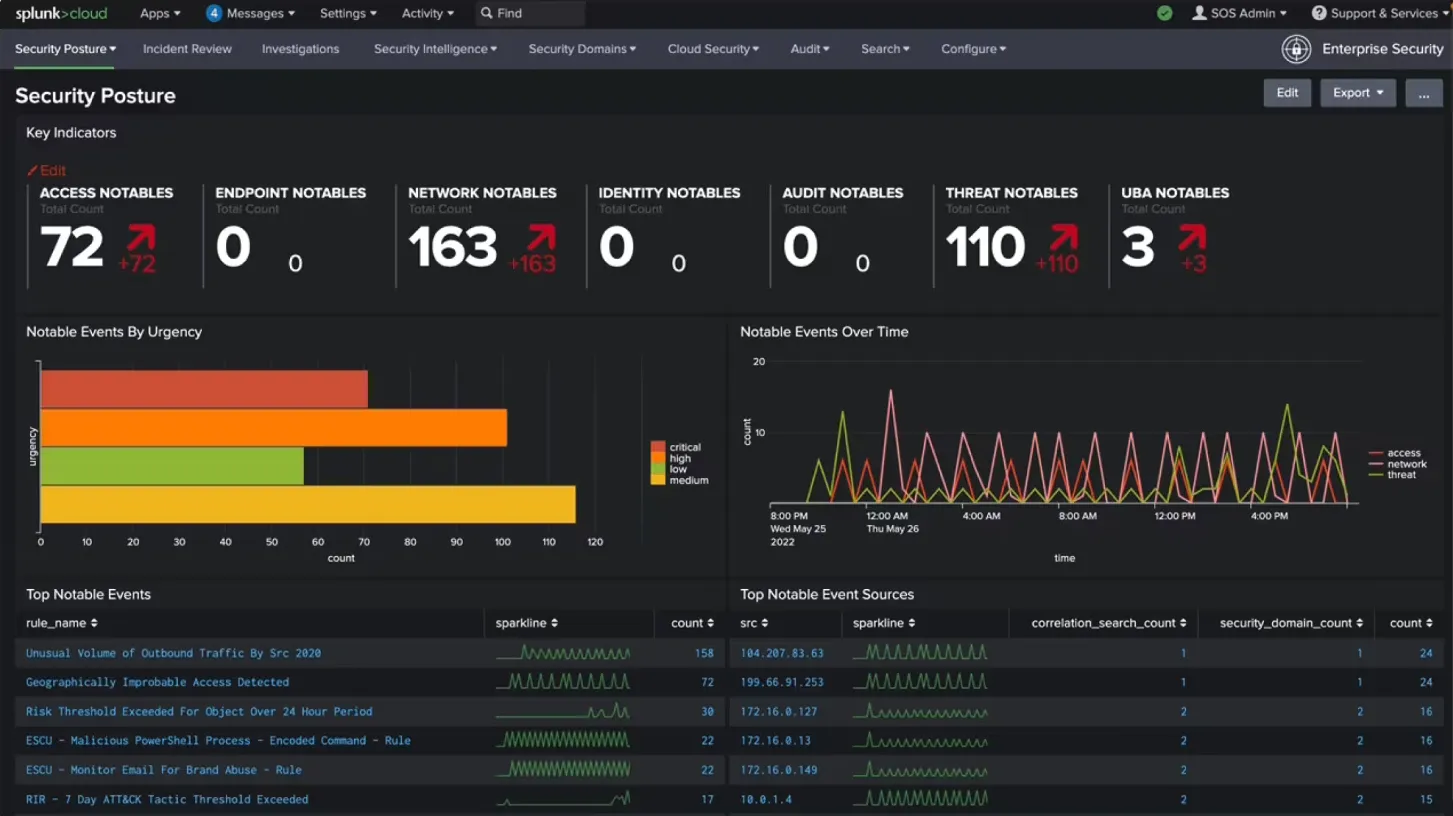
- The Splunk Security Essentials app provides a consolidated, real-time view of your entire system to detect threats.
- The Splunk Enterprise Security tool allows users to understand their organization's security posture. It also identifies potential security risks by analyzing diverse data sources and recognizing suspicious patterns indicative of attacks.
- The Splunk attack analyzer helps to discover and investigate cyber-attacks and threats. It also provides information on how they can be rectified.
If you want to focus on the security of your applications alone, New Relic is a better choice. If you want a comprehensive security tool that focuses on both your applications and the overall system, then go for Splunk.
OpenTelemetry Support: Splunk
OpenTelemetry is now emerging as the standard way of generating telemetry data from applications. As an open-source tool that is still gaining support, integrating full support for its features and functionalities into existing monitoring platforms might take time.
While both New Relic and Splunk offer support for OpenTelemetry, it's worth noting that the level of support in both tools is not optimal.
If you require a tool with complete OpenTelemetry support, consider using an OpenTelemetry native tool like SigNoz, which is also open-source.
Pricing: New Relic
New Relic and Splunk are costly to use. The following points might help you decide which tool is better suited for your needs:
New Relic
- Pricing is based on two things:
- Amount of data ingested
- User Seats
- New Relic provides a free forever plan with 100GB of free data ingest each month.
- Post 100GB, you need to pay $0.3/GB or $0.5/GB ingested based on your plan.
- User seats can get expensive. New Relic allows only 5 full platform users in its standard plan, and the cost of full platform users can be up to $549/user per month for enterprise plans.
Splunk
- The pricing model is complex and expensive.
- The actual price of using Splunk is not explicitly stated on the Splunk website. Users need to contact the sales team.
- You get a 15-day free trial period.
While New Relic is also expensive to use, it is a more cost-effective solution when compared to Splunk. If your primary concern is cost, New Relic should be your choice.
New Relic vs Splunk: Final Verdict
When evaluating monitoring solutions, it's essential to consider your environment's specific use cases and requirements. New Relic and Splunk excel in different scenarios and cater to diverse needs.
Here’s a use-case-based guide for New Relic vs Prometheus:
- If you want better application performance management, choose New Relic.
- If your use case is real-user monitoring, then choose Splunk.
- If you require a tool that is easy to get started with, choose New Relic.
- If your use case is application security, then choose Splunk.
- If your use case is log management, choose Splunk.
- If you want to visualize and understand your application data, choose New Relic.
If you require a better monitoring and observability tool with OpenTelemetry support and better monitoring and observability capabilities, consider SigNoz.
Advantages of using SigNoz over New Relic and Splunk
APM and observability tools are critical in a developer's kit. They improve developer efficiency, save bandwidth by resolving issues quickly, and increase developer productivity.
SigNoz is a full-stack open source APM which is built to support OpenTelemetry natively. OpenTelemetry is an open-source project under the Cloud Native Computing Foundation (CNCF) that is very suited to instrument cloud-native applications for telemetry data. OpenTelemetry provides the freedom to choose any backend analysis tool freeing you from any vendor lock-in.
Here’s how SigNoz fits the case for a New Relic and Splunk alternative with its features.
- SigNoz is open-source and easy to get started with.
- It has a free open-source version and a paid cloud-based version with transparent pricing.
- It is natively built to support OpenTelemetry.
- SigNoz provides out-of-the-box charts and visualizations for application metrics like p90, p99, latency, error rates, request rates, etc.
- It provides distributed tracing to get end-to-end visibility of your services.
- SigNoz’s log management is equipped with a powerful search and filter query builder.
- It provides exception monitoring to track exceptions and errors in your application.
Getting Started with SigNoz
SigNoz Cloud is the easiest way to run SigNoz. Sign up for a free account and get 30 days of unlimited access to all features.

You can also install and self-host SigNoz yourself since it is open-source. With 24,000+ GitHub stars, open-source SigNoz is loved by developers. Find the instructions to self-host SigNoz.
Further Reading:
DataDog vs New Relic - The Real Winner
Top 11 Splunk Alternatives [Includes Free & Open-Source Tools]
Grafana vs Splunk - Key Features and Differences
New Relic vs Sentry - In-depth Comparison Guide
New Relic vs AppDynamics - In-Depth Comparison Guide
Datadog vs Splunk - Which Observability Tool Fits Your Needs?
OpenTelemetry vs Splunk - Which Monitoring Tool Is Right for You?
