What are Cloudwatch Metrics? How to implement Custom Metrics in Cloudwatch?
CloudWatch metrics play a critical role in monitoring AWS resources and facilitating effective troubleshooting during system failures. It allows for continuous monitoring of AWS resources like EC2 instances, Lambda functions, and RDS databases. Using Cloudwatch metrics, DevOps teams can monitor and manage their AWS infrastructure easily.
Amazon CloudWatch is a comprehensive monitoring and observability service provided by Amazon Web Services (AWS). It facilitates the collection and tracking of metrics, logging management, and setting alarms to ensure optimal performance and health of AWS resources.
The metrics collected by CloudWatch from AWS resources help users understand their system's behavior, identify trends, detect anomalies, and make informed decisions to optimize performance and troubleshoot issues. These metrics provide valuable insights into various aspects of your system or application.
In this article, you will learn everything about Cloudwatch metrics. But first, let’s have a brief overview of Amazon Cloudwatch.
What is Amazon CloudWatch?
Amazon CloudWatch is a comprehensive monitoring service provided by AWS (Amazon Web Services), designed to provide real-time insights into AWS resources and applications. This service collects and tracks various metrics and logs, allowing users to observe and respond to their system's performance and operational health.
In layman’s terms, CloudWatch is a metrics and logs repository, and it provides a centralized and structured storage system for collecting, storing, and managing performance metrics and logs related to AWS resources and applications.
Cloudwatch Metrics in AWS resource and application monitoring are essential for ensuring optimal performance and efficient resource utilization. They provide invaluable insights into the operation of AWS services, enabling real-time tracking of system health, performance, and usage patterns.
Types of Monitoring in Cloudwatch
Cloudwatch offers two levels of monitoring:
- Basic Monitoring: This is the default monitoring level for AWS services. It provides a standard set of metrics at no additional charge, with data points typically available at five-minute intervals.
- Detailed Monitoring: Offers more granular data insights, with metrics available at one-minute intervals. It’s offered only by some AWS services, and you must choose to activate it. This option is particularly useful for short-term performance changes and more precise troubleshooting.
Here’s a list of services that offer detailed monitoring in AWS:
- Amazon API Gateway
- Amazon CloudFront
- Amazon EC2
- Elastic Beanstalk
- Amazon Kinesis Data Streams
- Amazon MSK
- Amazon S3
You can enable detailed monitoring for any of the above AWS services in Cloudwatch, but detailed monitoring is charged separately, so you should only enable it if you need it.
Understanding CloudWatch Metrics
CloudWatch Metrics, a key feature of Amazon CloudWatch, provides essential data and insights for effectively monitoring applications, responding to performance changes, and optimizing resource use. It enables real-time collection and visualization of metrics via automated dashboards, simplifying the management of infrastructure and applications.
Metrics, numerical indicators of system performance, are critical for assessing aspects like CPU usage, memory consumption, and error rates. They offer a quantitative view of data over specific time intervals, forming a solid basis for informed decisions about the health and efficiency of AWS resources and applications.
In addition to AWS-generated metrics, CloudWatch also allows the creation and monitoring of custom metrics. Metrics can be visualized using CloudWatch dashboards, offering a clear view of the system’s performance.
Types of CloudWatch Metrics
In this section, you will learn about the different types of CloudWatch metrics available.
It's worth noting that if you're an AWS user, you already use CloudWatch whether you realize it or not. However, metrics are exclusively sent to CloudWatch by the specific AWS services that are actively in use. You can refer to the documentation to identify the AWS services that publish metrics to CloudWatch.
The different types of CloudWatch metrics available are:
Built-in Metrics in Cloudwatch
Built-in Metrics refer to the default, predefined performance indicators or out-of-the-box metrics provided by AWS services. Take Amazon EC2 as an example; it has predefined metrics such as CPU usage, disk activity, network traffic, etc. These metrics are automatically collected by CloudWatch and are available for free. You can also build dashboards and alarms on these metrics.
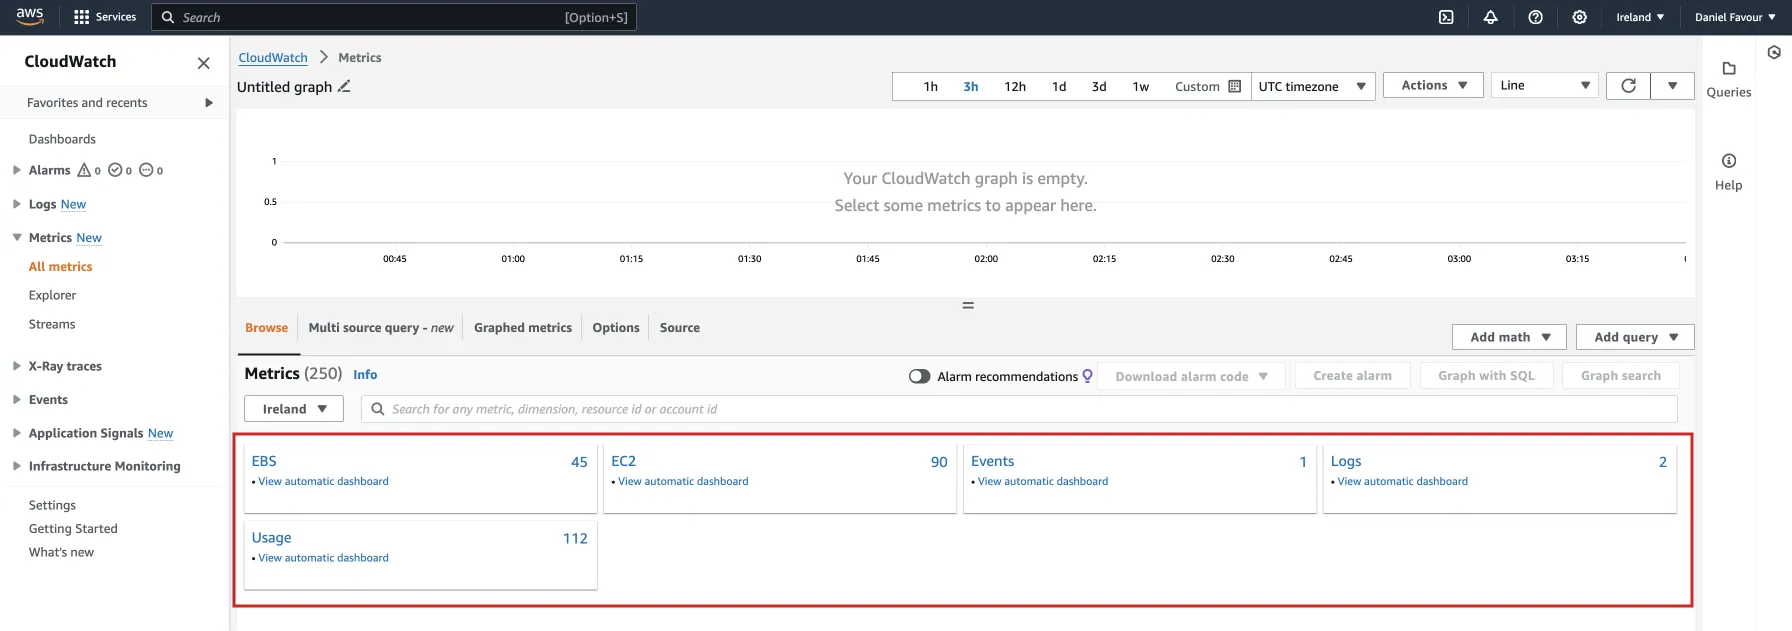
CloudWatch organizes the collected metrics for clarity and ease of use. Metrics are grouped into 3 different levels, which ensures a straightforward and efficient system for users to manage and understand their metrics. These levels are:
- Namespace Level: At the highest level of organization, metrics are grouped by namespaces. Namespaces are containers for CloudWatch metrics. They are used to group related metrics together. This provides a way to avoid naming conflicts by segregating metrics from various sources. Each AWS service has its namespace to distinguish its set of metrics. For example, all metrics related to Amazon EC2 instances are grouped under the "AWS/EC2" namespace.
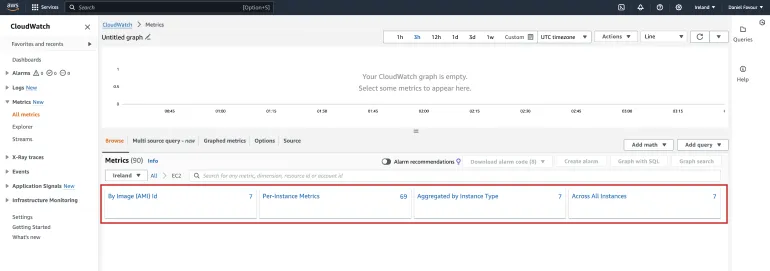
- Dimension Level: Within the "AWS/EC2" namespace, metrics can further be organized based on dimensions. Dimensions are attributes that provide additional context to metrics. They are like tags that help organize and specify metrics. When you add a trait like "Instance ID", "Instance Type" or "Auto Scaling Group" to a metric, you're creating a distinct version of that metric. For instance, an EC2 instance may have dimensions such as "Instance ID" and "Image ID." This makes it easier to filter and understand your metrics based on these dimensions.
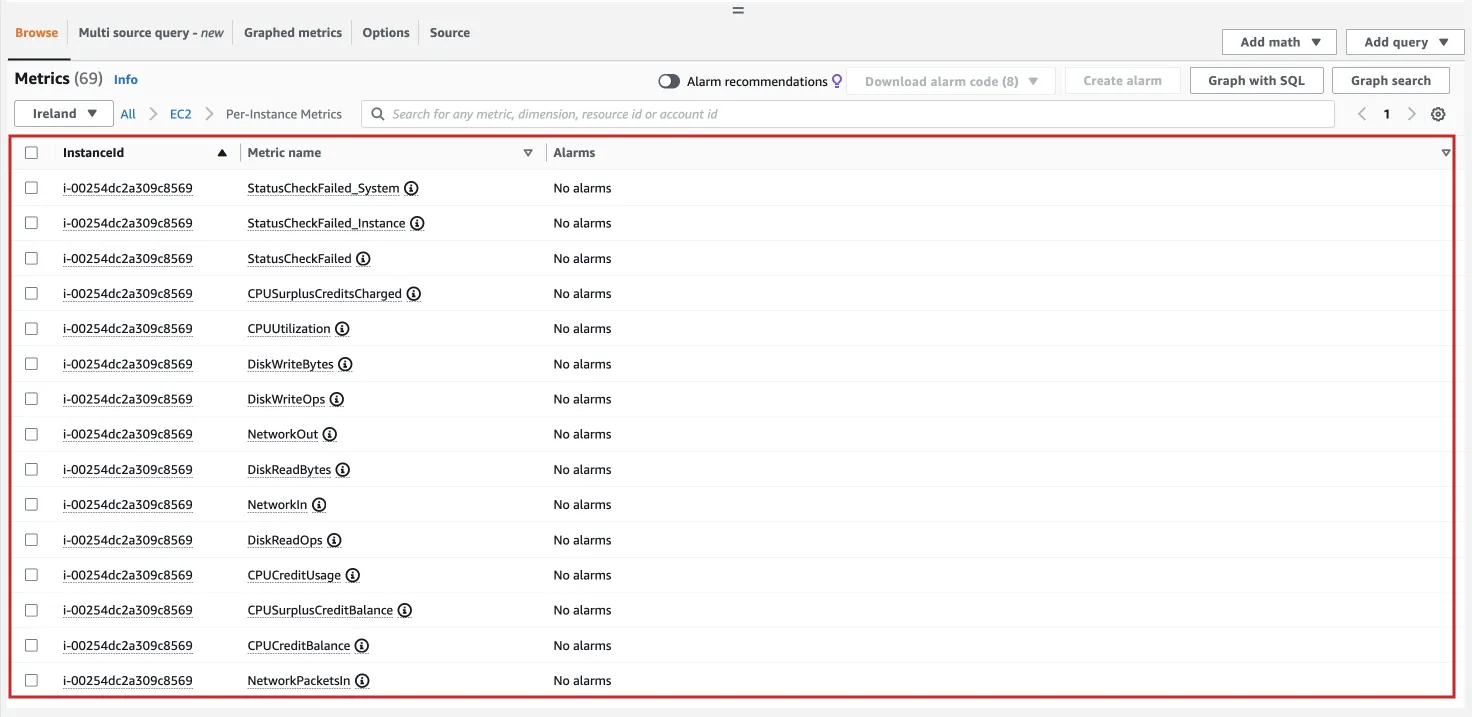
- Metric Data: At the most detailed level, metrics are the specific data points that capture the performance of your AWS resources—like monitoring CPU usage, disk space, disk activity, network traffic and more. Each combination of namespace, dimensions, and specific metric type provides a unique set of data for analysis.
You can visit the official documentation to learn more about these organizations.
Custom Metrics in Cloudwatch
In certain scenarios, the predefined metrics from AWS may not be what you need, or the data you require might not be as precise, especially if it's business-specific. This is precisely where custom metrics become indispensable.
Custom metrics are your personalized data points that you define and seamlessly publish to CloudWatch. They can be used to monitor your applications or business activities, and these metrics offer flexibility in terms of data precision and collection frequency.
Whether you intend to track the daily influx of new users to your application or any other bespoke metric, you have the autonomy to send custom metrics to CloudWatch at your preferred rate, shaping the data exactly as you need it.
You can store these application-specific metrics in CloudWatch, where you can visualize trends through graphs and set up alarms to respond promptly to shifts in your metrics.
Implementing Custom Metrics in Cloudwatch
If you are not satisfied with the built-in metrics provided to you, you can implement your own custom metrics through the AWS CLI and API. There are different ways to implement custom CloudWatch metrics from your application. They include:
- PutMetricsData API call
- AWS SDKs
- CloudWatch Agent - For EC2
- Embedded Metric Format
Custom Metrics with PutMetricsData API
The PutMetricData API in Amazon CloudWatch allows the publication of metric data points, associating them with specified metrics. If the metric does not exist, CloudWatch creates it, with a potential 15-minute delay in appearance for ListMetrics calls. With the PutMetricData API, you can publish high-resolution metrics, single data points, statistic sets, and value zero. You can learn more about this in the documentation.
This API serves as a valuable tool for publishing custom data points. However, it comes with certain limitations, particularly when considering its usage for continuous or constant processes. While it is suitable for one-off data submissions, its limitations become more apparent in scenarios requiring ongoing or frequent metric updates.
These limitations include constraints on payload size, throughput, and rate limits, making it more suitable for one-off data submissions rather than continuous or high-frequency processes. Additionally, there may be latency in data availability, and custom metric data has a limited retention period.
To create custom metrics using this method, you call the PutMetricsData API with your SDK. Here’s an example:
aws cloudwatch put-metric-data --metric-name PageViewCount --namespace MyService --statistic-values Sum=11,Minimum=2,Maximum=5,SampleCount=3 --timestamp 2016-10-14T12:00:00.000Z
This AWS CLI command uses the put-metric-data command to send metric data for "PageViewCount" in the "MyService" namespace, providing statistical values (sum, minimum, maximum, and sample count) at a specific timestamp to CloudWatch.
It's important to note that while using this API, you need to be mindful of AWS service quotas and pricing, as excessive use can lead to increased costs.
Custom Metrics with AWS SDKs
You can utilize AWS SDKs for various programming languages (e.g., Python, Java, Node.js) to create custom metric publishing into your applications.
To publish custom metric data using the AWS SDK, you can leverage the putMetricData method provided by AmazonCloudWatchClient. This method requires a PutMetricDataRequest, which should include details about the custom namespace and information about the data point in a MetricDatum object.
Here’s an example using the Java SDK:
import com.amazonaws.services.cloudwatch.AmazonCloudWatch;
import com.amazonaws.services.cloudwatch.AmazonCloudWatchClientBuilder;
import com.amazonaws.services.cloudwatch.model.Dimension;
import com.amazonaws.services.cloudwatch.model.MetricDatum;
import com.amazonaws.services.cloudwatch.model.PutMetricDataRequest;
import com.amazonaws.services.cloudwatch.model.PutMetricDataResult;
import com.amazonaws.services.cloudwatch.model.StandardUnit;

public static void putMetData(CloudWatchClient cw, Double dataPoint ) {

        try {
            Dimension dimension = Dimension.builder()
                    .name("UNIQUE_PAGES")
                    .value("URLS")
                    .build();

            // Set an Instant object
            String time = ZonedDateTime.now( ZoneOffset.UTC ).format( DateTimeFormatter.ISO_INSTANT );
            Instant instant = Instant.parse(time);

            MetricDatum datum = MetricDatum.builder()
                .metricName("PAGES_VISITED")
                .unit(StandardUnit.NONE)
                .value(dataPoint)
                .timestamp(instant)
                .dimensions(dimension).build();

            PutMetricDataRequest request = PutMetricDataRequest.builder()
                .namespace("SITE/TRAFFIC")
                .metricData(datum).build();

            cw.putMetricData(request);

        } catch (CloudWatchException e) {
            System.err.println(e.awsErrorDetails().errorMessage());
            System.exit(1);
        }
        System.out.printf("Successfully put data point %f", dataPoint);
     }
The above uses the AWS SDK for Java to publish custom metric data to Amazon CloudWatch. It constructs a Dimension, captures the current timestamp, builds a MetricDatum object with the given data point, and then sends this data to CloudWatch under the namespace "SITE/TRAFFIC". If the operation is successful, it prints a success message; otherwise, it handles exceptions and exits the program with an error message.
You cannot specify a namespace that begins with " AWS ". Namespaces that begin with " AWS " are reserved for use by Amazon Web Services products.
Use the Java 2.x AWS SDK, a revised version of the Java 1.x codebase, built on Java 8+ for features like non-blocking I/O and dynamic HTTP implementation switching.
Custom Metrics with CloudWatch Agent
If you're running an application on an EC2 instance, you can use the CloudWatch agent to collect and publish custom metrics. The agent can be configured to collect specific metrics from your application and publish them to CloudWatch. This is particularly useful for monitoring the performance of your EC2 instances and on-premises servers.
With the CloudWatch agent, you add custom dimensions to metrics collected by the CloudWatch agent. To custom dimensions like tags in the metrics gathered by the agent, include the "append_dimensions" field in the agent configuration file section that enumerates those metrics. As illustrated below, the provided configuration file snippet introduces a custom dimension named "stackName" with a value of "Prod" for the CPU and disk metrics captured by the agent.
"cpu":{
  "resources":[
    "*"
  ],
  "measurement":[
    "cpu_usage_guest",
    "cpu_usage_nice",
    "cpu_usage_idle"
  ],
  "totalcpu":false,
  "append_dimensions":{
    "stackName":"Prod"
  }
},
"disk":{
  "resources":[
    "/",
    "/tmp"
  ],
  "measurement":[
    "total",
    "used"
  ],
  "append_dimensions":{
    "stackName":"Prod"
  }
}
You can learn more about this in the docs.
Embedded Metric Format
The Embedded Metric Format (EMF) is a JSON specification employed to guide CloudWatch Logs in autonomously extracting metric values embedded within structured log events. It is a new standard that allows you to publish custom metrics directly from your applications to CloudWatch. It stands out as a standard designed for assimilating high-cardinality observability data into CloudWatch Logs, facilitating the creation of custom metrics.
EMF enables the incorporation of up to 20 dimensions with your metrics, allowing for the inclusion of up to 100 distinct metrics per call. You can use the CloudWatch SDKs to instrument your code with EMF.
This approach eliminates the need for invoking a specific API with a predefined structure to store information. Instead, you simply log a JSON structure containing all the relevant details, and these logs are automatically detected, translated, and stored in CloudWatch.
Check out the docs to learn how EMF can be utilized to publish custom metrics.
Cost of using CloudWatch
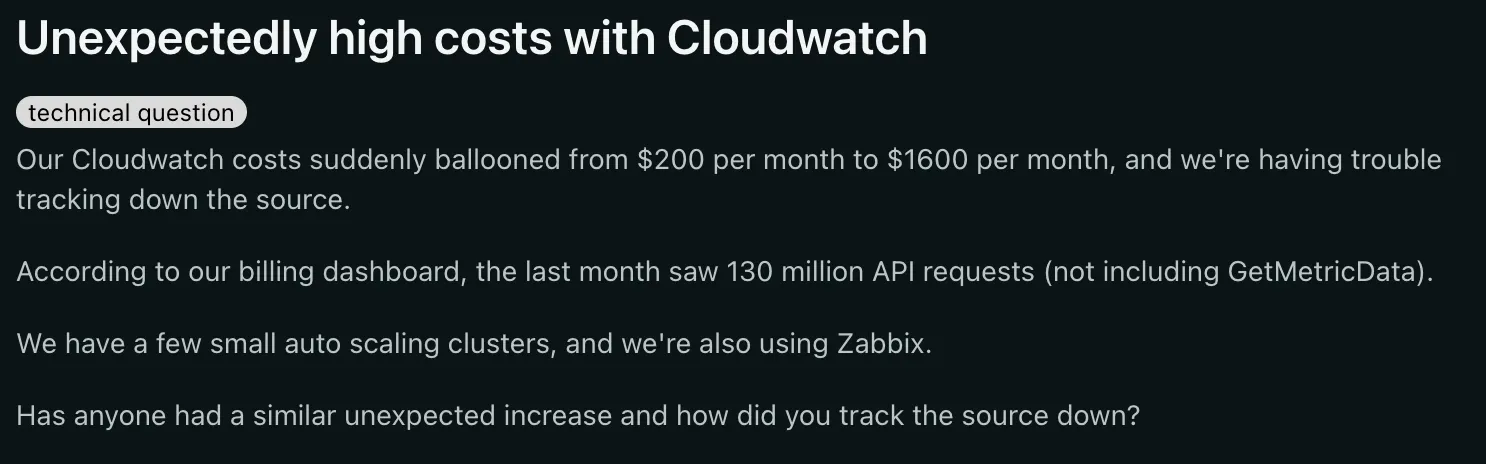
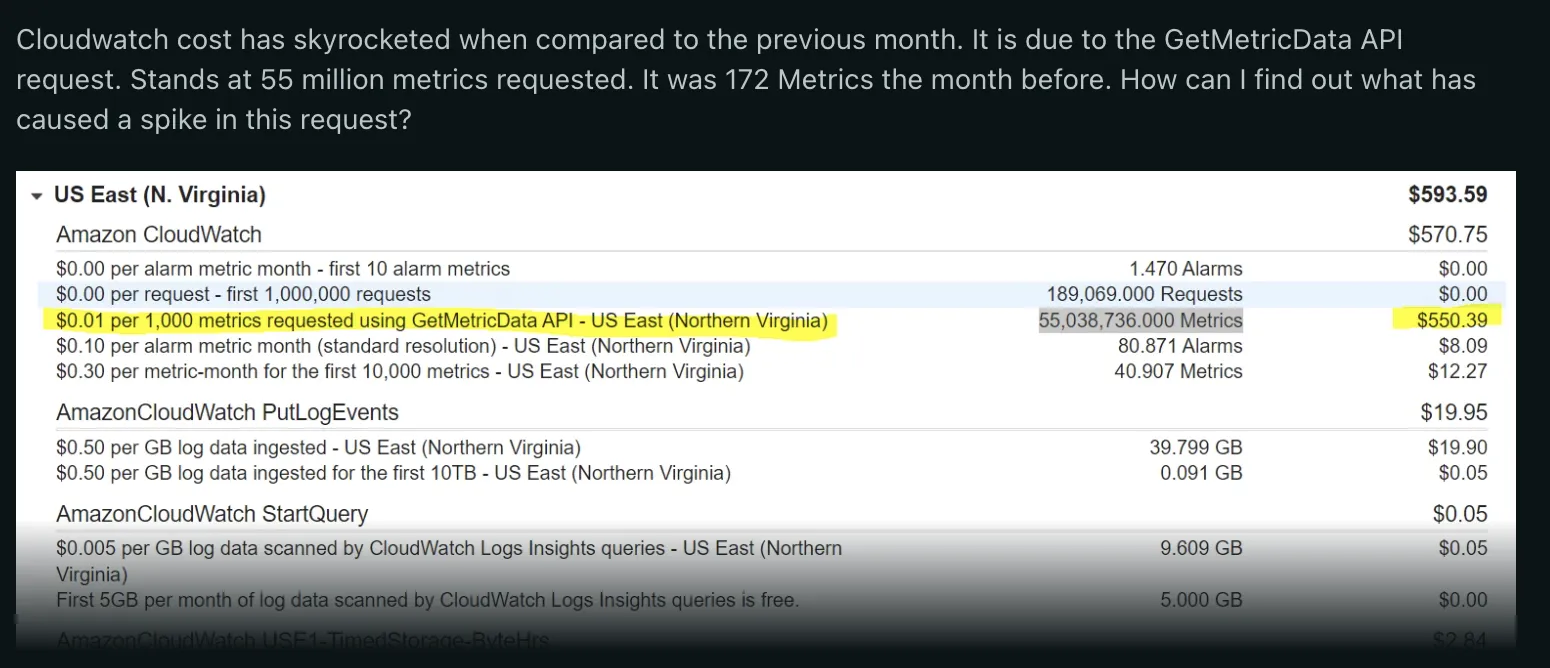
While CloudWatch offers valuable monitoring services, some users express concerns about the associated costs, often attributed to a high volume of API requests. For a detailed breakdown of every billing bucket, see our CloudWatch pricing guide and cost optimization playbook. This issue has been a topic of discussion on platforms like Reddit, where users share their experiences and challenges with CloudWatch expenses.
Cloudwatch UX is also limited if you want to have a robust monitoring setup. If Cloudwatch doesn’t fulfill all your requirements, then you can use one of these Cloudwatch alternatives.
When to look for a CloudWatch alternative
Here are a few tips to have in mind when looking for a CloudWatch alternative:
Avoid Vendor Lock-in
A crucial factor to evaluate is the potential risk of vendor lock-in. If there are plans to migrate to a different platform, opting for a CloudWatch alternative becomes essential. CloudWatch is intricately designed for AWS resources, and transitioning to another platform might lead to a loss of valuable service-related data accumulated over time.
Choose a cost-effective solution
You should always choose a cost-effective solution that aligns with your budget constraints and offers transparent pricing models. Keep in mind that cloud bills can spike unexpectedly, and CloudWatch costs may escalate as your AWS infrastructure grows. Look for alternatives that not only provide competitive pricing but also offer flexibility in terms of usage-based or tiered pricing, ensuring you can efficiently manage monitoring expenses without compromising on essential features.
Flexible hosting solution
When exploring monitoring solutions, prioritize those that offer versatility in hosting to accommodate varying data privacy and governance requirements. Opt for solutions that allow you to host your monitoring setup locally, on-premises, or in the cloud. This flexibility ensures you can tailor your hosting environment to meet specific compliance standards and organizational preferences, providing a comprehensive solution that aligns with your unique operational needs.
Full-Stack Monitoring solution
While CloudWatch excels in monitoring AWS resources, it falls short of being a full-stack monitoring solution. To achieve a more comprehensive monitoring approach that spans across the entire technology stack, exploring alternatives with robust full-stack monitoring capabilities becomes imperative. Look for solutions that offer enhanced features, encompassing infrastructure, network, application layers, and more, ensuring a holistic monitoring experience beyond the scope of AWS resources.
The right CloudWatch alternative to use - SigNoz
SigNoz is a full-stack open-source application performance monitoring and observability tool which can be used in place of CloudWatch. SigNoz is built to give SaaS like user experience combined with the perks of open-source software. Developer tools should be developer first, and SigNoz was built by developers to address the gap between SaaS vendors and open-source software.
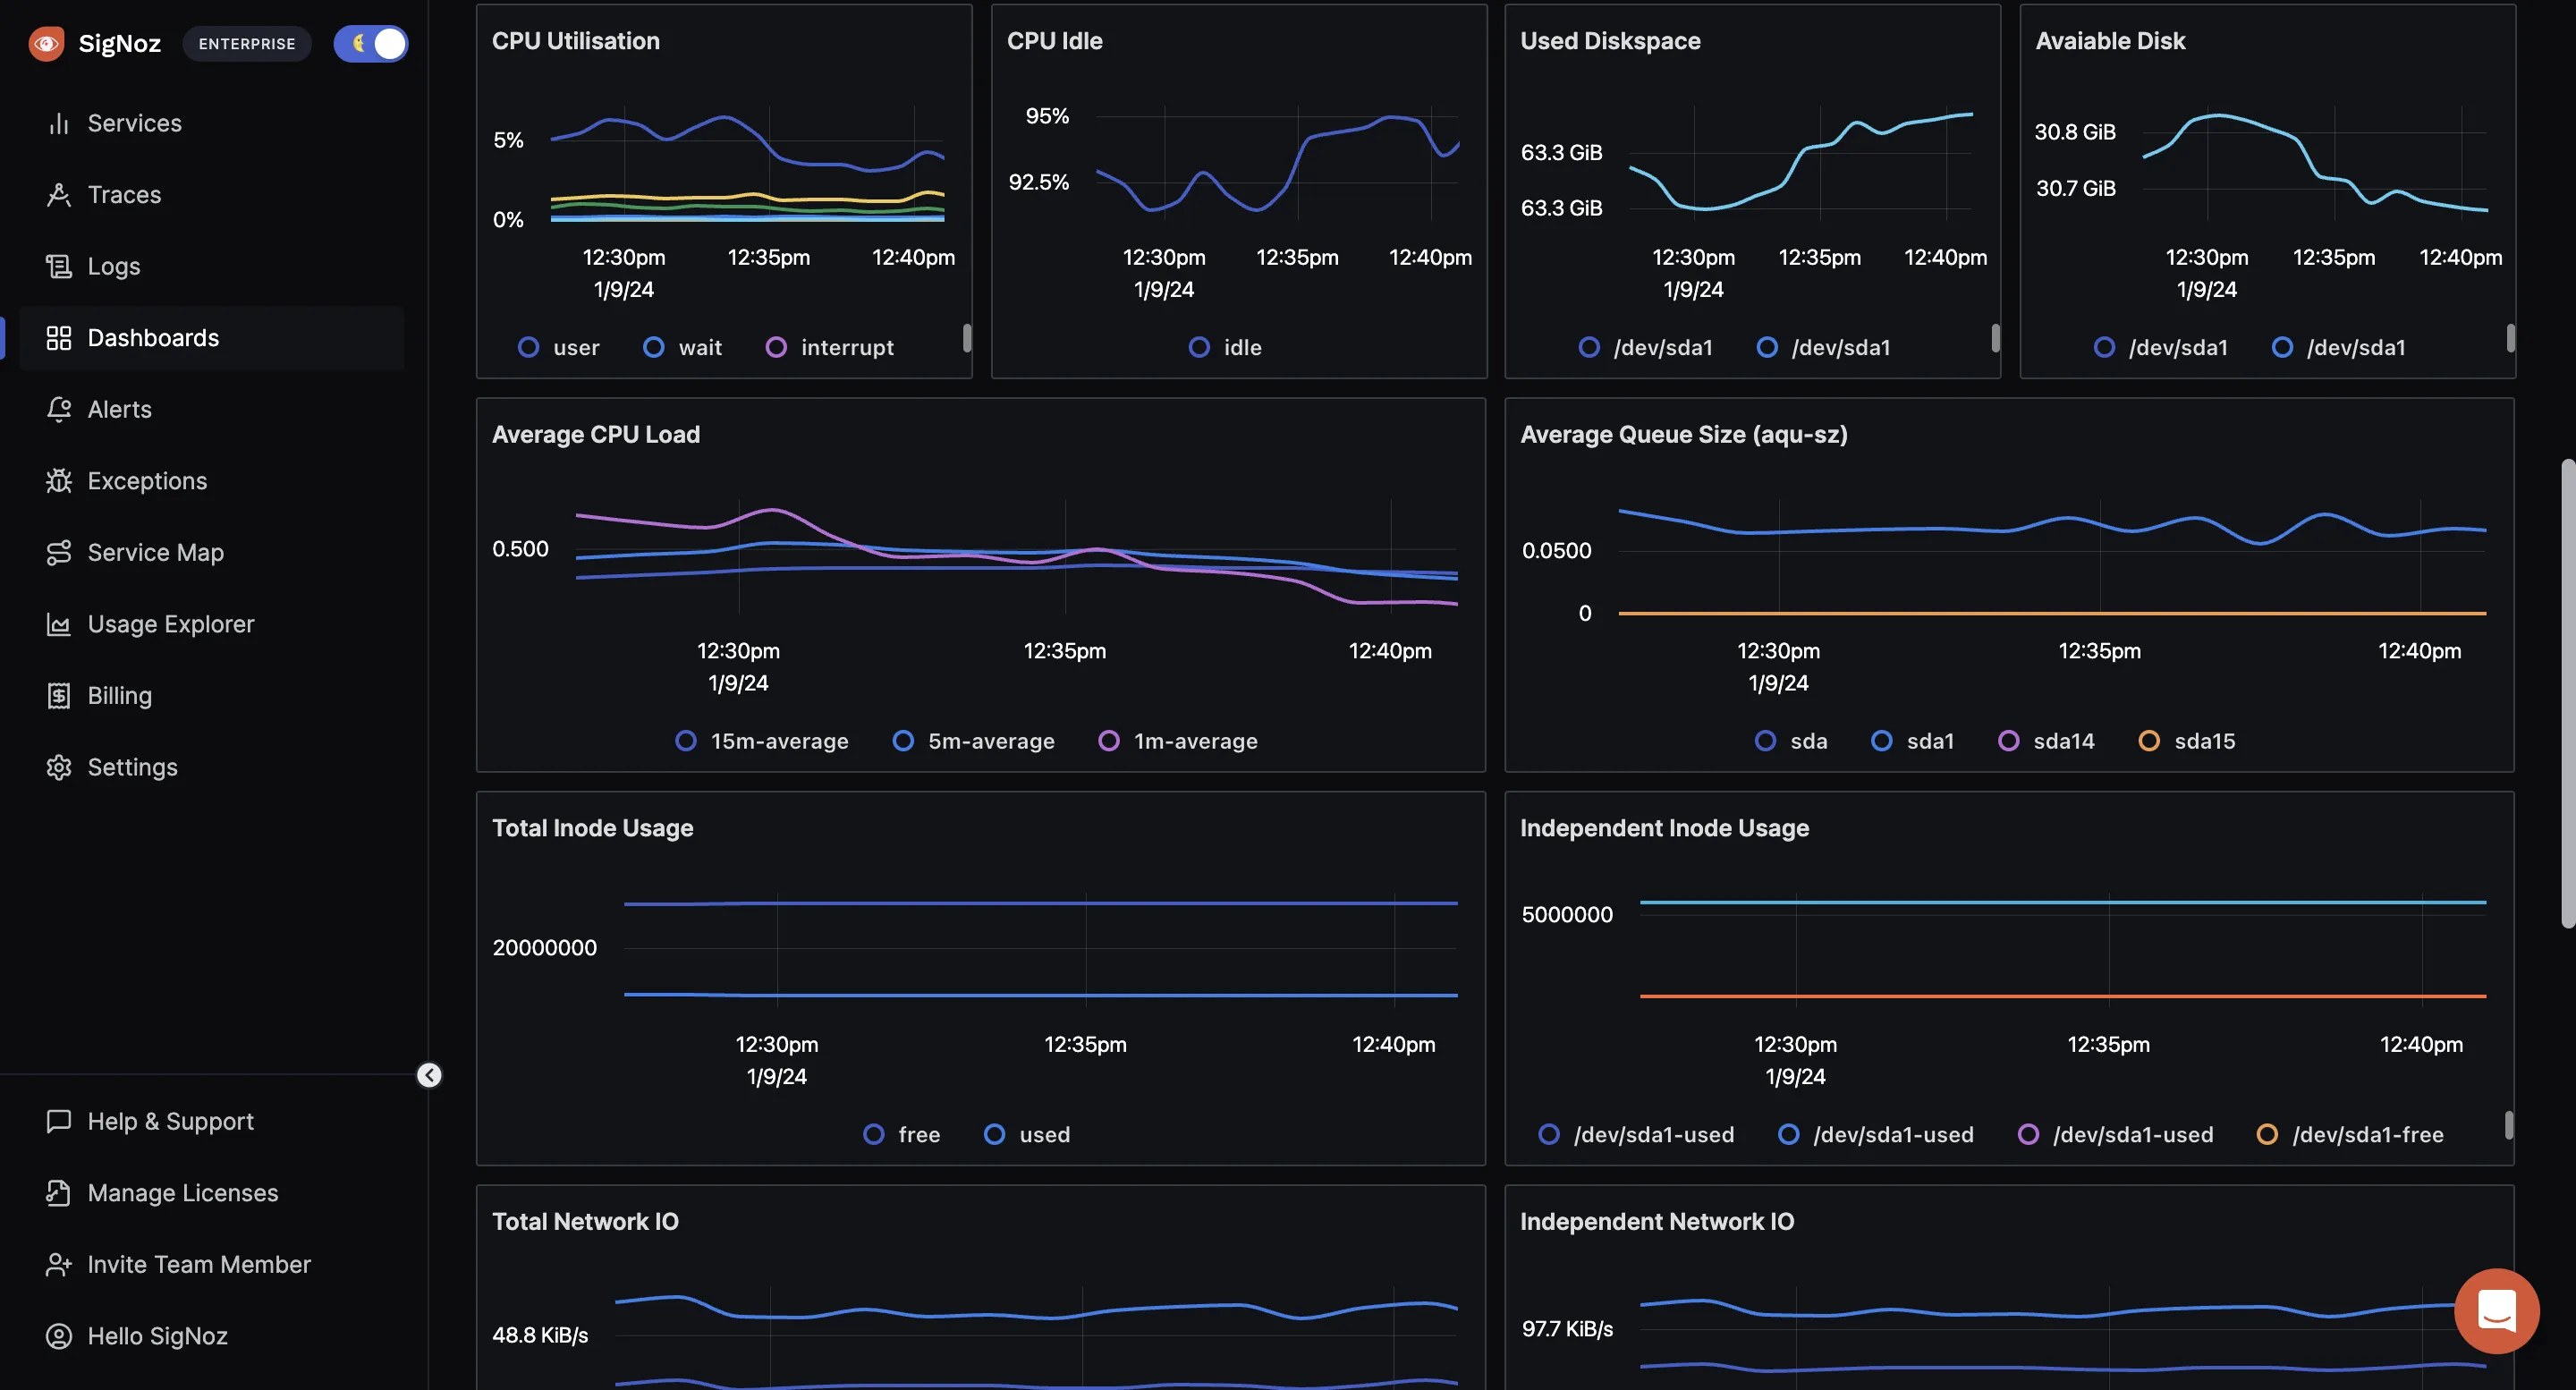
Key architecture features of SigNoz:
- Visualise Traces, Metrics, and Logs in a single pane of glass
- Monitor application metrics like p99 latency, error rates for your services, external API calls, and individual endpoints.
- Find the root cause of the problem by going to the exact traces which are causing the problem and see detailed flamegraphs of individual request traces.
- Run aggregates on trace data to get business-relevant metrics
- Filter and query logs, build dashboards and alerts based on attributes in logs
- Monitor infrastructure metrics such as CPU utilization or memory usage
- Record exceptions automatically in Python, Java, Ruby, and Javascript
- Easy to set alerts with DIY query builder

Getting started with SigNoz
SigNoz Cloud is the easiest way to run SigNoz. Sign up for a free account and get 30 days of unlimited access to all features.

You can also install and self-host SigNoz yourself since it is open-source. With 24,000+ GitHub stars, open-source SigNoz is loved by developers. Find the instructions to self-host SigNoz.
Further Reading
