12,000+ GitHub stars, better search capabilities, and a more intuitive Logs tab - SigNal 23
“The two most powerful warriors are patience and time.” Leo Tolstoy
Welcome to our monthly product newsletter - SigNal 23!
Last month, our team worked on improving the search capabilities across multiple tabs. We also made the logs tab more intuitive by adding color coding in the logs view. We presented SigNoz at an observability-focused meetup and crossed 12,000+ GitHub stars.
Let’s dive in to see what humans at SigNoz were up to in the month of March 2023.
What we shipped?
Search is a critical aspect of an observability dashboard, and we want our users to get to what they want quickly. We have shipped improvements in our search capabilities and further improved our logs tab.
Latest release - v0.18.1
Earlier releases - v0.18.0, v0.17.0
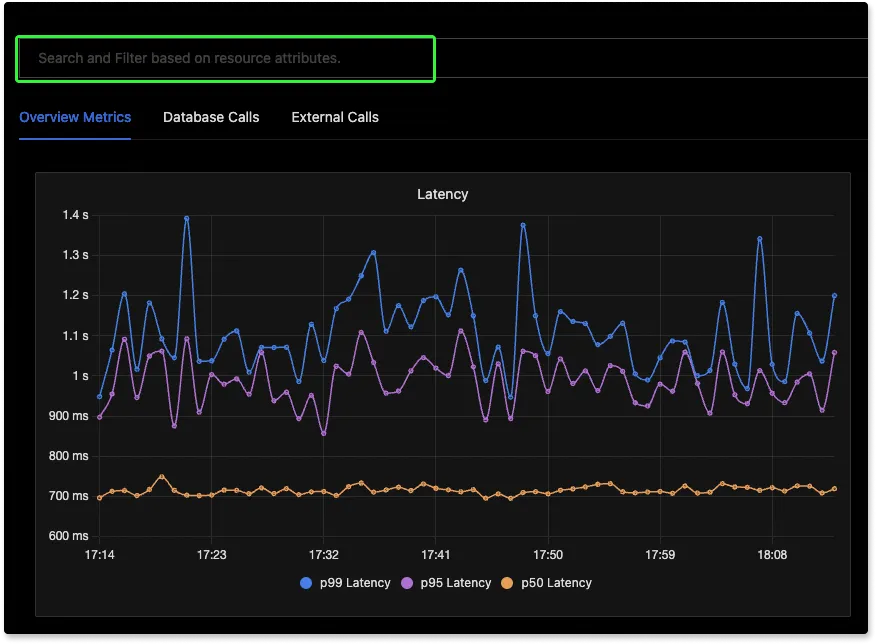
Search and Filter based on Resource Attributes
We have added search and filter capabilities based on resource attributes to enable our users to get what they want quickly. Now you can search based on resource attributes in the Exceptions tab. You can also use these attributes in an application’s RED metrics page.
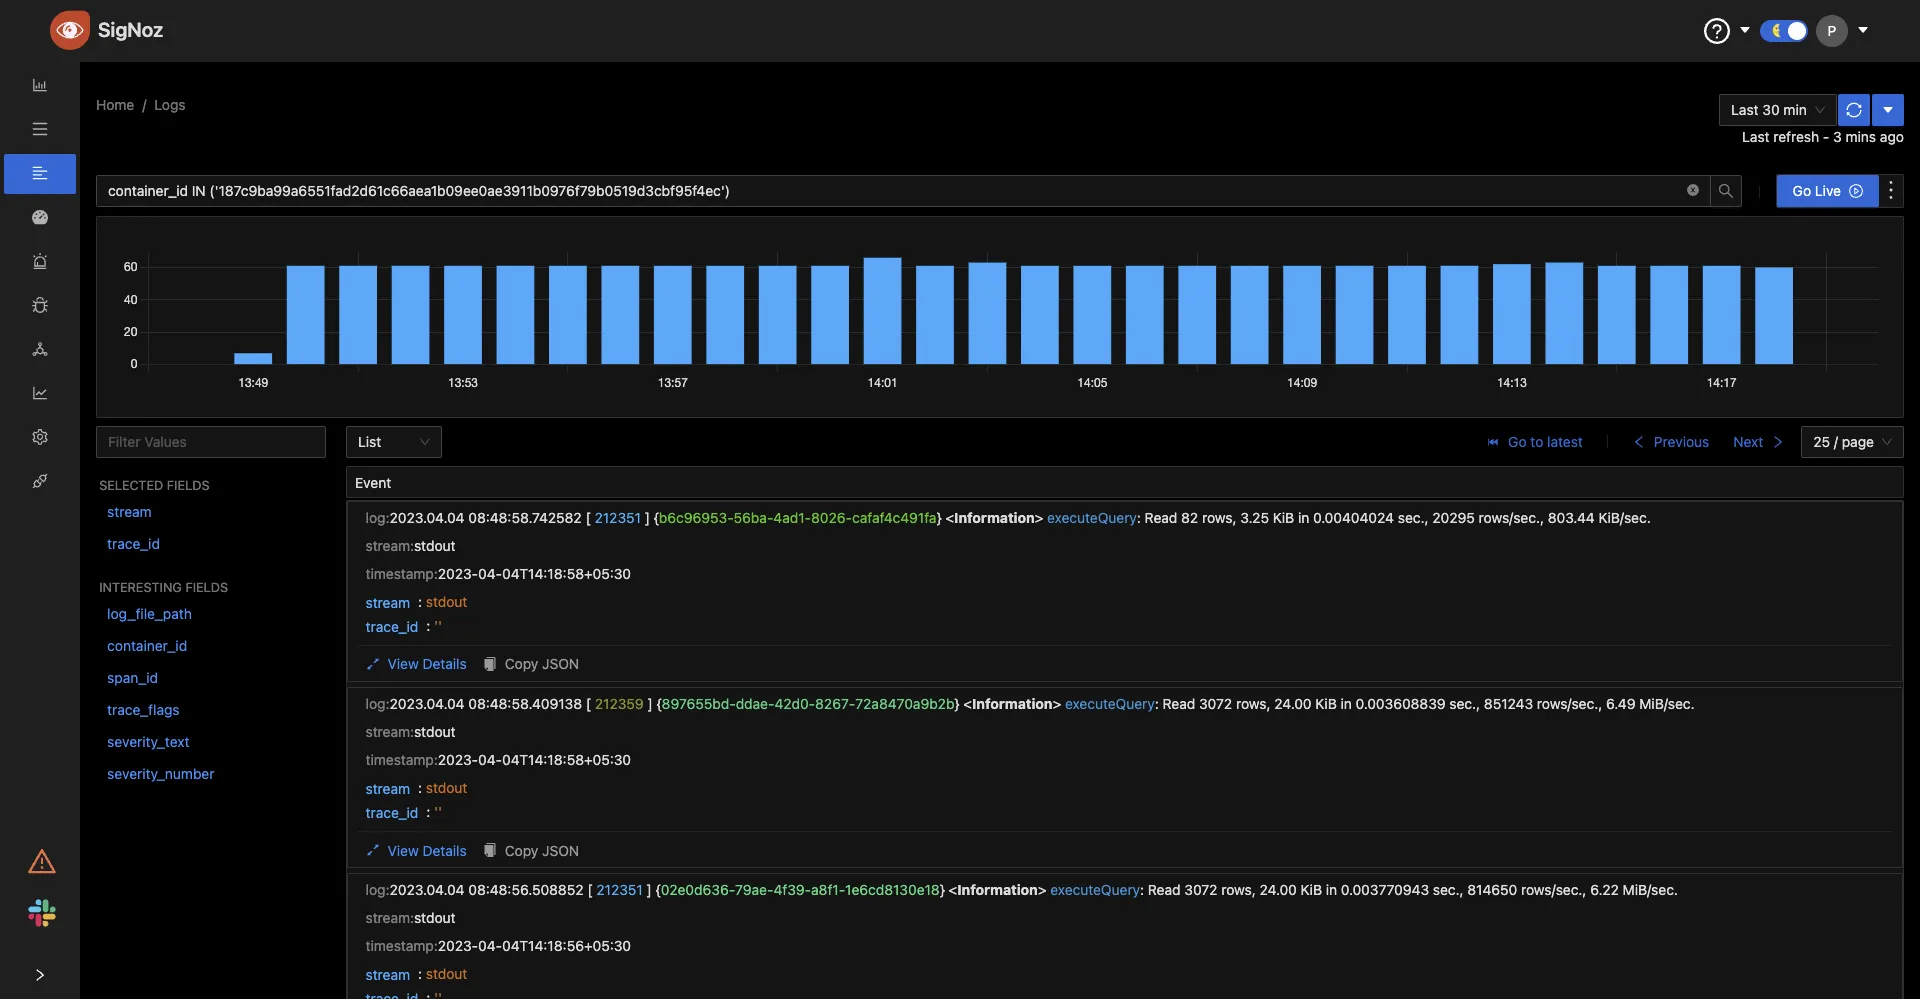
Continued improvements in the Logs Tab
We have improved the logs view with color-coded logs data in different compact views of logs. This improves the readability while going through logs data which is often huge.
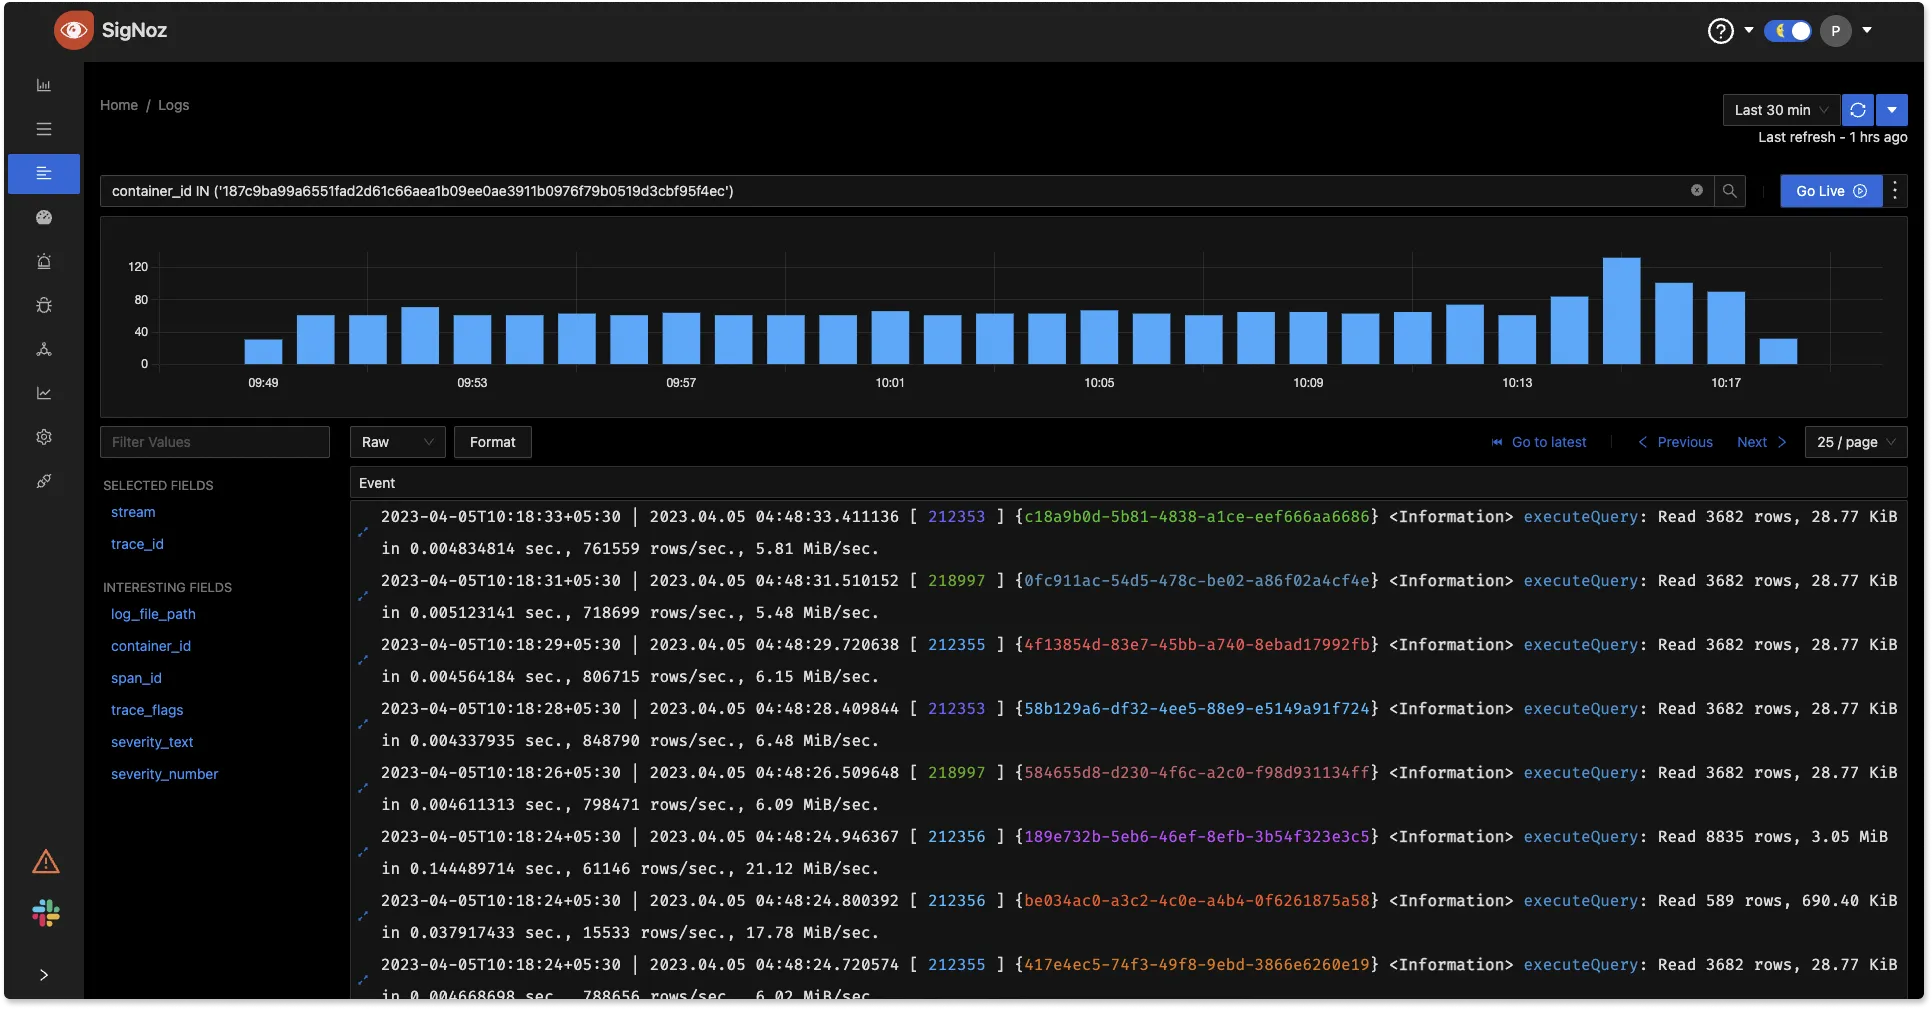
The color-coded view in raw format makes it very easy for developers to skim through their logs data.
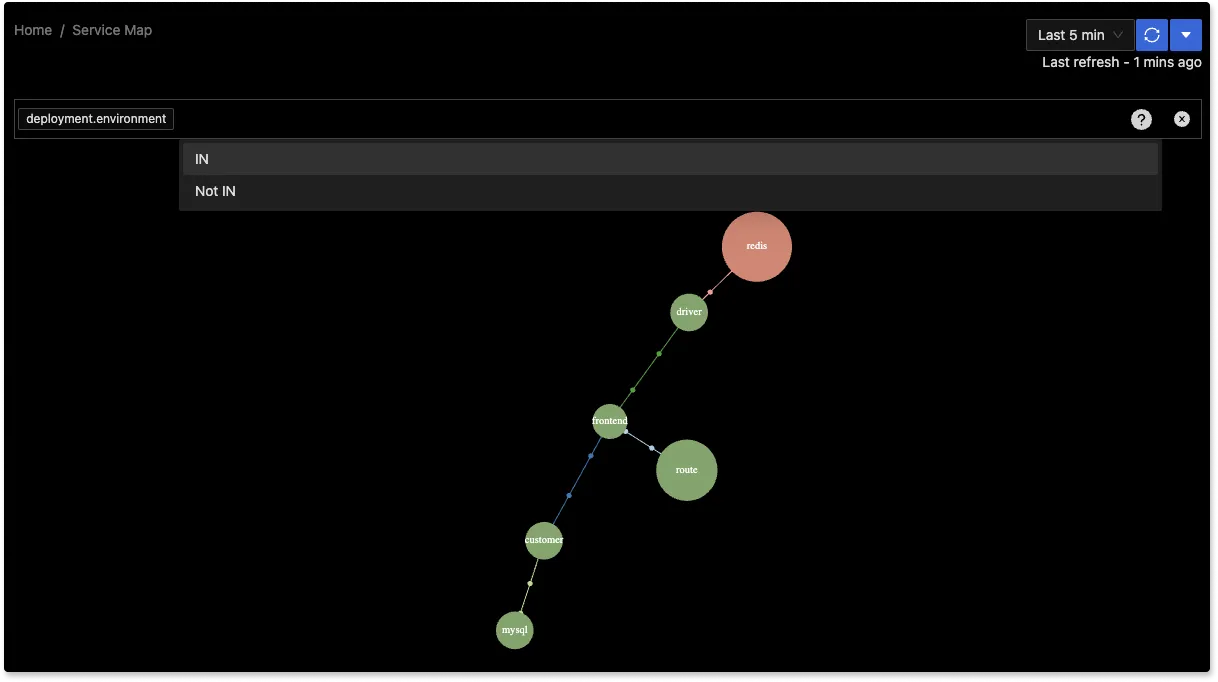
Ability to filter by deployment environment in Service Maps
Most of our users have multiple environments like staging, dev, and prod for their application development. Our Service Map tab is a great feature for having a topological overview of your application. Now you can use deployment.environment to filter the service map view based on your environment.
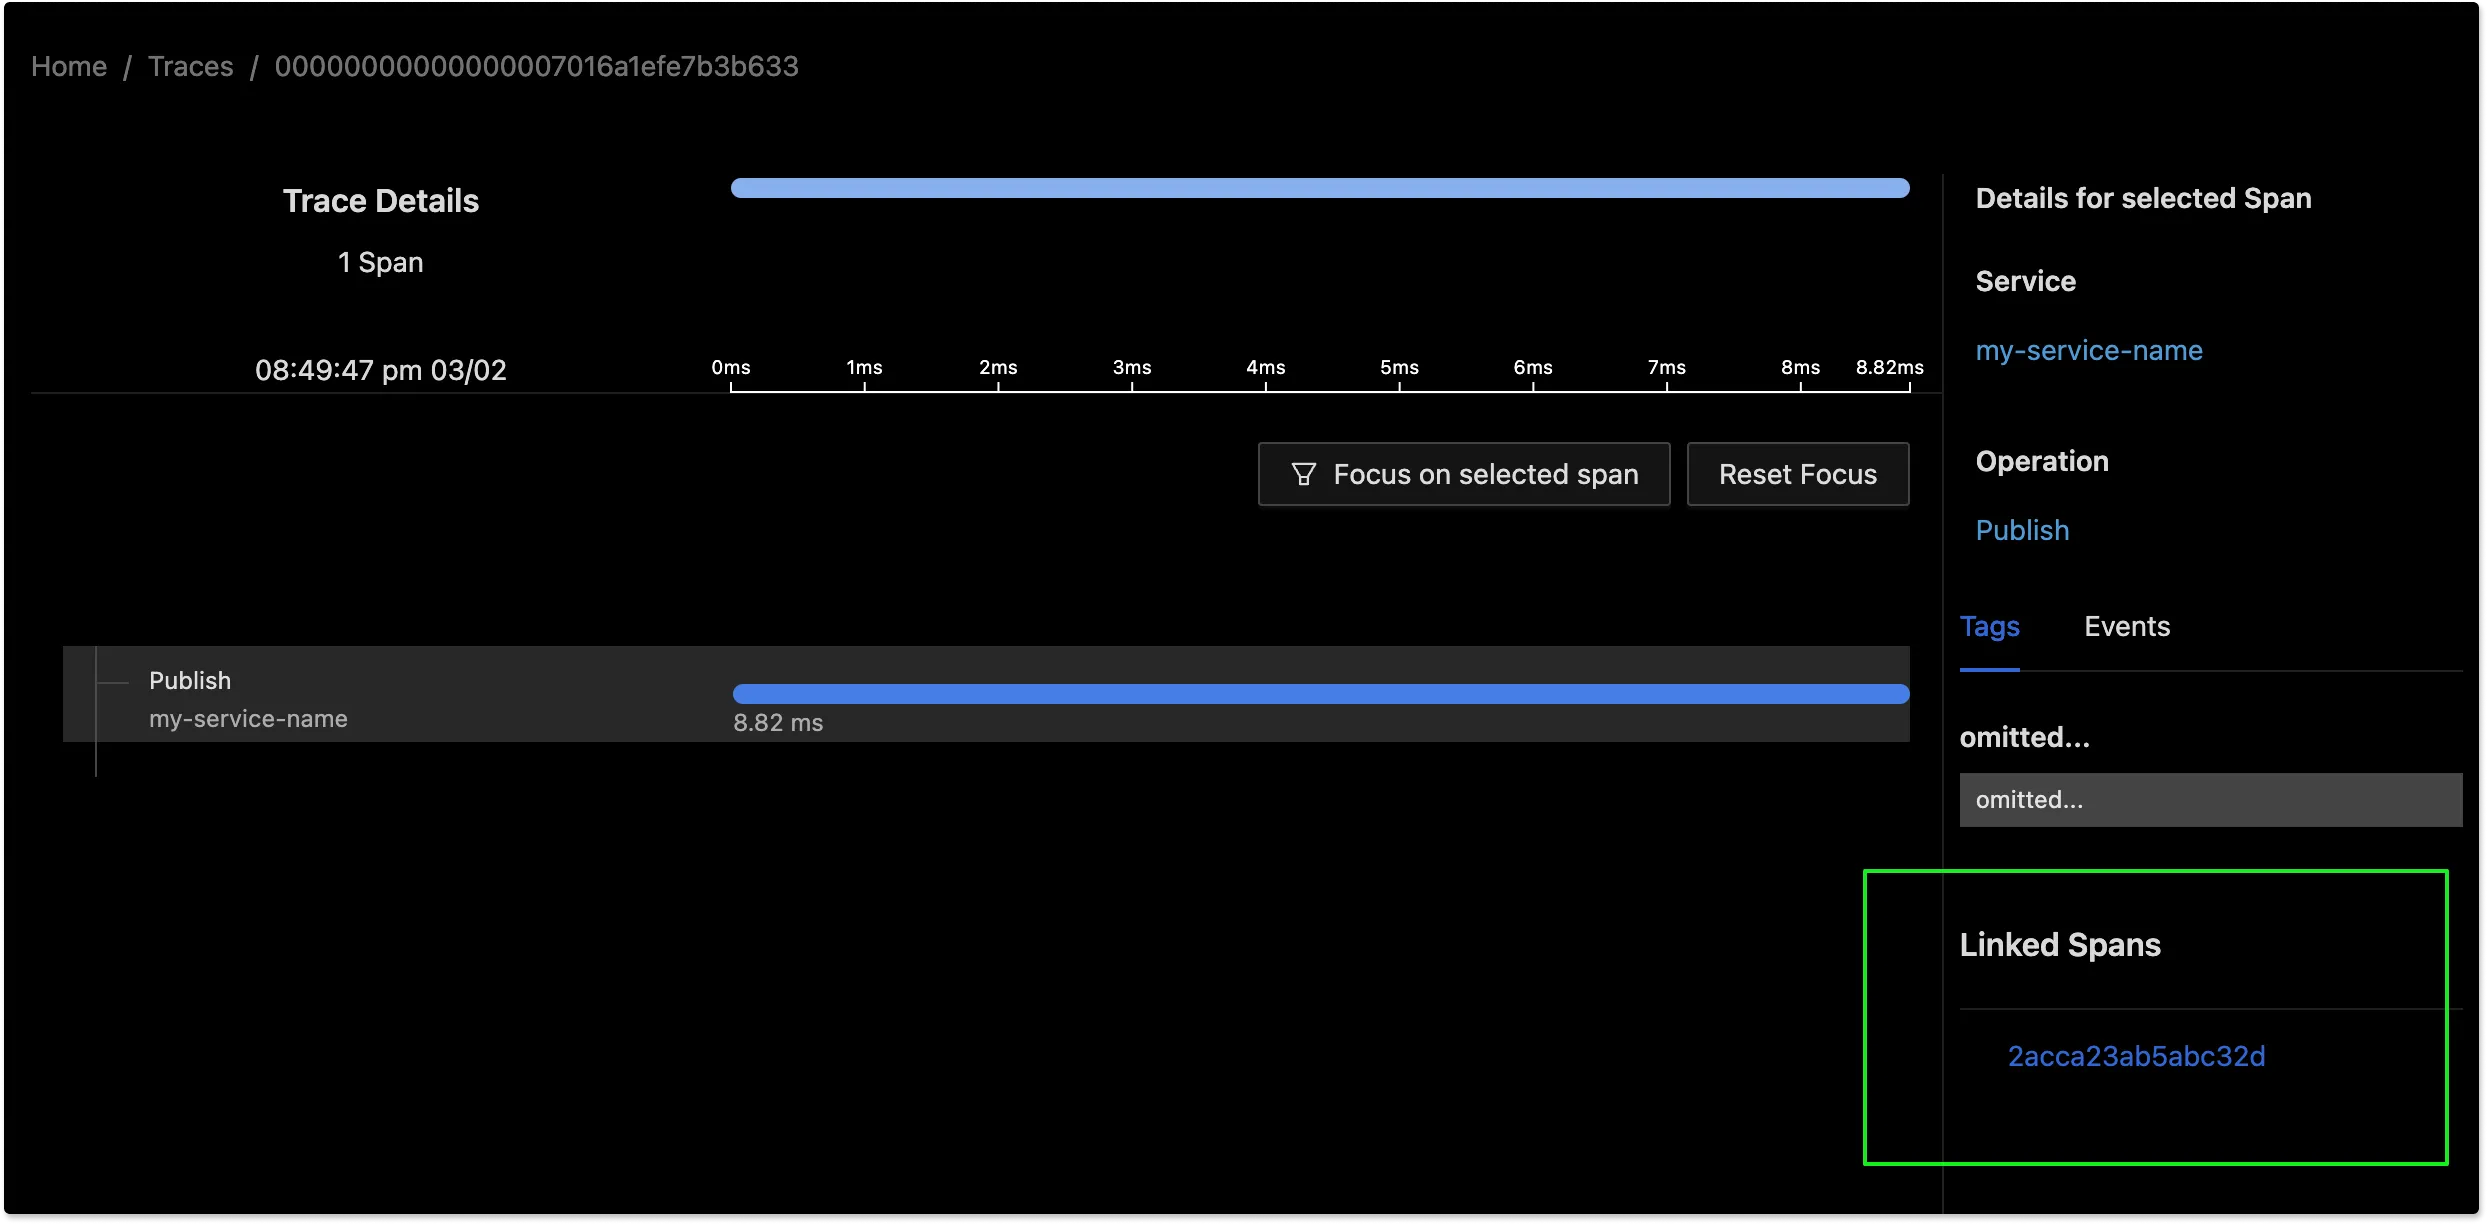
Support for Linked Spans in our UI
Linked spans are a way to create a connection between spans other than parent/child. These links can be used to represent batched operations where a span was initiated by multiple initiating spans.
We have now added support for showing linked spans in our UI. Apart from linked spans, the ability to run aggregates on trace data and advanced filtering and querying capabilities make SigNoz one of the best observability tools for trace analytics.
Improved Metrics calculation for corner cases
We are making continuous improvements in the analytics of all three types of telemetry signals - logs, metrics, and traces. We have improved the user experience by covering more corner cases for metrics-related charts.
For example, we have included a scenario where the application or OpenTelemetry Collecter restarts, setting the counter to zero.

Programmatic Access to observability data for our Enterprise users
Our enterprise users can now use APIs to access SigNoz backend data. This feature is useful in scenarios where a user has to access the backend data outside of the SigNoz frontend client. We received the request for this feature from our enterprise users.
For example, sometime a B2B SaaS product would require to share SLA-related data with their client without giving them access to the SigNoz client.
Featured Issue
Export Logs/Metrics/Traces for a specific Trace IDHave you come across use cases where you would need to export all telemetry data related to specific Trace IDs? Our UI is suited to debugging issues quickly. With the launch of the query builder, we will also enable intelligent correlation between telemetry signals.
So we want to understand the scenarios where a user might need to export telemetry signals to do the debugging rather than do it with SigNoz UI. If you have similar use cases, feel free to share your use case on this GitHub issue .
SigNoz News
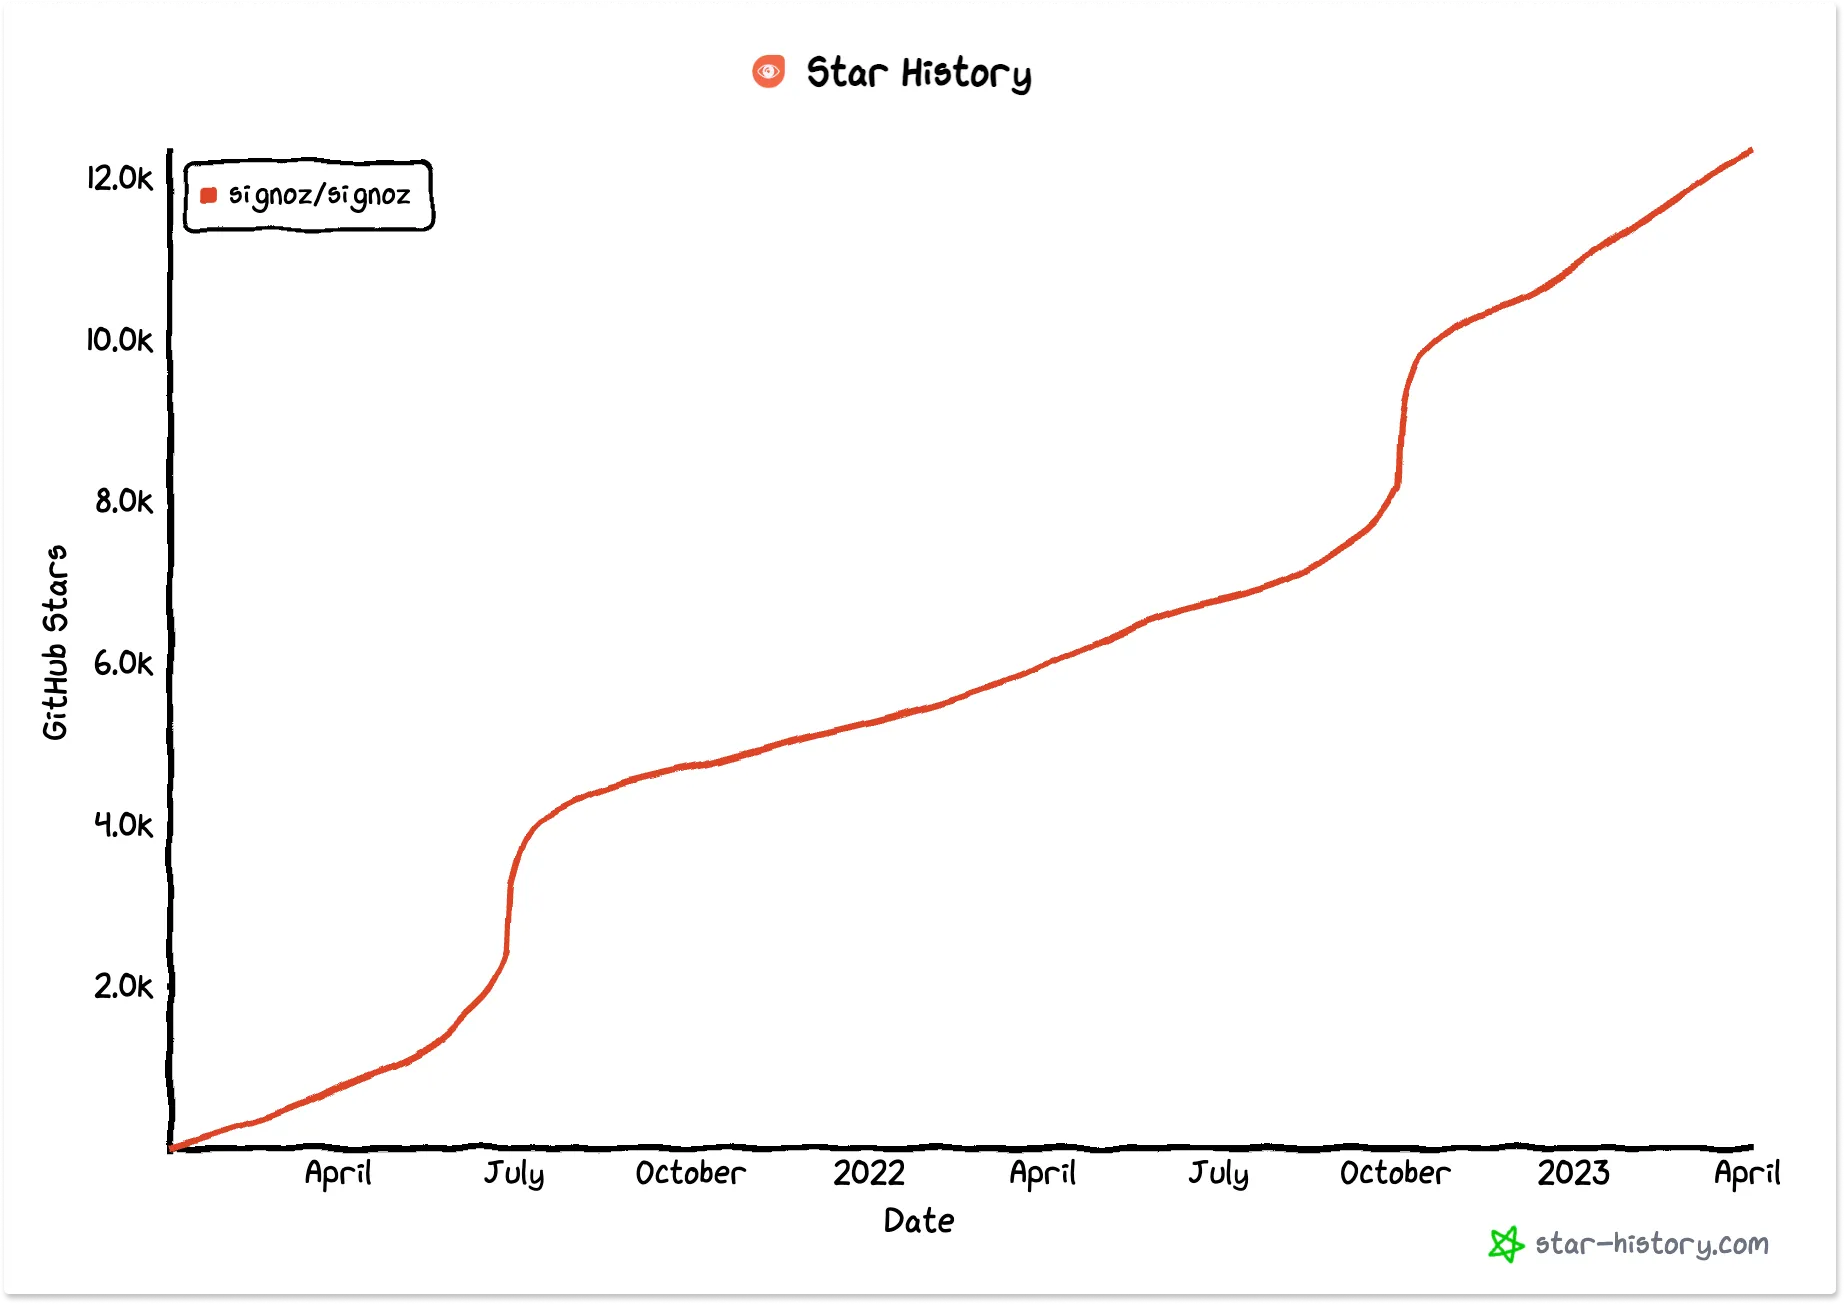
12,000+ GitHub stars and counting
We recently crossed 12,000+ GitHub stars and are so grateful for it. The need for open source observability has resonated well in the developer community, and we continue to be amazed by their love and support.
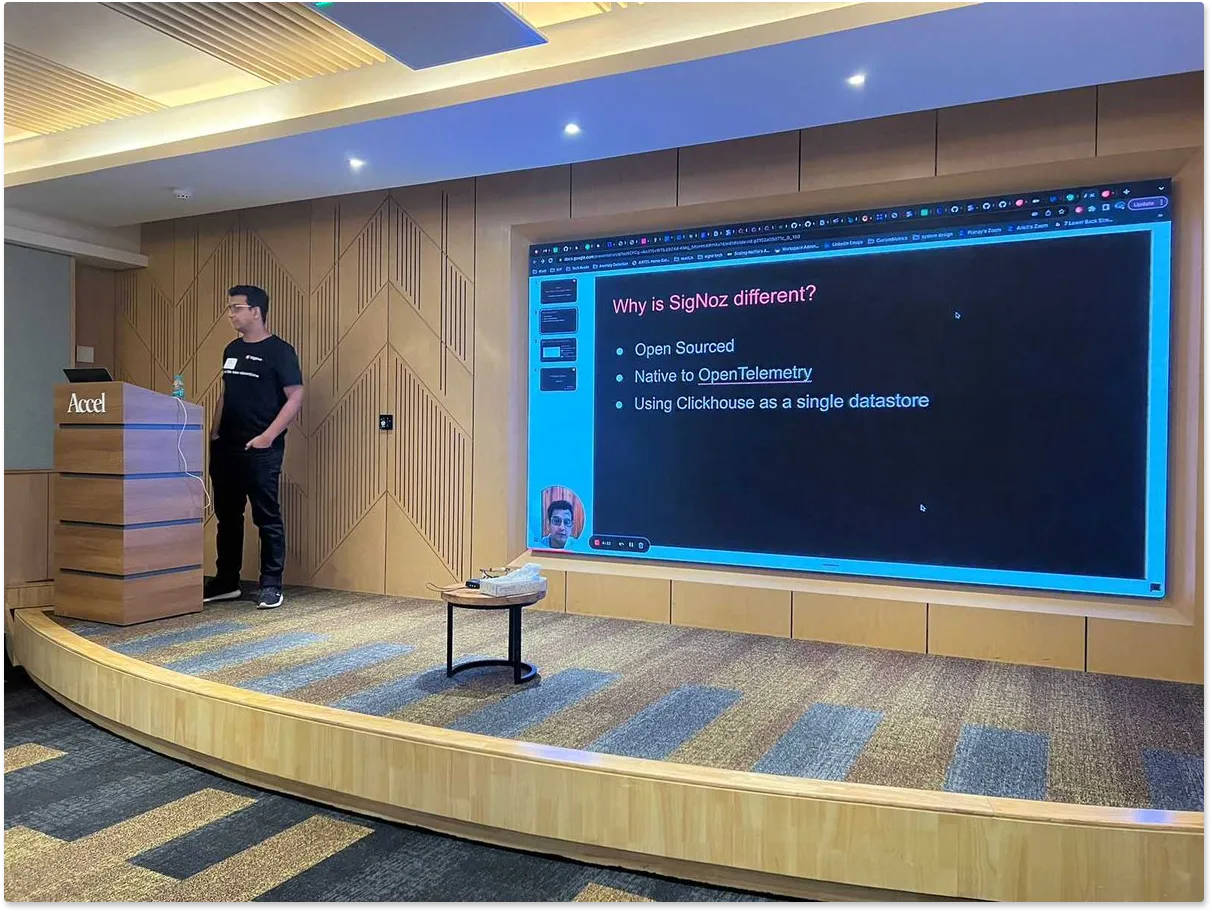
Observability-Focused Session by Accel India
We presented SigNoz at an Observability-focused session organized by Accel India in Bengaluru. Ankit Nayan talked about how we are democratizing observability through open source at SigNoz. It was great to see an engaged developer audience curious to learn more about how they can run their applications better with observability.
OpenTelemetry End-User Group APAC session
The team at SigNoz facilitates the monthly OpenTelemetry end-user group discussions for the APAC region. The OTel end-user group discussion is a place where you can discuss challenges related to OpenTelemetry implementations and learn from other OpenTelemetry users in a vendor-neutral space.
You can find highlights from the APAC and other sessions here.
Becoming the Developer’s choice for an Observability Stack
It’s great to see the community adoption of SigNoz has made it a top choice for an observability backend. Self-serve infrastructure providers like Argonaut have created integrations on their platform to enable observability for their users with SigNoz.
Contributor Highlight
Every month, contributors from our community help make SigNoz better. We want to thank the following contributors who made contributions to SigNoz last month 🤗


From the Blog
Monitoring Redis for performance issues is critical. Redis is famous for its low-latency response while serving a large number of queries. There are certain key metrics that you can monitor to keep track of your Redis instance performance.
Read our guide on monitoring Redis with OpenTelemetry and SigNoz.
Redis Monitoring with OpenTelemetry and SigNoz
Thank you for taking out the time to read this issue :) If you have any feedback or want any changes to the format, please create an issue.
Feel free to join our slack community and say hi! 👋