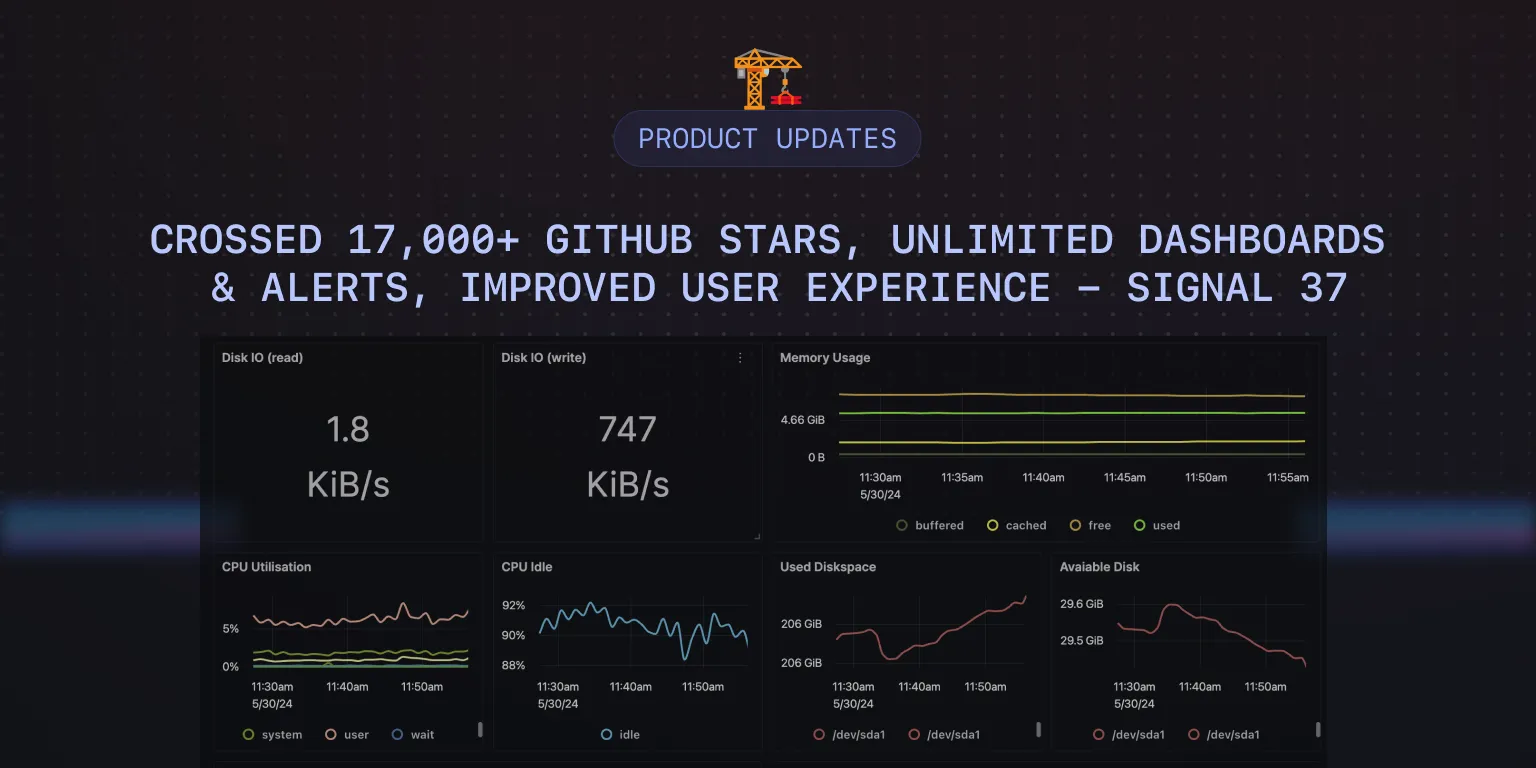
Crossed 17,000+ Github stars, unlimited dashboards & alerts, improved user experience - SigNal 37
Outcomes are what count; don’t let good process excuse bad results
-Sam Altman
Welcome to SigNal 37, the 37th edition of our monthly product newsletter! We crossed 17,000+ Github stars for our open source project. We’ve enhanced our Dashboards UX and incorporated feedback from users in different areas of our product.
Let’s see what humans of SigNoz were up to in the month of May 2024.
What we shipped?
Latest release: v0.46.0
Previous release: v0.45.0
Unlimited dashboards and alerts in the community version
We have enabled unlimited dashboards and alerts in the community version of SigNoz to make it more accessible to engineering teams. We want to provide a great user experience to our open-source users, and unlimited dashboards and alerts will help them set up and monitor their applications effectively.
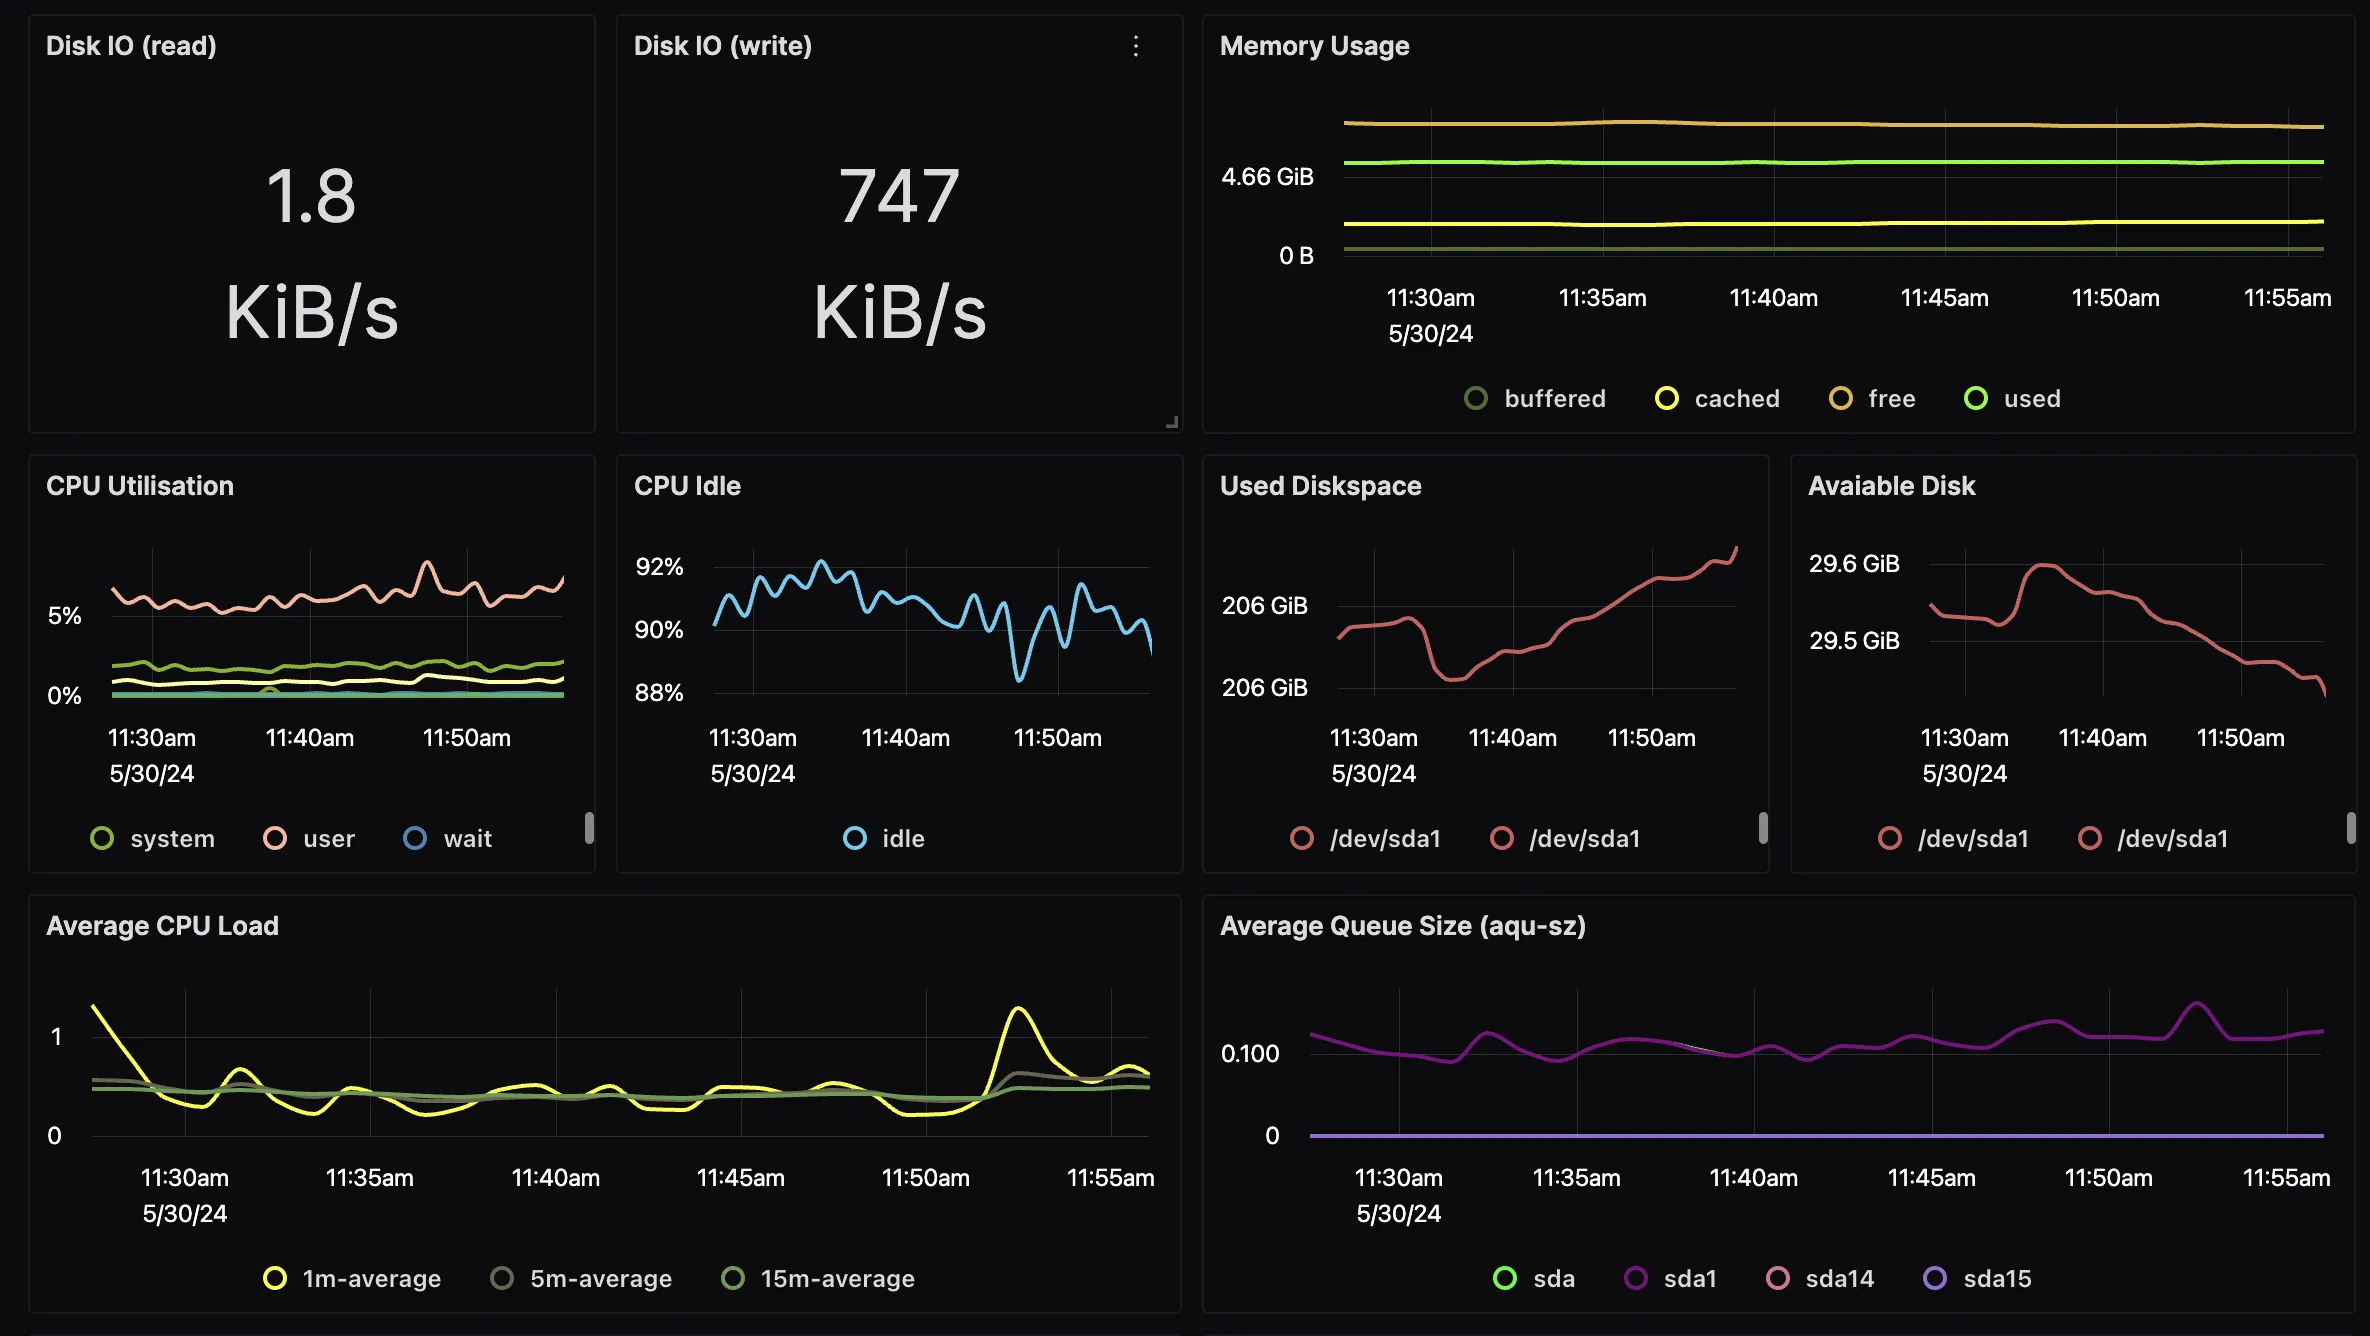
Create new sections with collapsable rows for dashboards
We have improved the user experience of dashboards by enabling new sections in dashboards. Now, you can create multiple sections in your dashboard and collapse them for a better browsing experience.
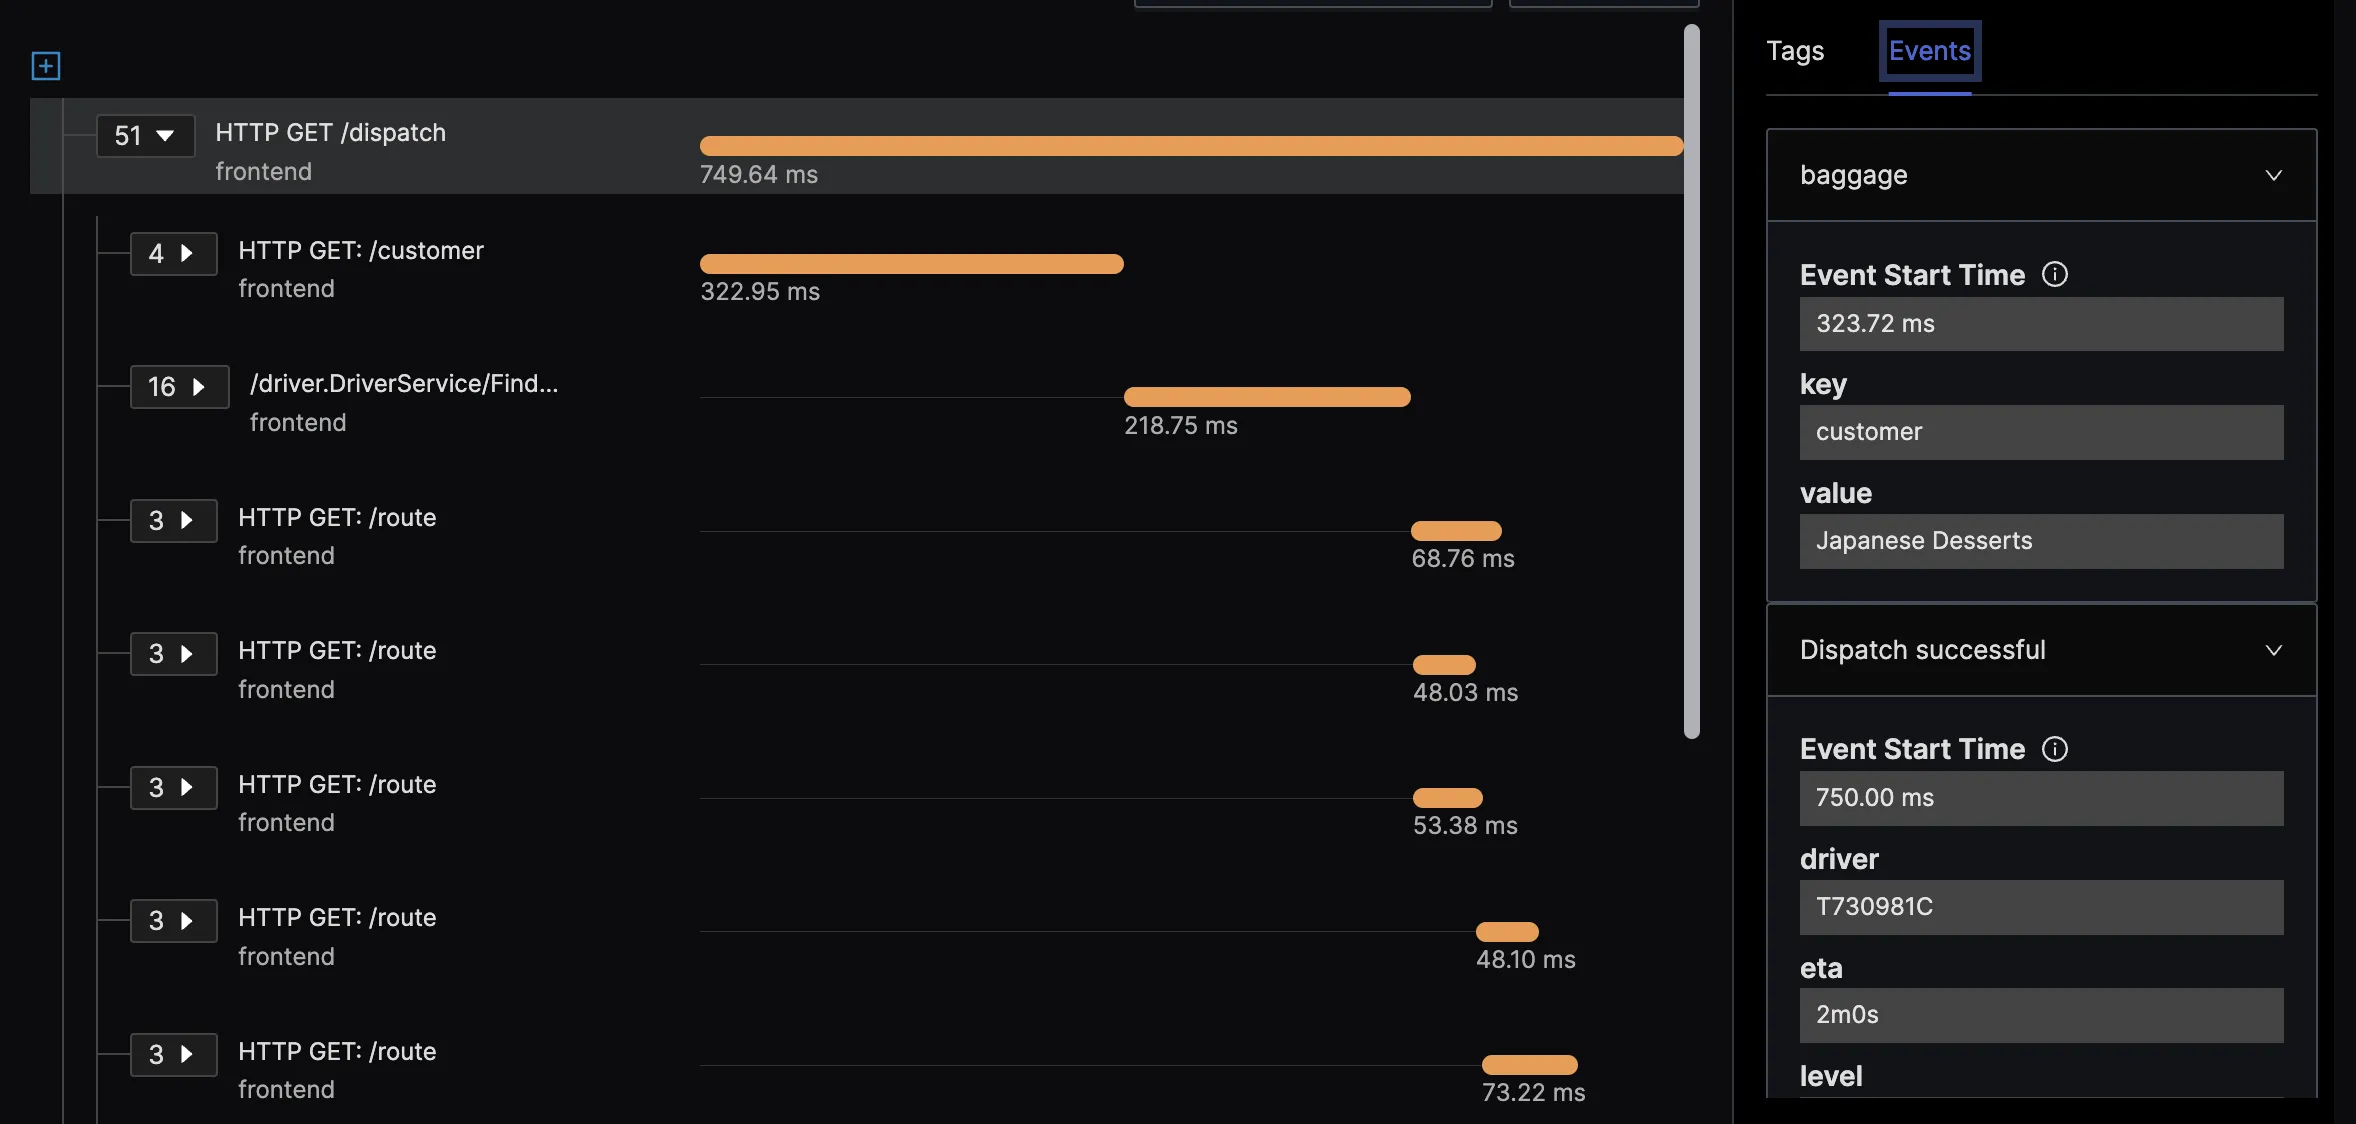
Sorted tags and events in Trace Detail Page
The tags and events in the Trace detail page are now sorted alphabetically. Tags and events help you get more context on operations in your application.
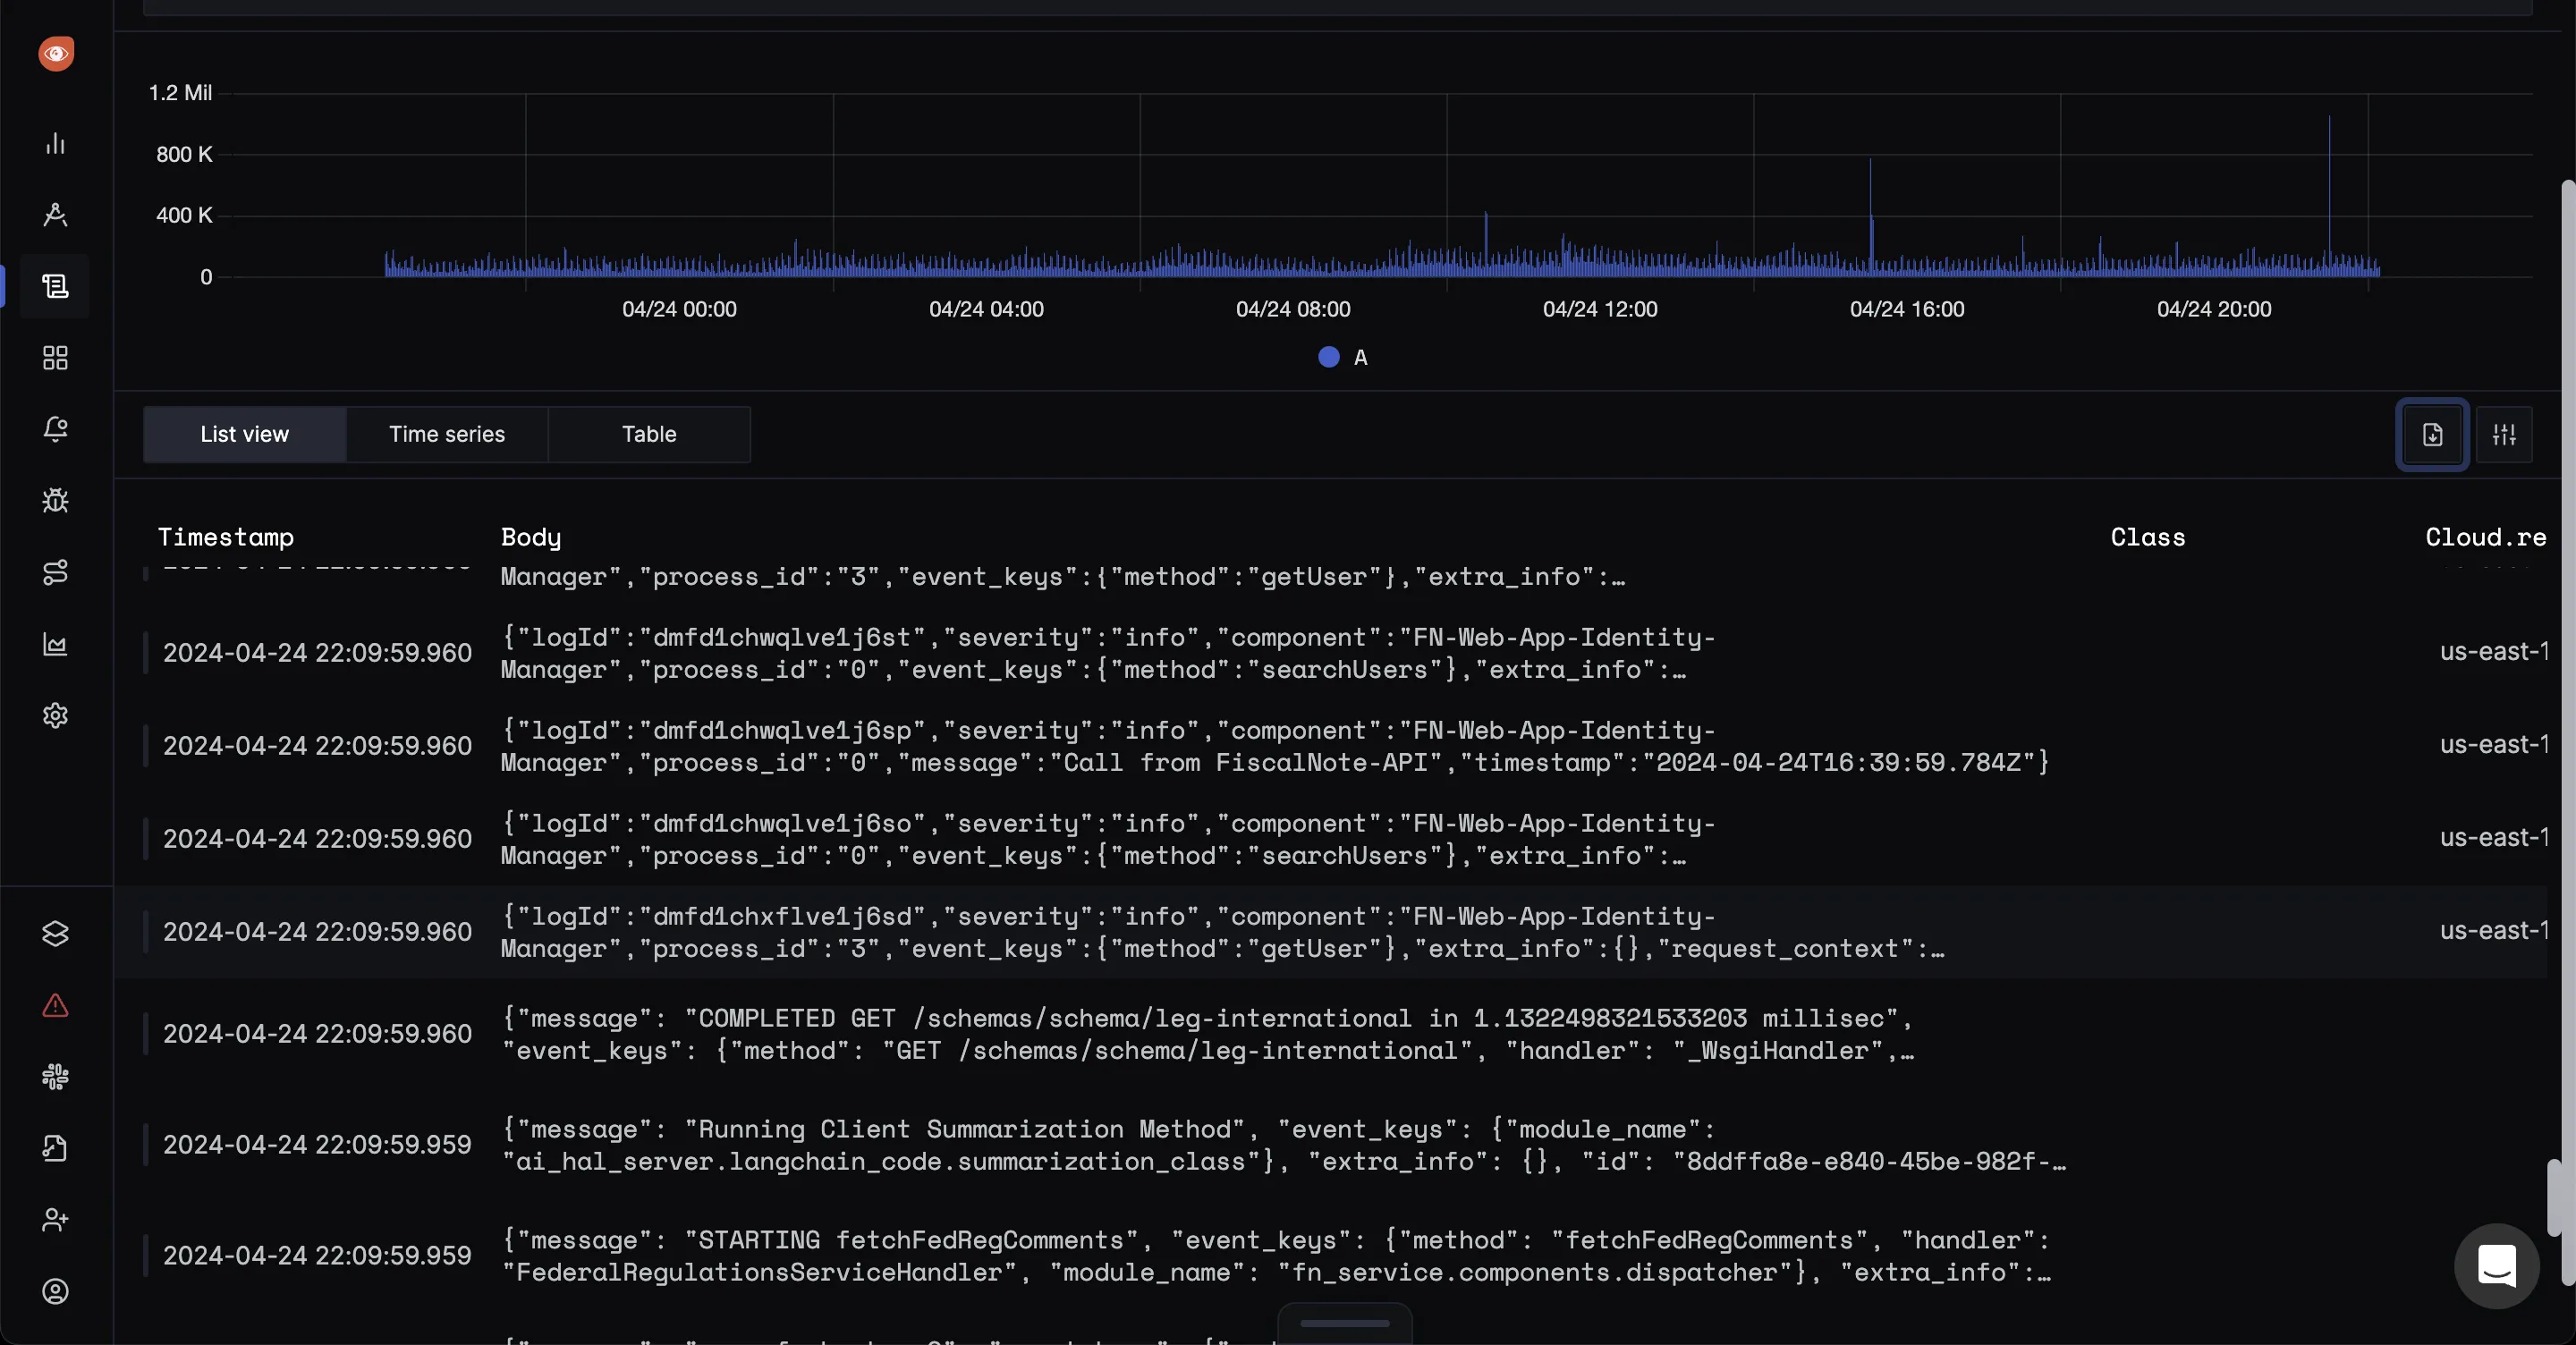
Show milliseconds in timestamp in logs view
We have added milliseconds in the timestamp for the logs view for those who want higher accuracy in understanding when their logs were emitted.
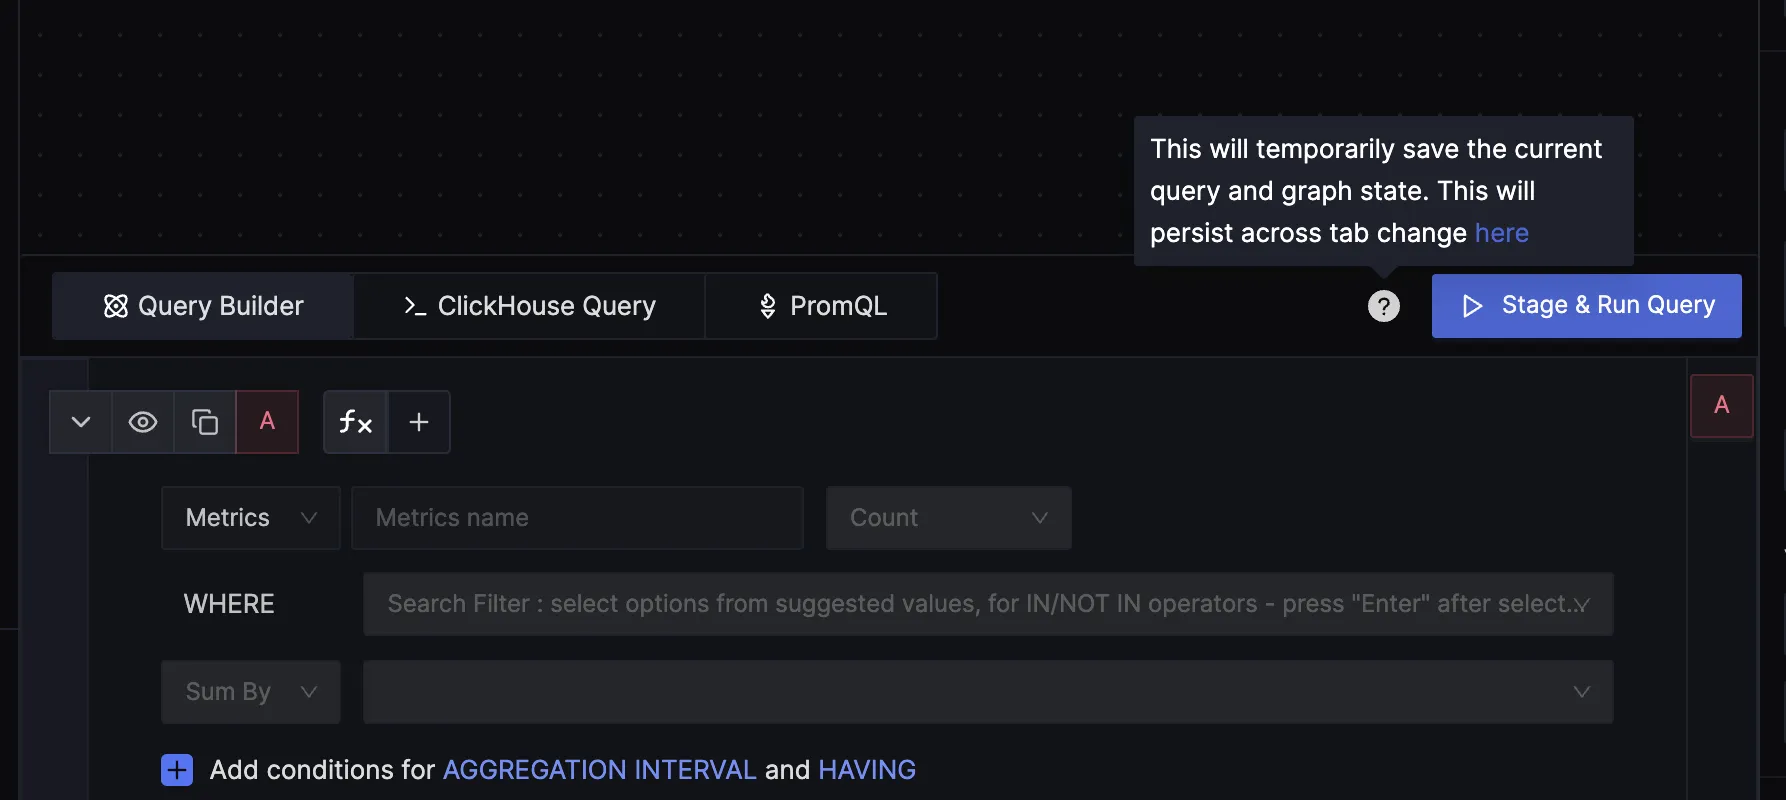
Improving User experience with in-product help texts
We have added help texts and linked our product docs to a lot of places inside the product to help our users understand SigNoz features better.
Scaling OpenTelemetry Collectors using Kafka
You can introduce Kafka as a buffering layer between your OTel collectors and the backend to handle data spikes and ensure reliable data transmission. The setup involves configuring a fleet of horizontally scalable OTel collectors, known as Gateway OTel collectors, to receive telemetry data from various sources.
These collectors then use a Kafka exporter to send the data to a Kafka cluster. Kafka acts as a queuing system, providing a buffer that can absorb sudden spikes in data, thus preventing data loss and allowing the system to handle increased load without overloading the OTel collectors. Additionally, Kafka enables advanced processing capabilities like tail-based sampling, making it easier to manage and process large volumes of telemetry data efficiently.
Learn more about scaling OpenTelemetry collectors with Kafka from the video below.
SigNoz News
Crossed 17,000+ Github stars
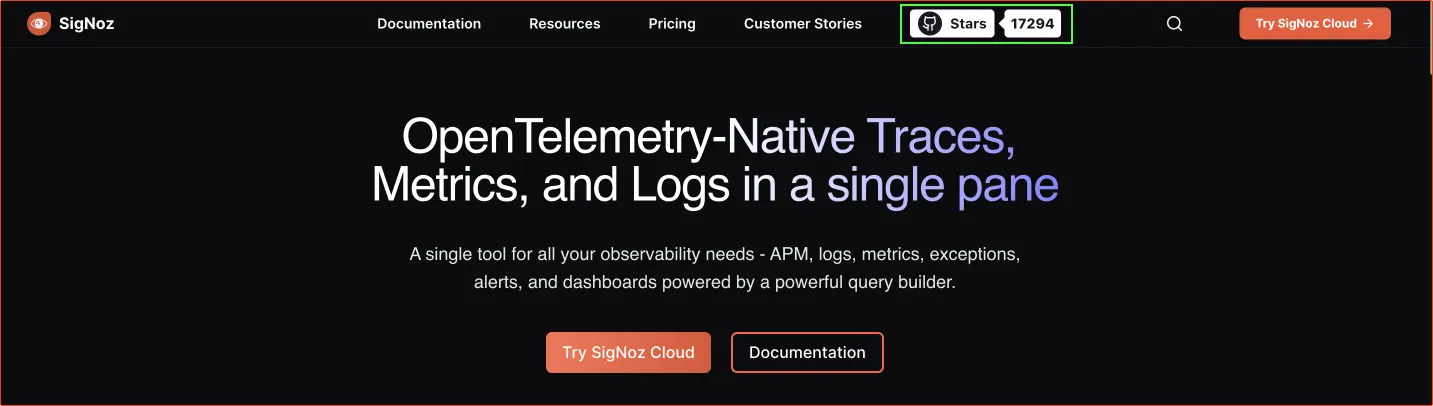
We have crossed 17,000+ GitHub stars. At SigNoz, we’re working towards democratizing observability for engineering teams of all sizes, and we are getting closer to this vision every day. Thousands of companies now use SigNoz for observability, and it’s great to see the impact of the code we ship.
We’re thankful to the developer community for their continued support of our open-source project.
We are working on new innovative features and a much more improved, sleek, user-friendly experience in the coming months. If you’re interested, you can check out our GitHub repo here:
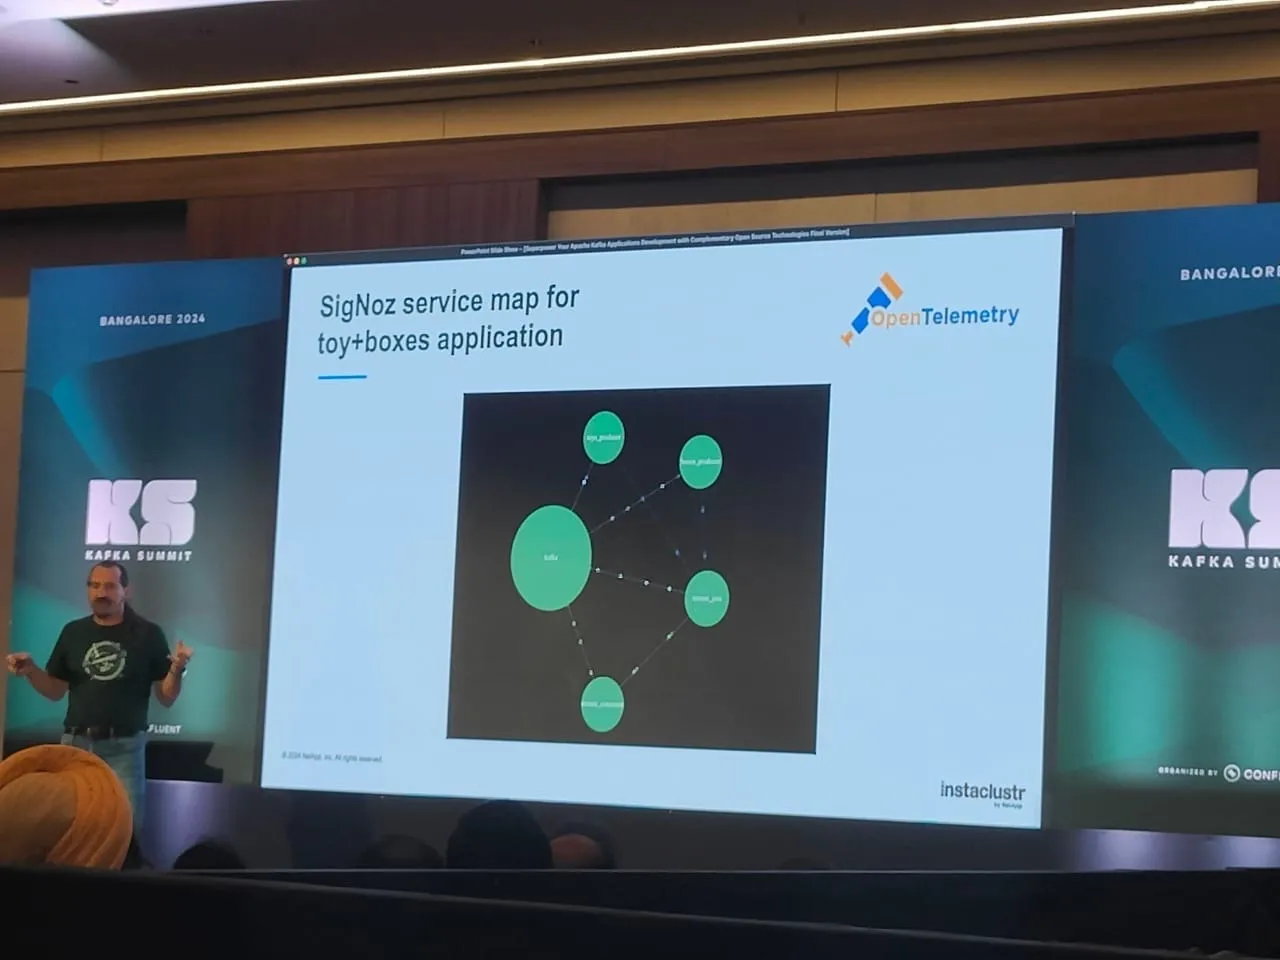
Github - SigNoz/signozSigNoz at the Kafka Summit, Bangalore
We attended the Kafka Summit in Bangalore and were pleased to see mentions of SigNoz in different presentations.
SigNoz at the AWS Summit
Our new team member, Shivanshu is a CNCF ambassador and works passionately for the open-source ecosystem. He attended the AWS summit at Bengaluru and engaged with the community with questions on SigNoz and OpenTelemetry.

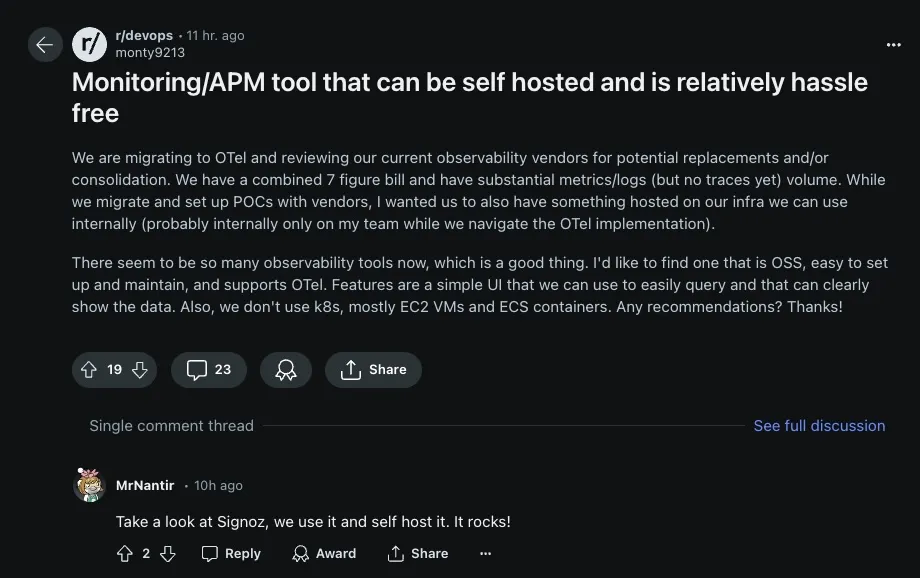
A monitoring tool that is self-hosted, supports OpenTelemetry and is hassle-free - SigNoz
We love getting organic mentions from our users. It’s great to see our users suggesting SigNoz as the tool of choice for observability.
If you’re looking for a hassle-free self-hosted observability solution, then look no further. With logs, metrics, and traces under a single pane of glass, SigNoz can be your one-stop observability solution.
From the Blog
Spans are fundamental building blocks of distributed tracing. A single trace in distributed tracing consists of a series of tagged time intervals known as spans. Spans represent a logical unit of work in completing a user request or transaction.
Here’s an article explaining what spans are in the context of distributed tracing.
Spans - a key concept of distributed tracing
Thank you for taking out the time to read this issue :) If you have any feedback or want any changes to the format, please create an issue.
Feel free to join our Slack community and say hi! 👋