Top 15 Docker Container Monitoring tools in 2022
One of the easiest ways to see if the application running in our nodes is in an optimized state or not is by monitoring them. It is the last yet critical stage of any software development lifecycle. It opens up many possible improvements in your application, networking, IT automation, and other miscellaneous configurations. As we move towards microservice architecture, containerization and orchestration tools are rising.
Containers are special processes that run in isolation from other processes. As the word suggests, a container keeps the application ‘contained’ as a software package. This package includes the code, runtime dependencies, system tools and libraries, and configurations.
Most modern organizations use containers to build scalable applications.
Top 15 Tools for Docker Container monitoring
The most fundamental way to see how your containers are performing is by running docker stats from your terminal. It shows metrics like these.
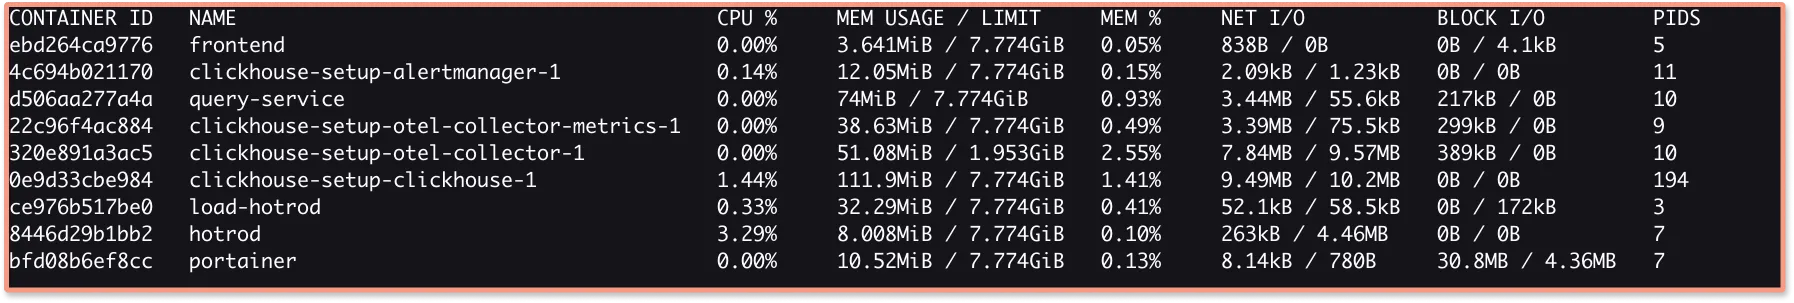
These metrics might be of some use in development and debugging but are not very user-friendly for production use-case. You won’t be able to determine the root cause of failures, understand usage patterns, usage peaks, etc.
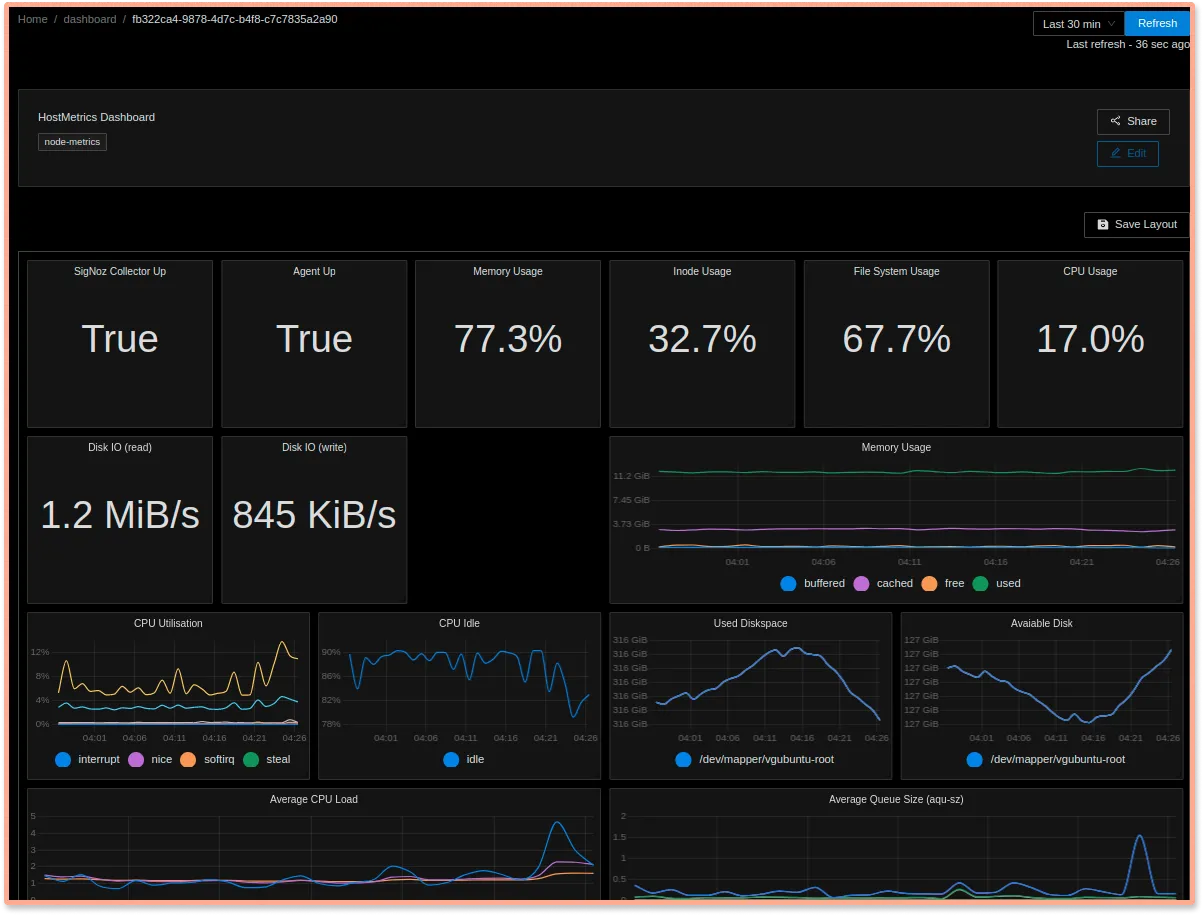
To better understand your application, you must be able to see patterns in your container performance easily. That’s where Docker container monitoring tools come into the picture.
Here’s a list of the top 15 monitoring tools that can help you monitor your container-based applications.
Here are our top choices of monitoring tools that can help you get better insights and may also help in the automation of workloads.
SigNoz
SigNoz is a full-stack open-source application monitoring tool. It is suited to monitor cloud-native applications based on distributed architecture like microservices and serverless. It is built to support OpenTelemetry natively. OpenTelemetry is an open source project under Cloud Native Computing Foundation that is becoming a world standard for instrumenting cloud-native applications.
SigNoz provides distributed tracing to track transactions across services. You can easily correlate your application and infrastructure metrics with traces, giving better insights to debug performance issues.
Prometheus + Grafana
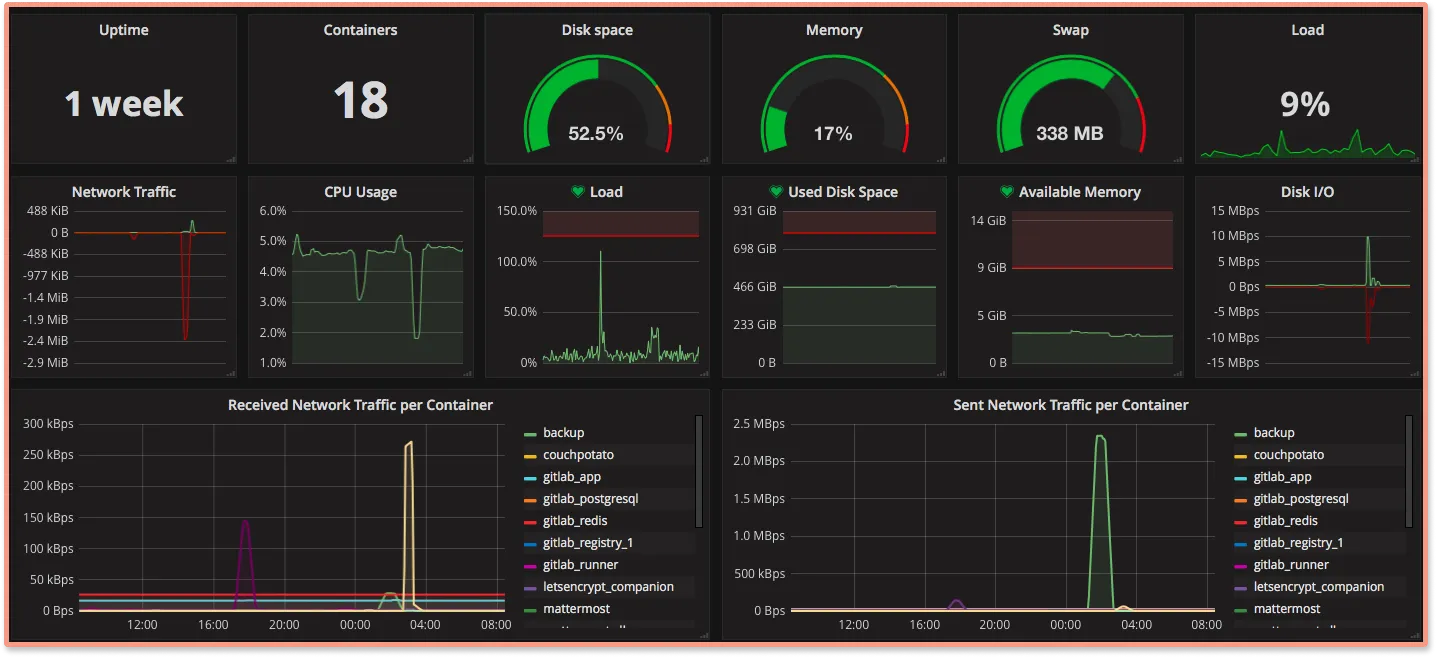
Prometheus enables you to fetch continuous time-series data as metrics from containers running on Docker, Kubernetes, and other platforms. It gathers metrics generated from your services and passes them to a data visualizer like Grafana.
Grafana is a well-known and widely used dashboard to show metrics collected from various sources. It enables you to visualize and analyze dashboards with better graphs.
ELK stack
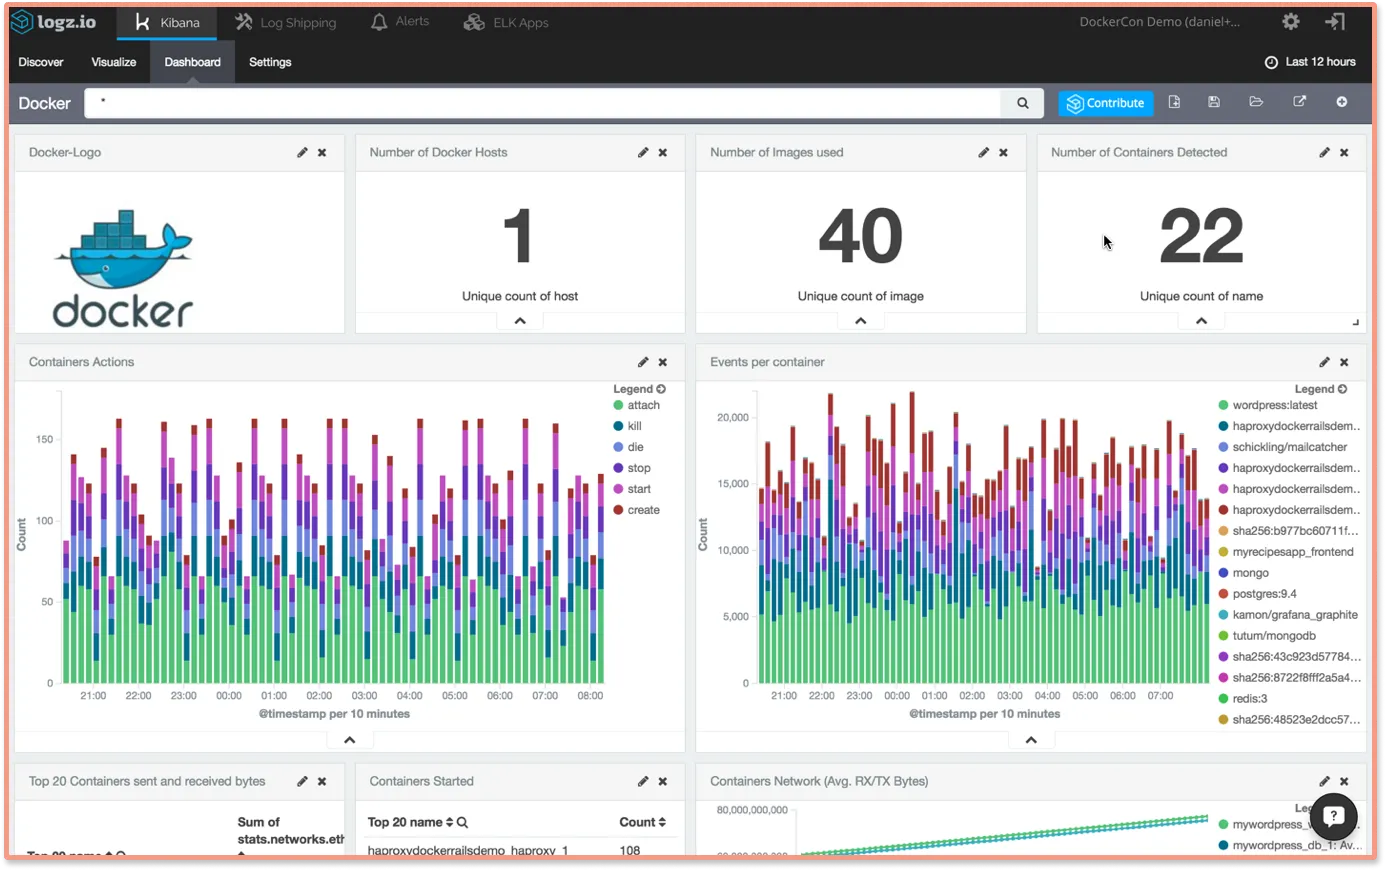
ELK Stack is a set of three open-source projects: Elasticsearch, Logstash, and Kibana. It is a full-stack and multi-stack monitoring tool. Along with containers, it also monitors the orchestration layer and its metadata.
Elasticsearch is an open-source, java-based, full-text search engine. It lets you store, search, and analyze raw data quickly and at scale.
Logstash is a server-side data processing pipeline that ingests data from multiple sources and processes it. It helps you collect and transform logs into a consistent format.
Kibana is a UI visualizer on top of elastic search. It helps in navigating through the ELK stack. Its visualization layers help you to manage your system in a user-friendly manner.
cAdvisor
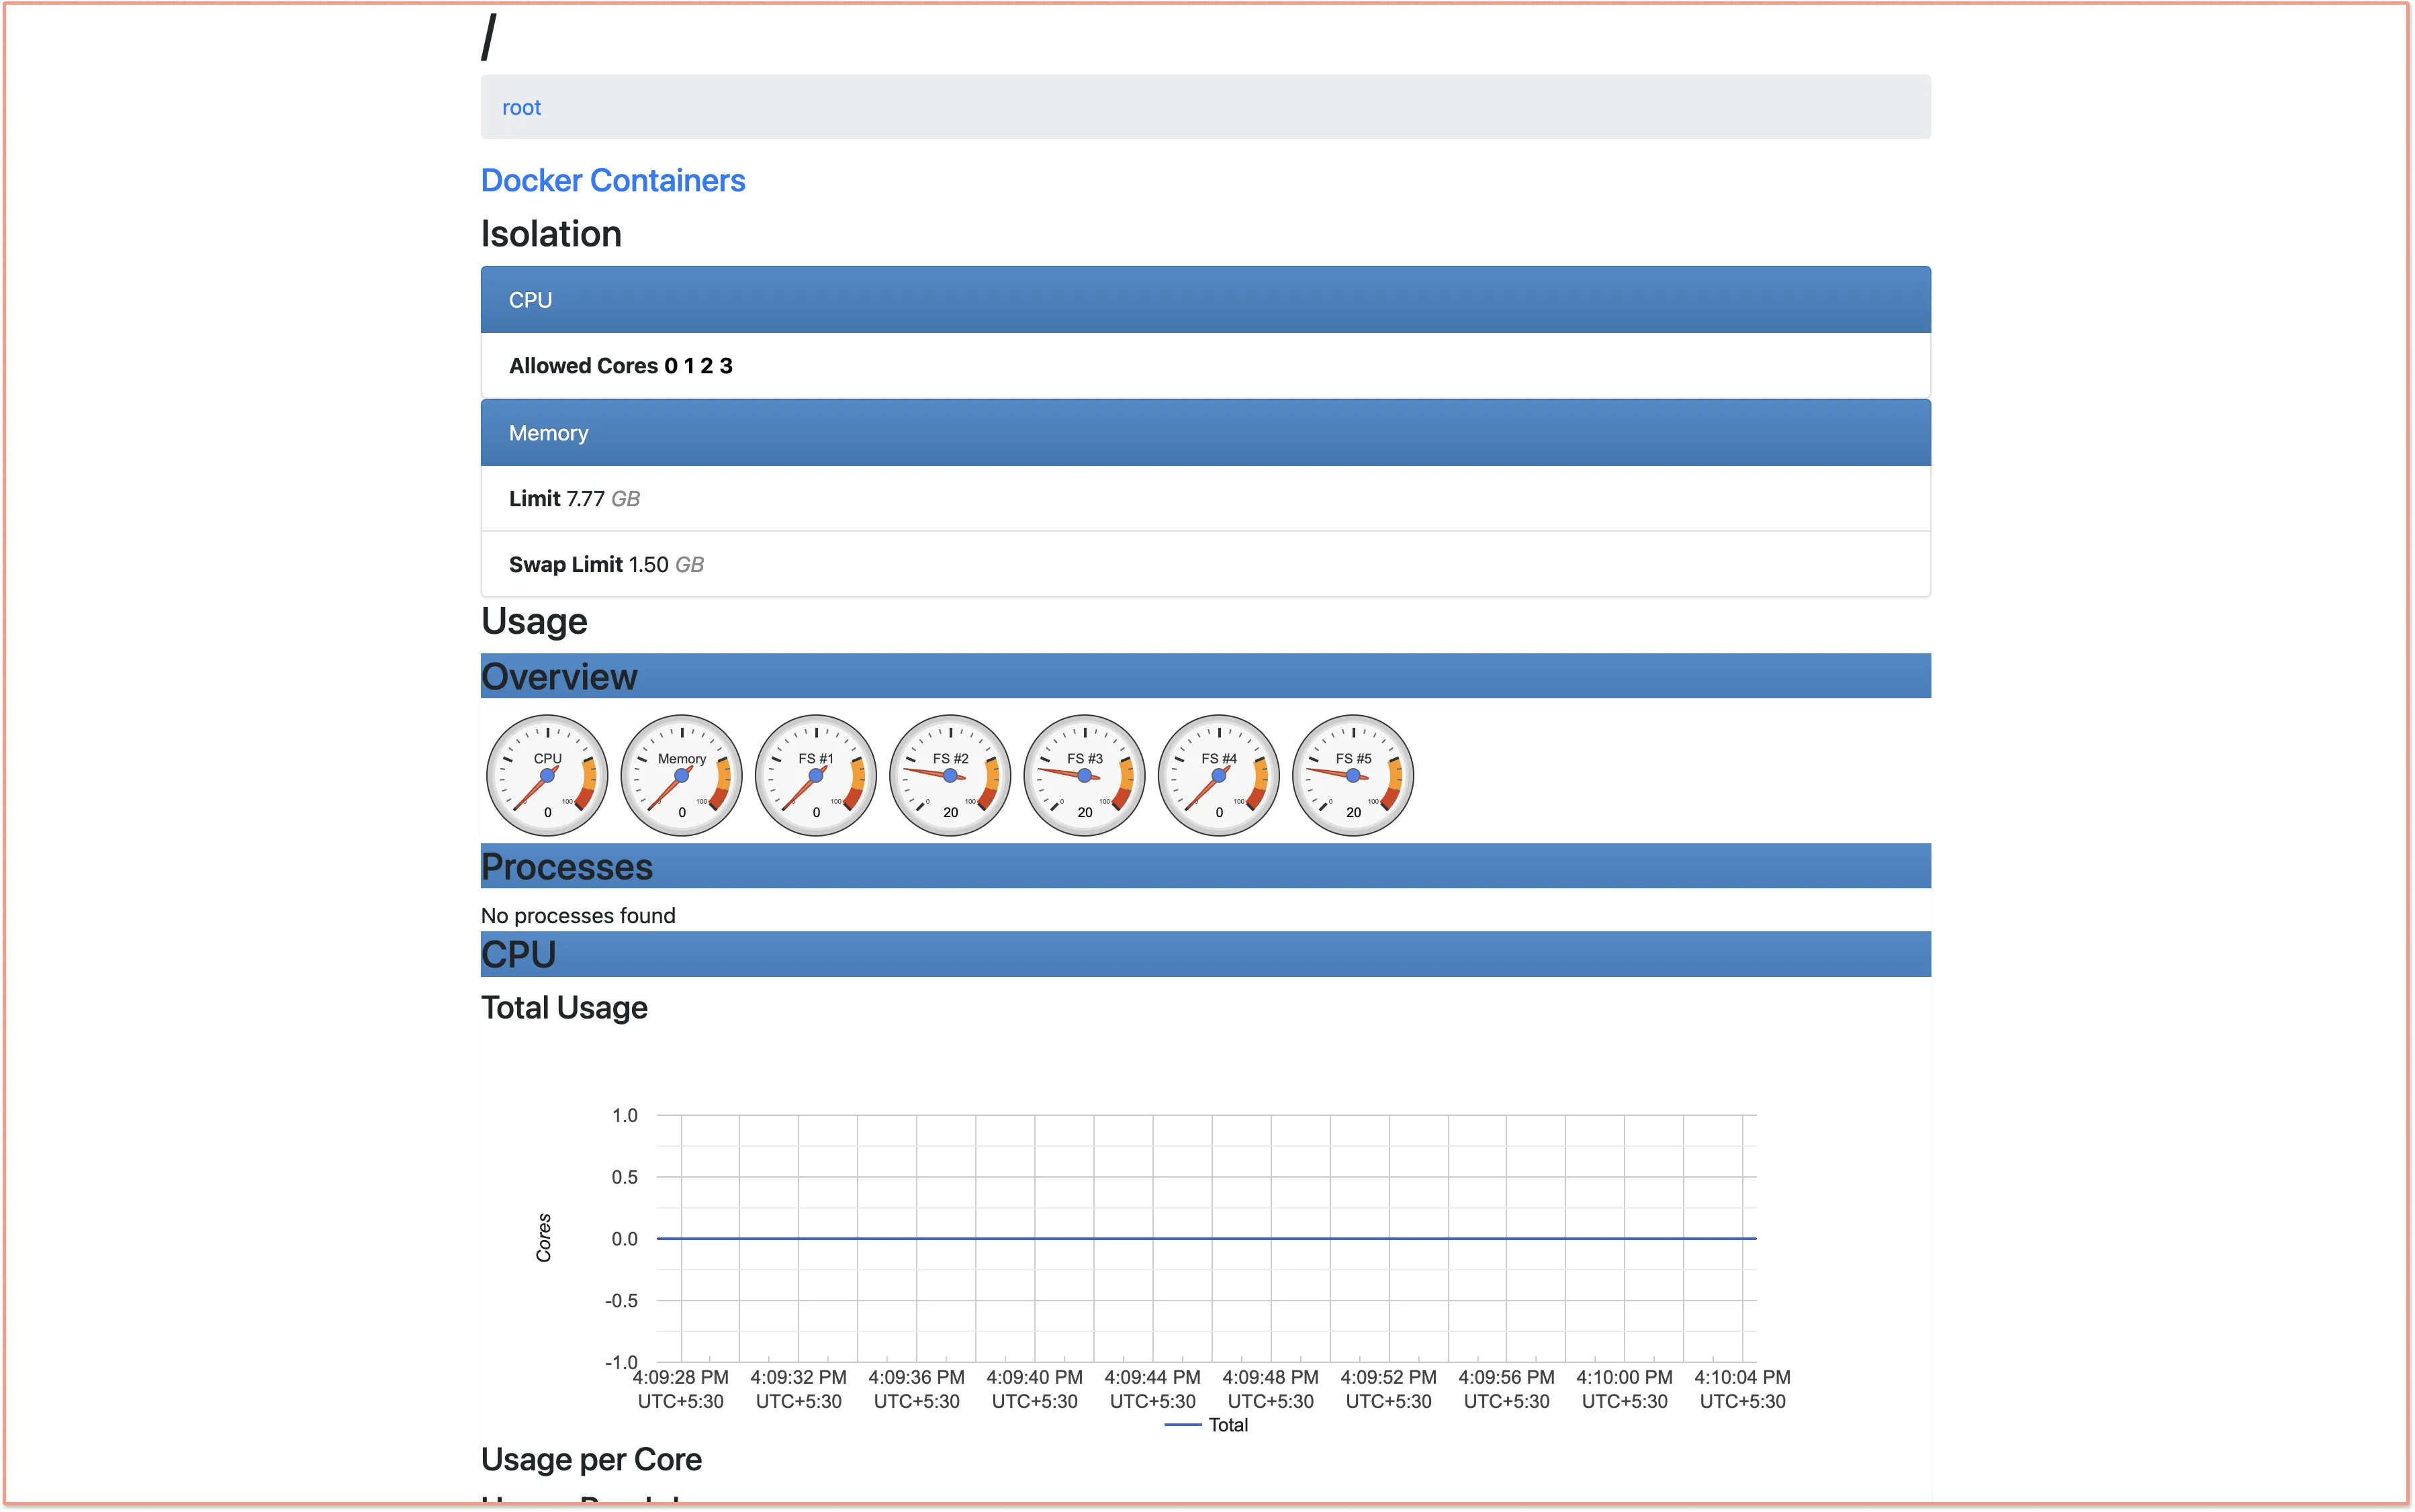
Container Advisor displays the resource and performance metrics of running containers. It is a container daemon that collects, aggregates, processes, and exports information about running containers.
These metrics can be routed to 3rd party apps for storage like InfluxDB, Prometheus, Elasticsearch, etc. Thereafter, the metrics can be visualized using the app Grafana.
Jaeger
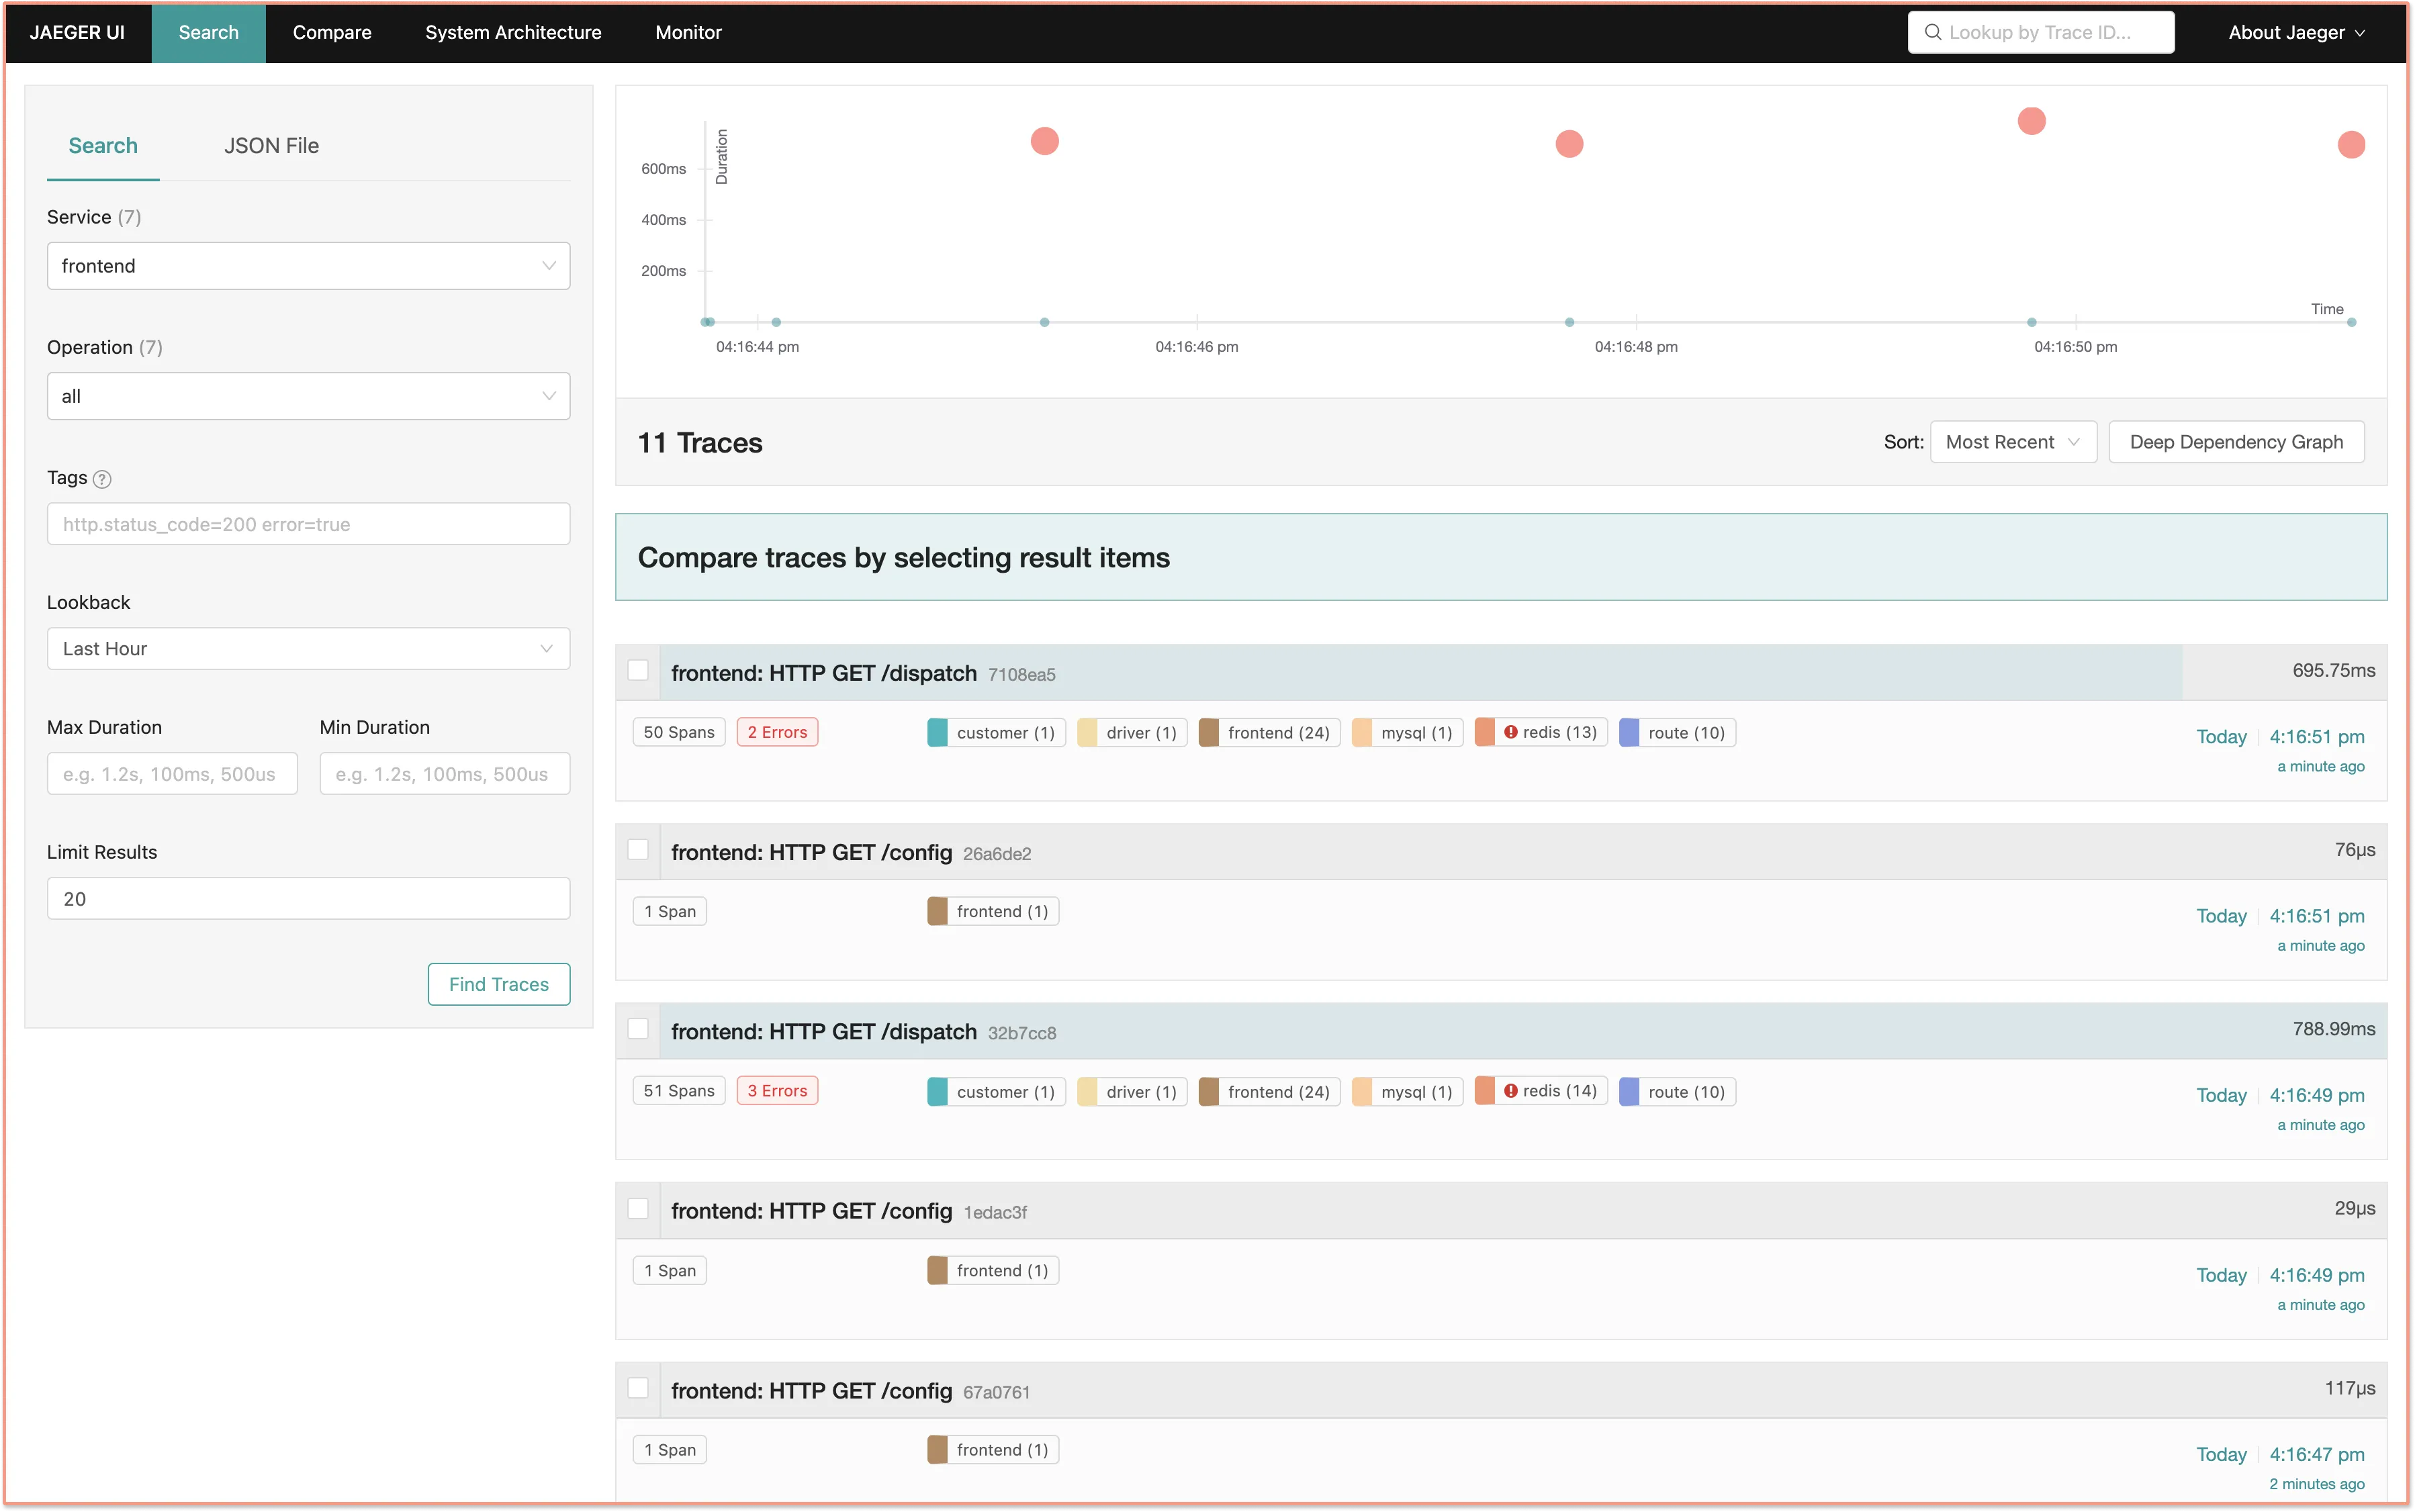
Jaeger is an open-source distributed tracing tool meant to monitor and troubleshoot transactions in distributed systems. It was built by teams at Uber and then open-sourced in 2015. Jaeger is a Cloud Native Computing Foundation graduate project.
You can use Jaeger to track transactions across multiple containers, nodes, and pods. The process of tracking transactions across different services is called distributed tracing.
SemaText
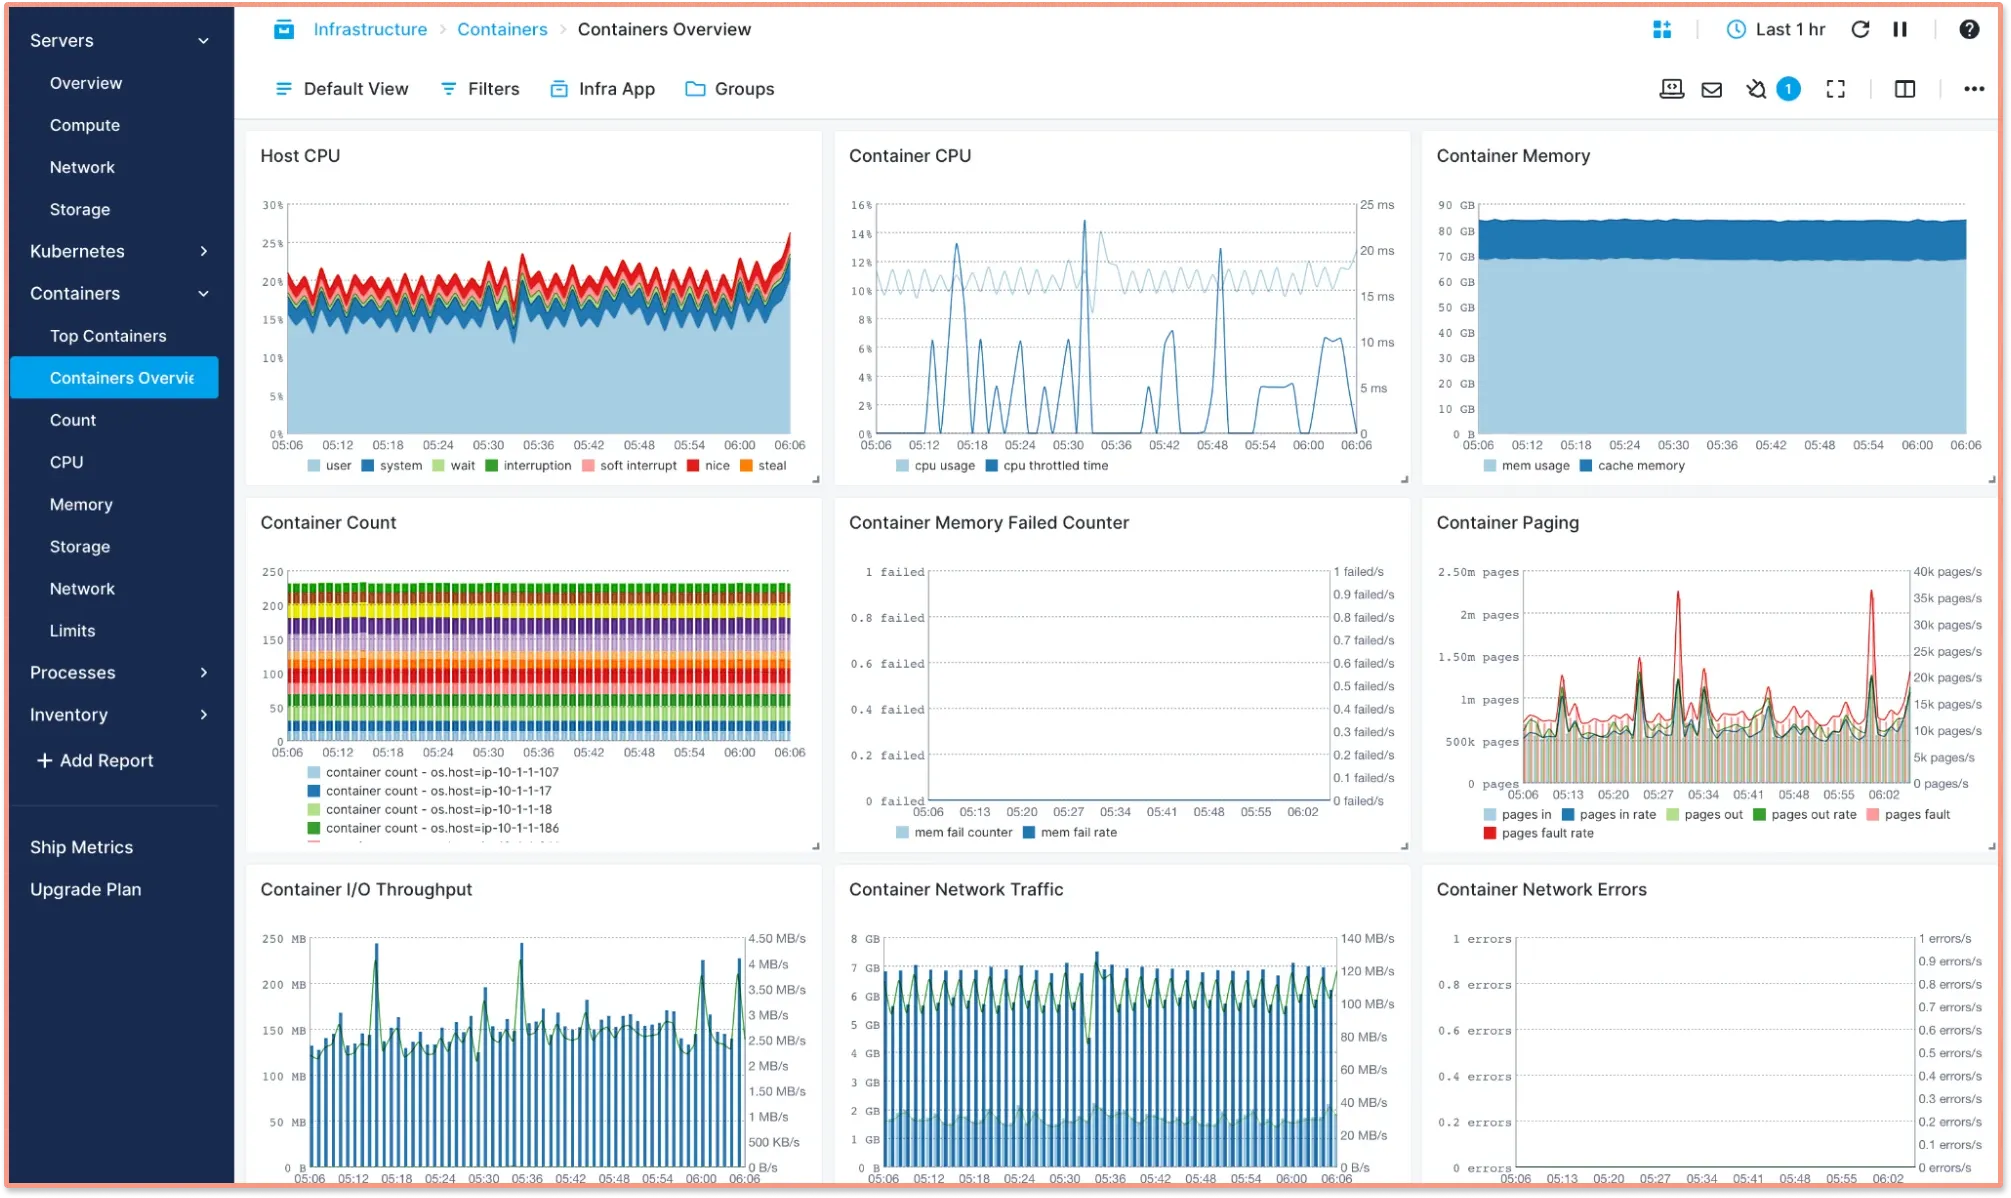
Sematext is an enterprise monitoring tool that provides solutions for IT systems and infrastructure monitoring and has docker monitoring capabilities. It provides a more comprehensive and easy-to-set-up monitoring dashboard for metrics, events, and logs, giving you actionable insights about containers and infrastructure.
Instana
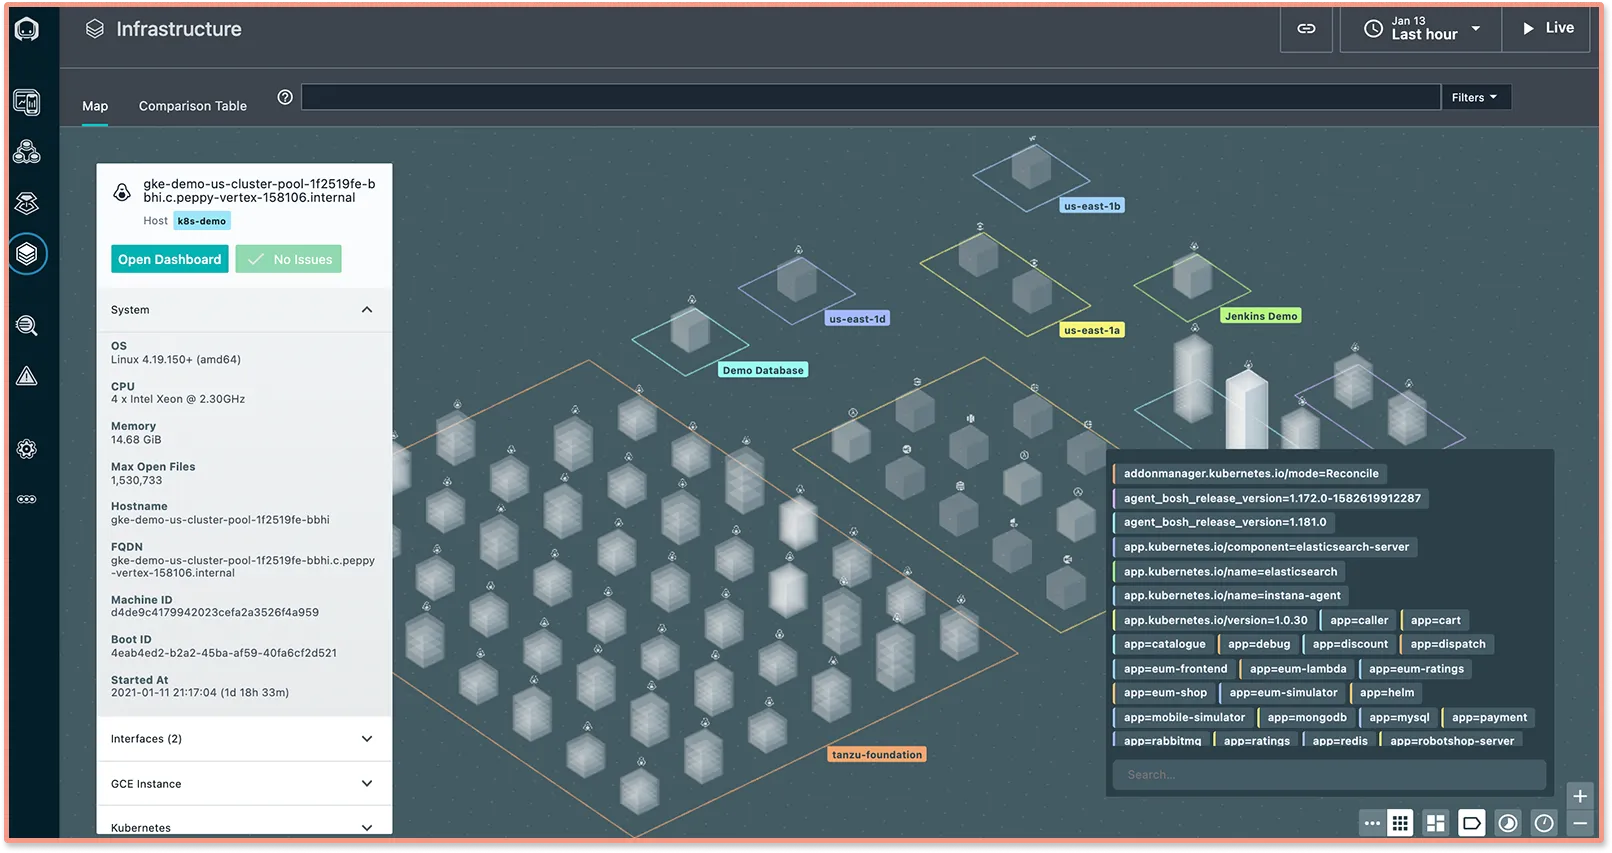
Instana is a full-stack, fully automated enterprise APM by IBM cloud. It is built for cloud-native, containerized, microservice architectures. You only need to install a single agent per host machine to monitor metrics in infrastructure. It automatically detects containers and Kubernetes clusters, which means no configuration is needed. This enables Instana to detect highly dynamic applications.
Dynatrace
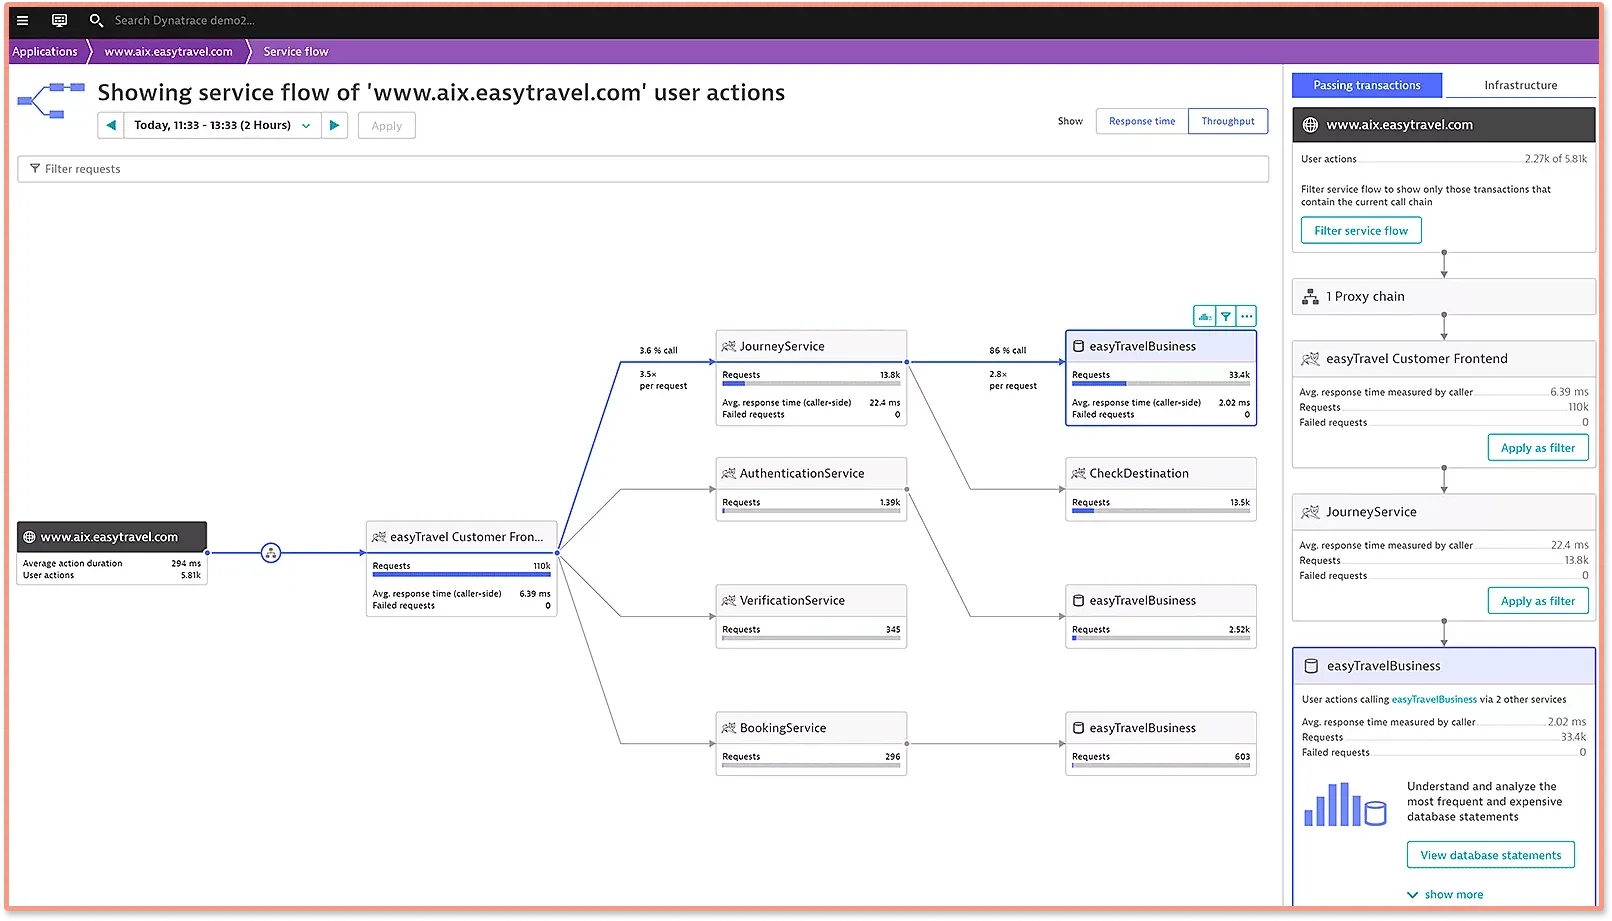
Dynatrace is an enterprise full-stack monitoring solution with container monitoring capabilities. It has both on-premises and cloud availability. It features auto-discovery with a clean, user-friendly UI.
It automatically discovers the container, which might be started, running, stopped, running, or being redeployed.
Appdynamics
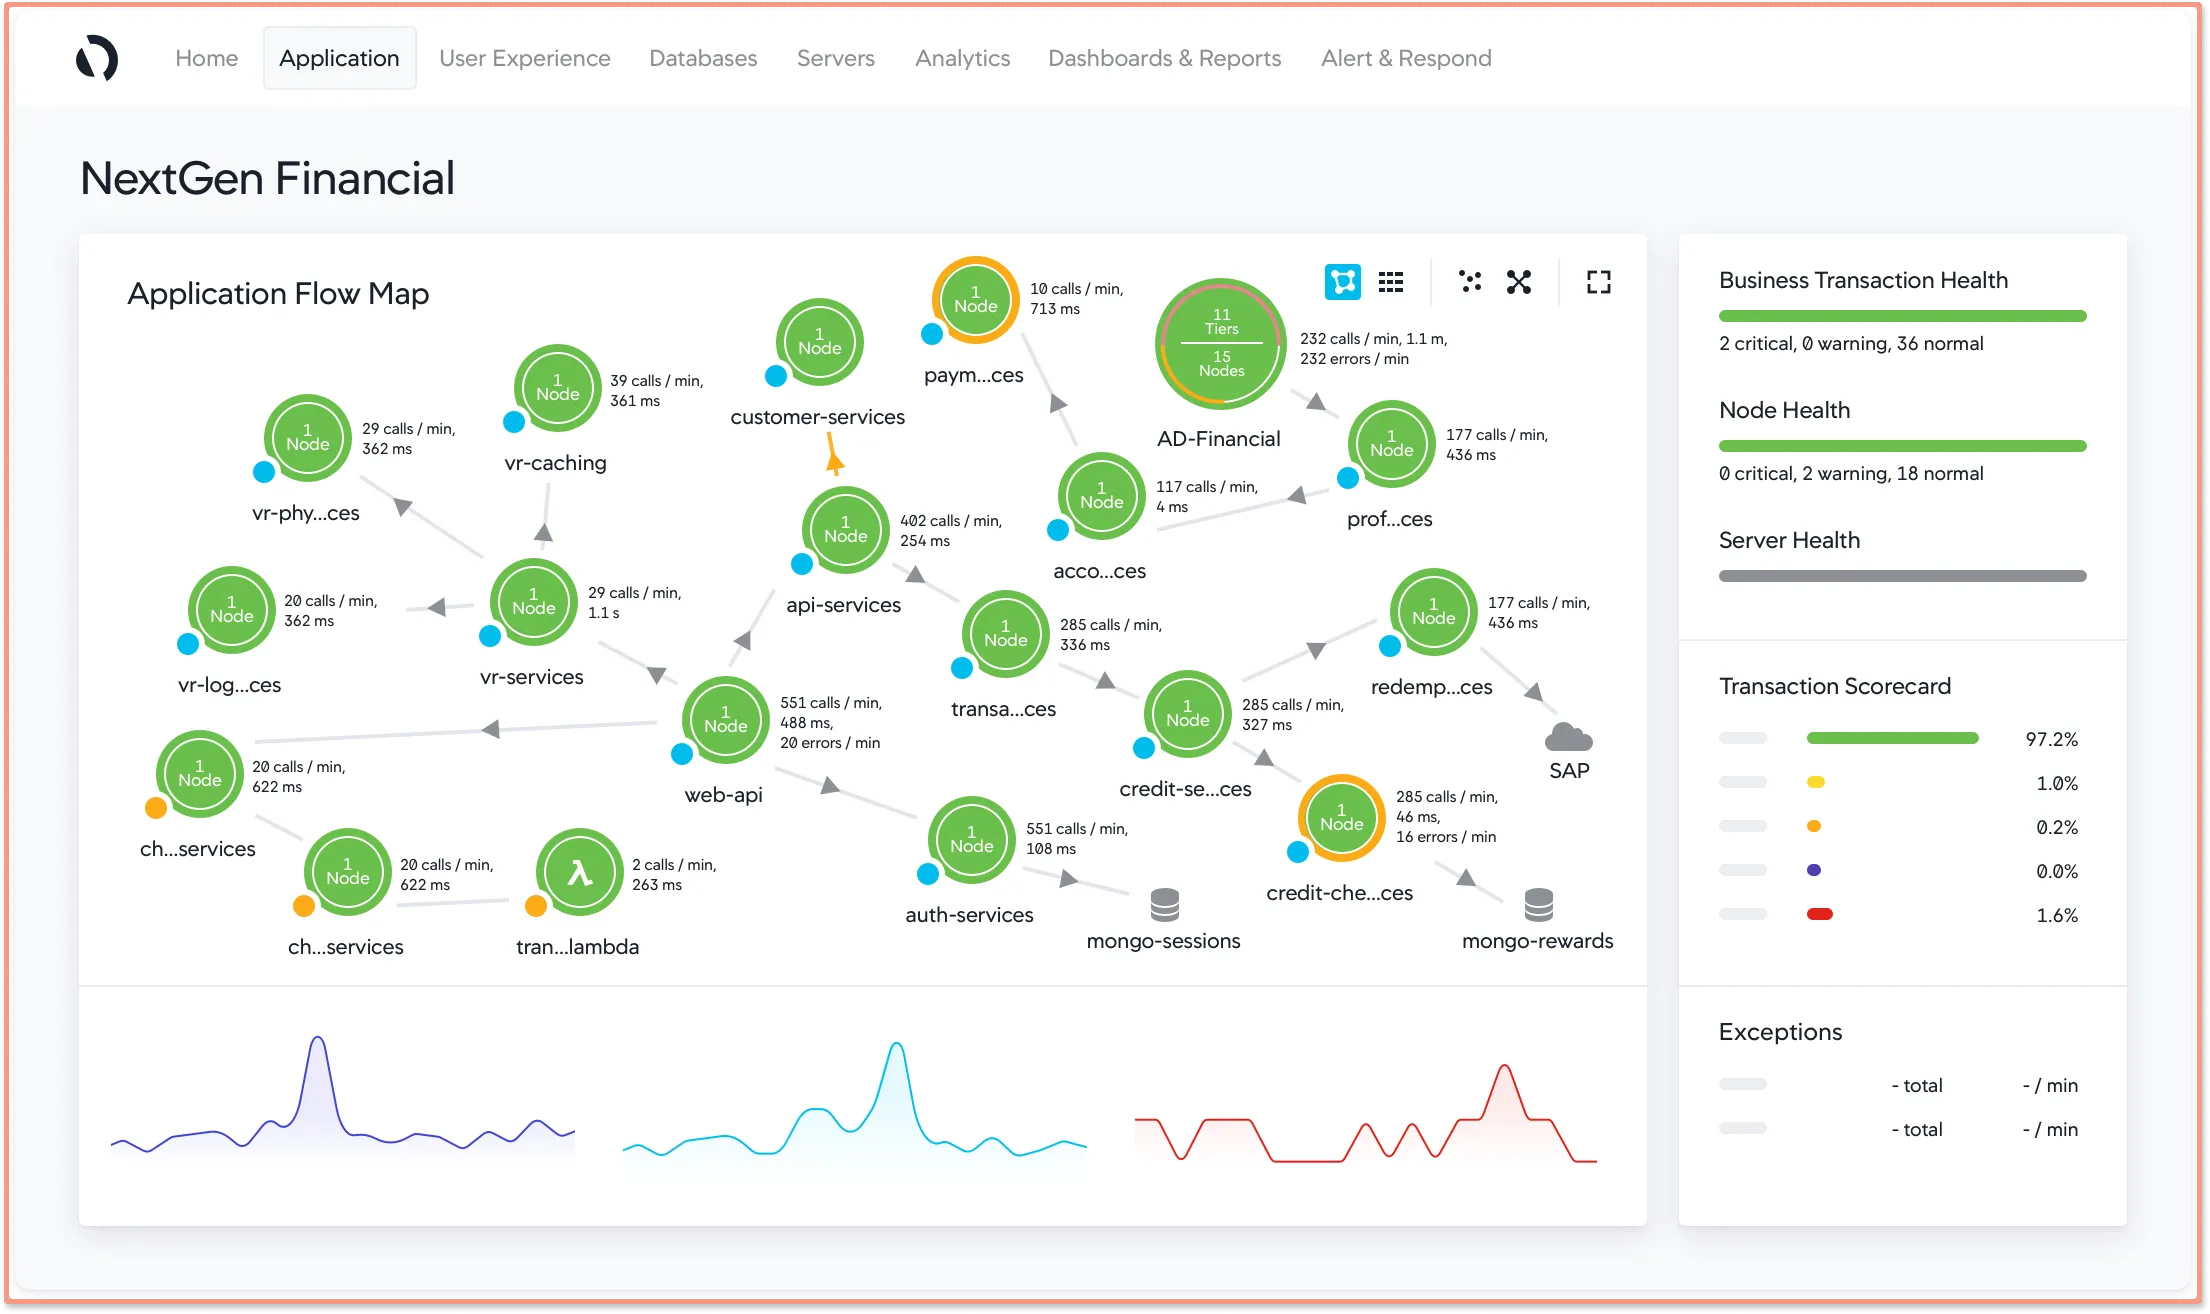
Appdynamics is an enterprise APM solution. It is a part of other Cisco projects. It supports cloud and on-premises monitoring. It monitors your infrastructure and gives code-level visibility, enabling you to pinpoint performance issues.
Appdynamics has one of the cleanest modern UI. It features heat maps, which give a much better overview of metrics in a single graph than multiple distributed graphs.
Datadog
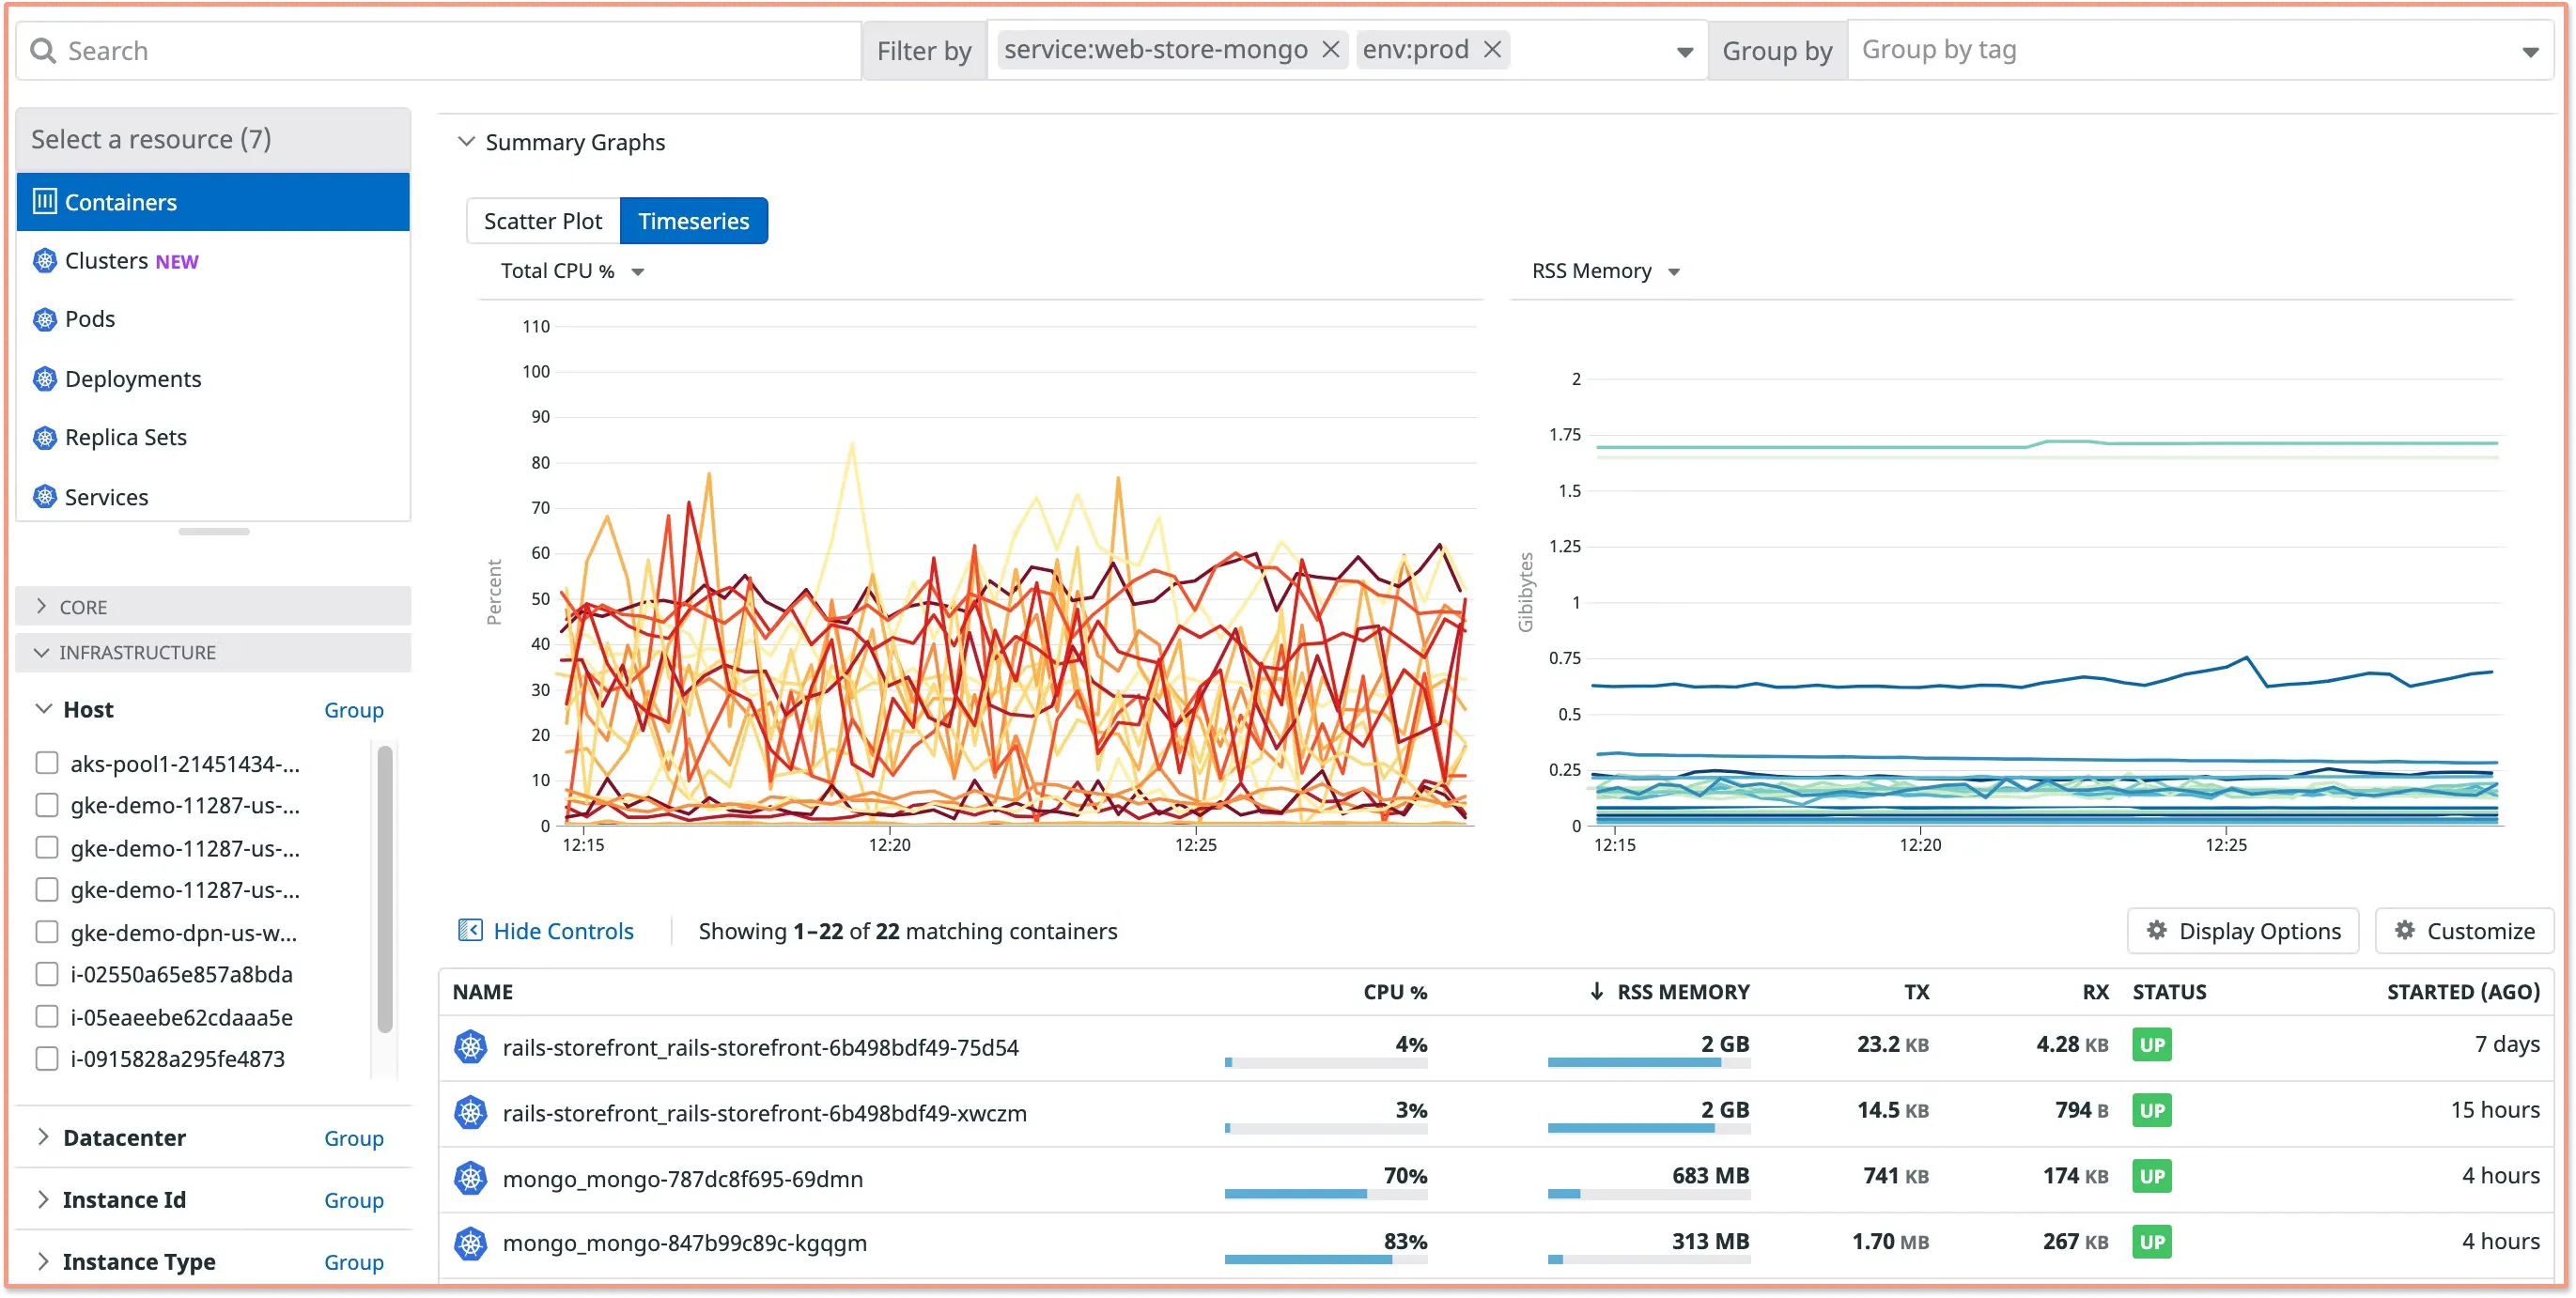
Datadog is an enterprise monitoring tool that provides a host of solutions like APM, infrastructure monitoring, real-user monitoring, etc. It enables automatic discovery of containers, infrastructure maps, real-time monitoring, and more. Infrastructure maps let you group containers under various parameters.
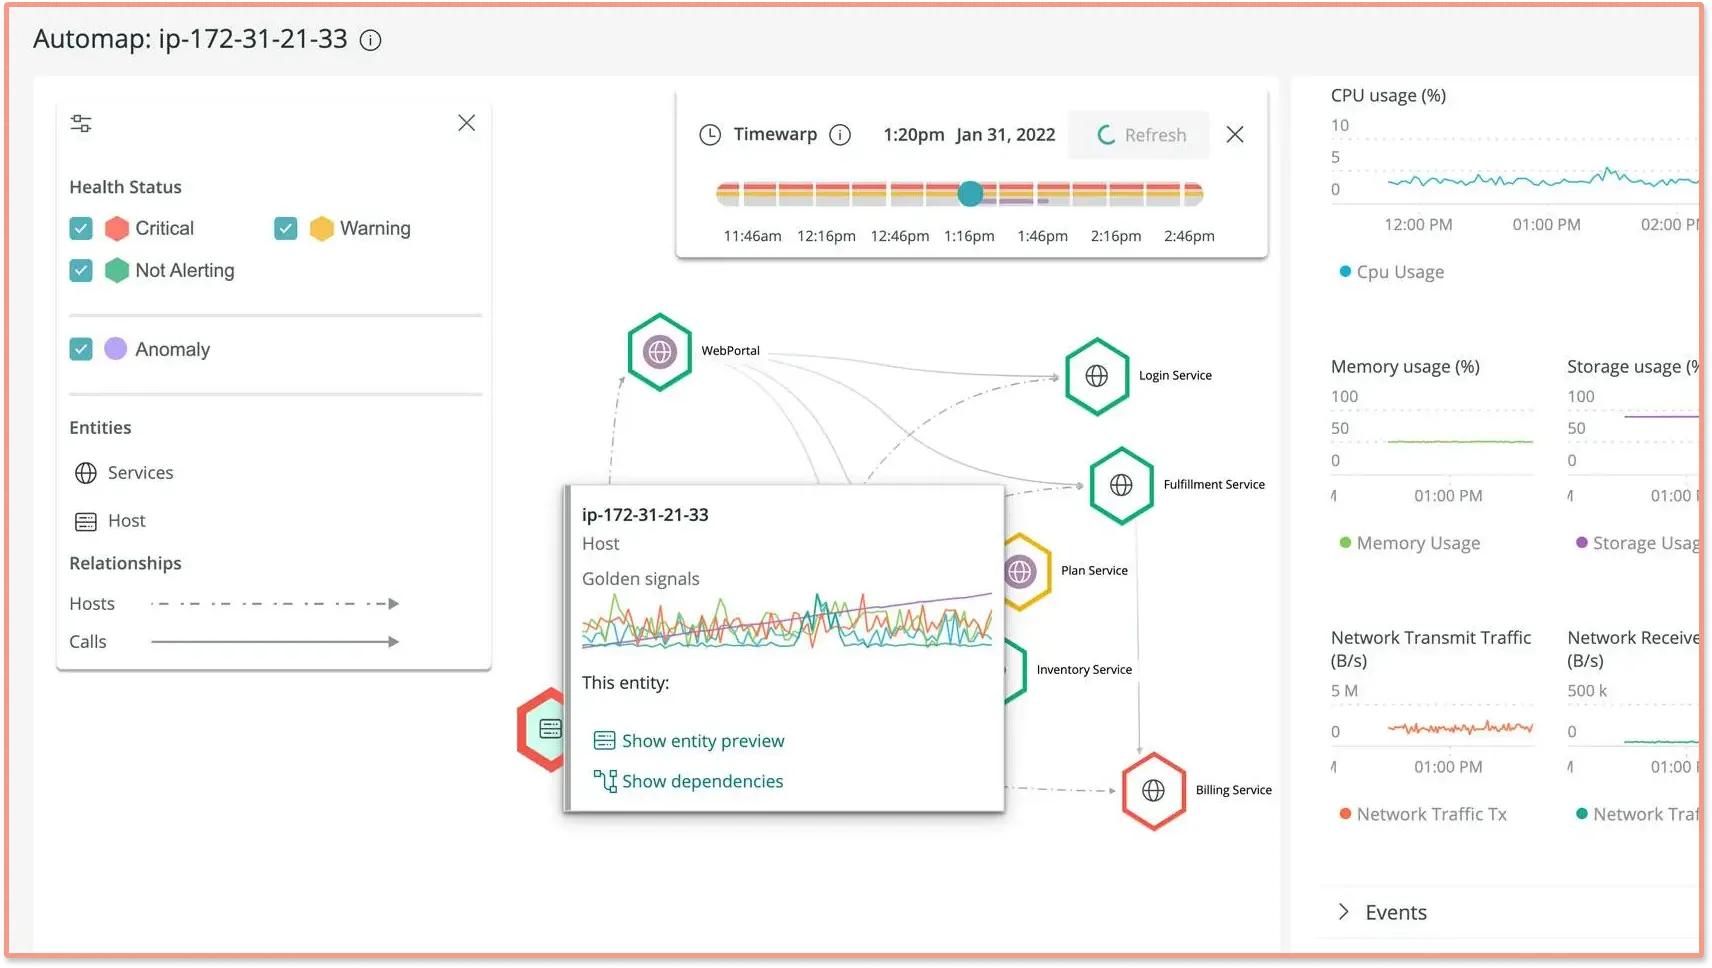
LogicMonitor
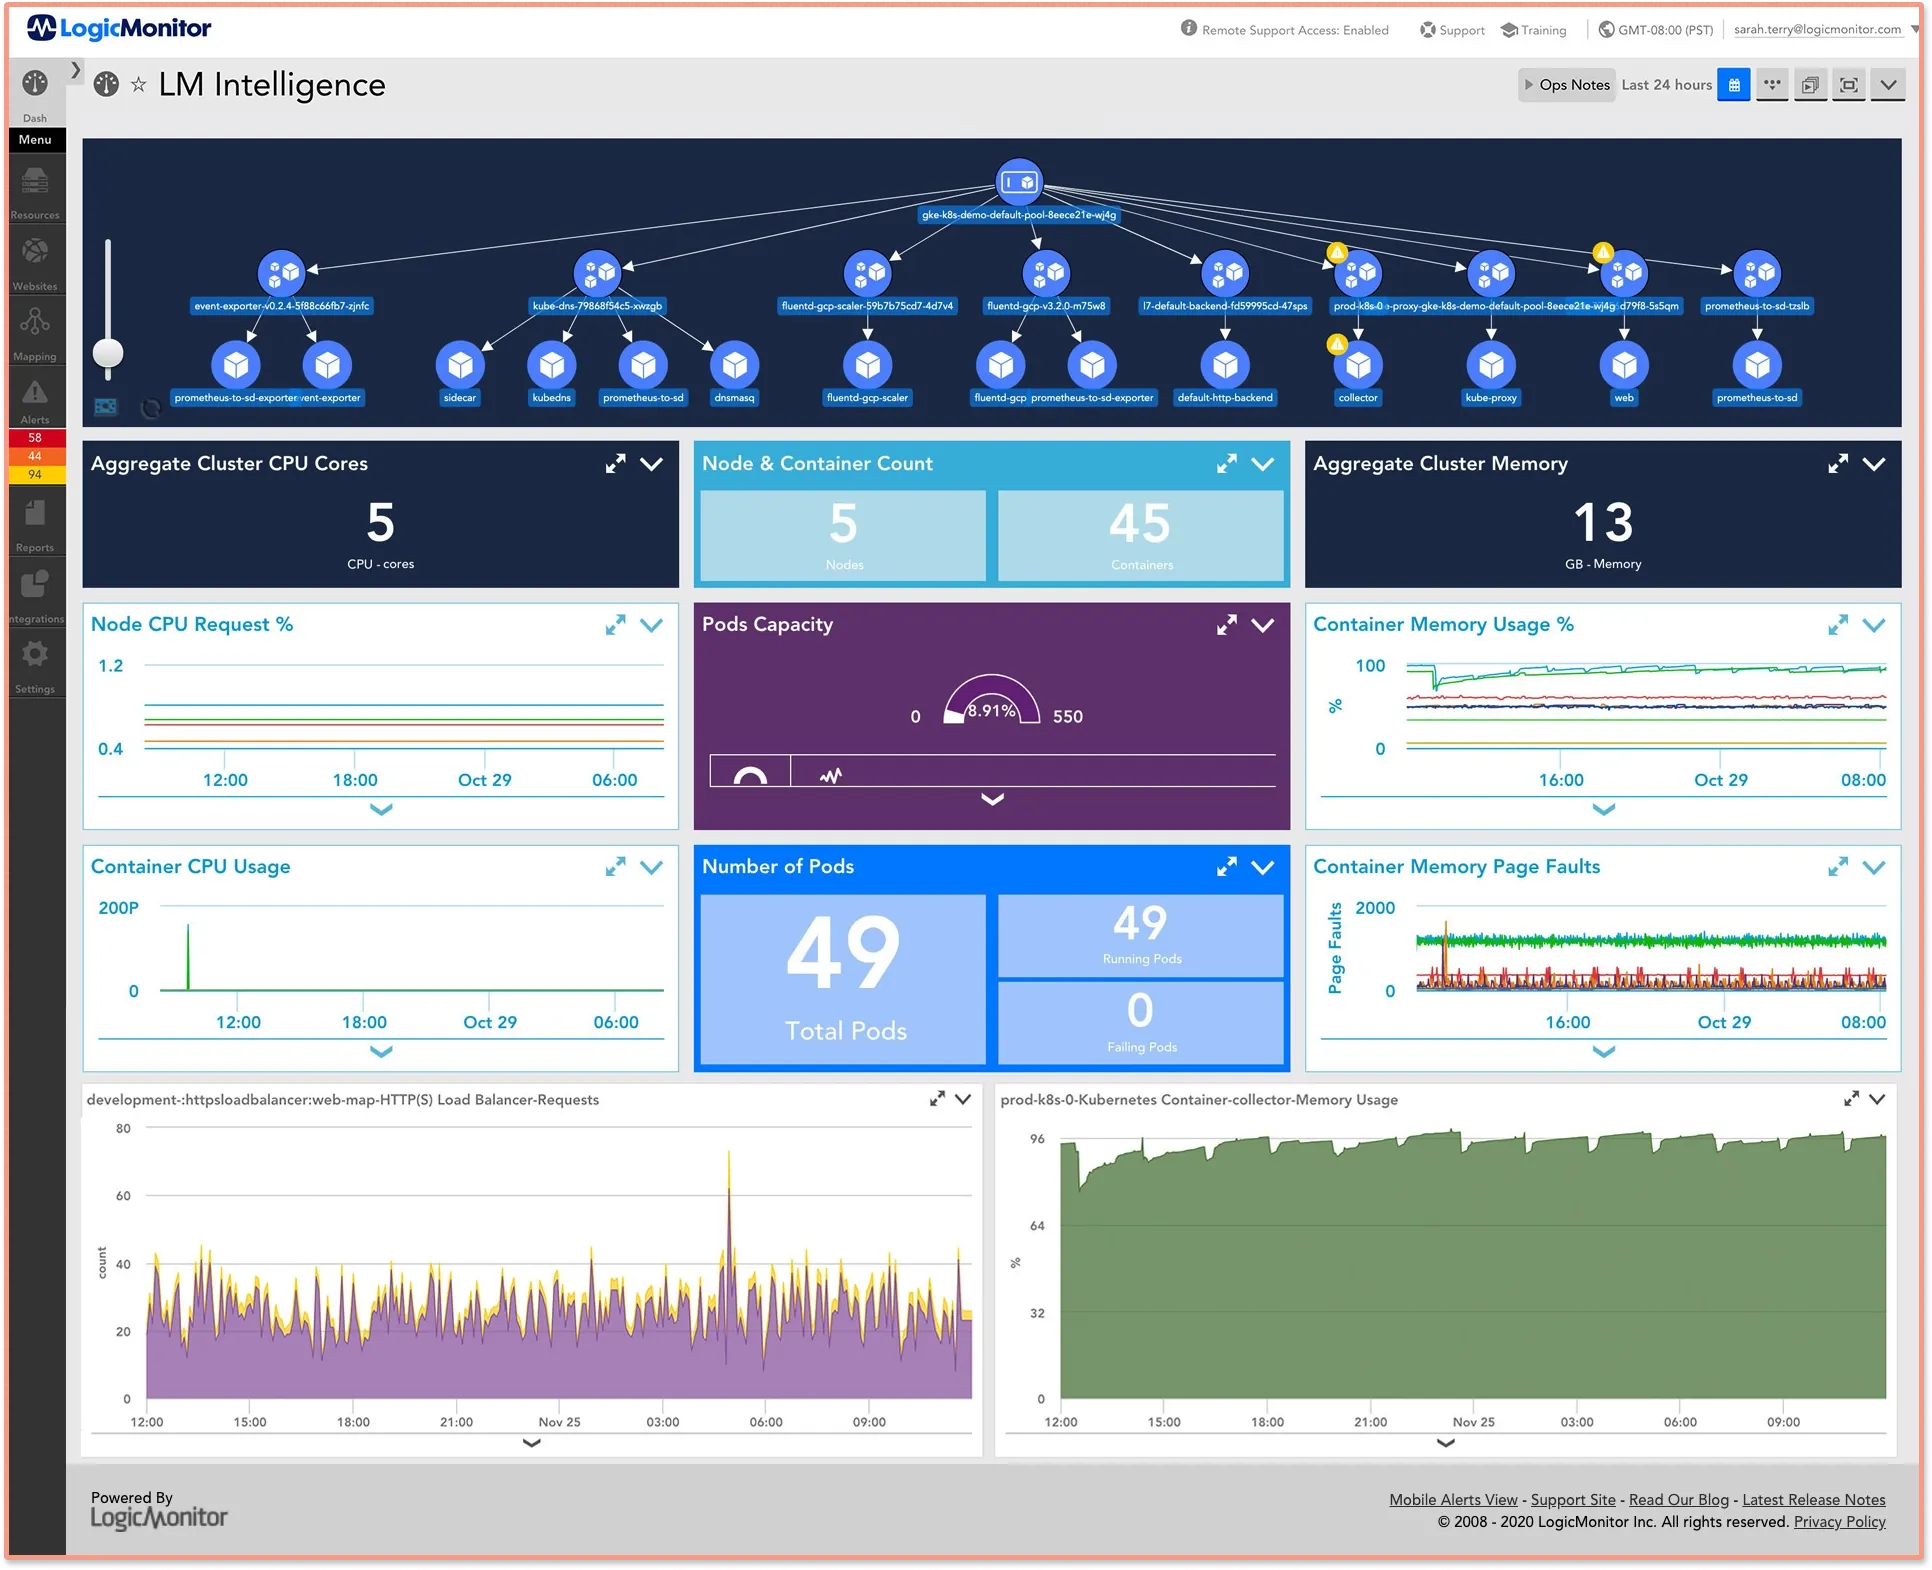
Logicmonitor is a full-stack observability tool supporting both on-premises and cloud vendors. It automatically discovers containers, microservices, and host resources.
It is a feature-packed enterprise solution with built-in integration from Docker, Kubernetes, and AWS.
New Relic
New Relic is an application monitoring enterprise tool that provides a range of solutions from application monitoring and infrastructure monitoring to log management. It provides flexible and dynamic observability of your entire infrastructure.
Splunk
Splunk is a full-stack infrastructure monitoring solution that can address real-time cloud monitoring requirements at scale. It has support for both clouds and on-premises. It supports the integration of various tools, databases, and data processing platforms.
Furthermore, it uses a docker logging driver, which outputs logs in a JSON file. It collects the data from multiple containers in multiple regions to a centralized server and feeds it into an analyzer.
Sumo Logic
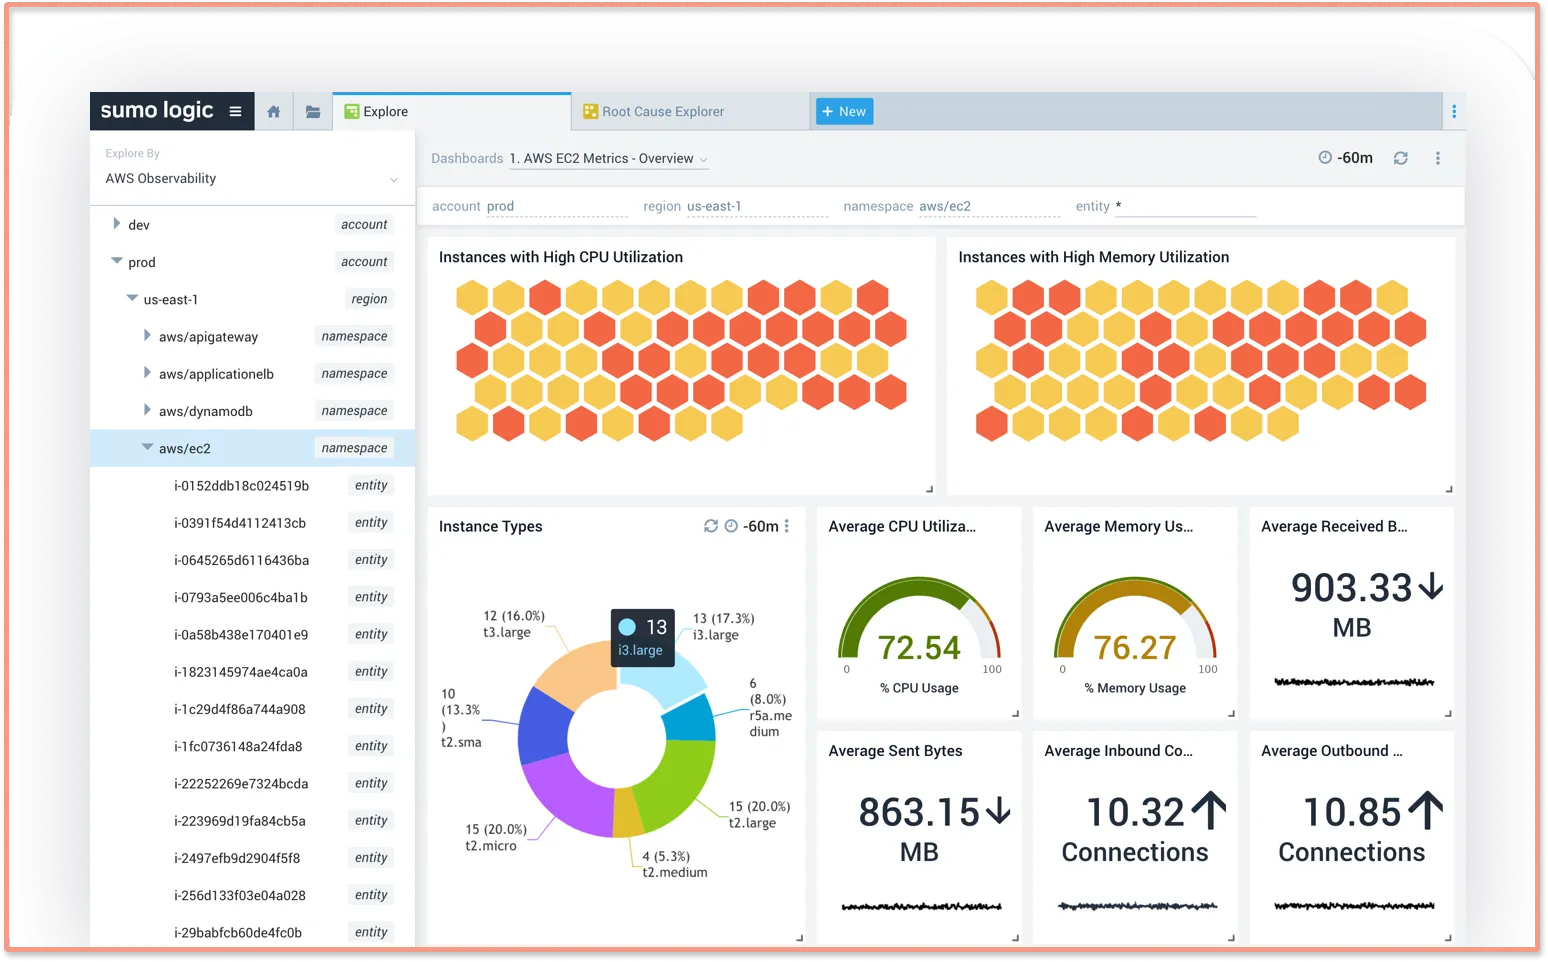
Sumo Logic is a full-stack enterprise monitoring tool. It provides a range of solutions from application and infrastructure monitoring to databases and log management. It supports 12 different logging methodologies.
Sumo Logic is able to achieve these techniques with the help of a user agent and logging driver.
AppOptics
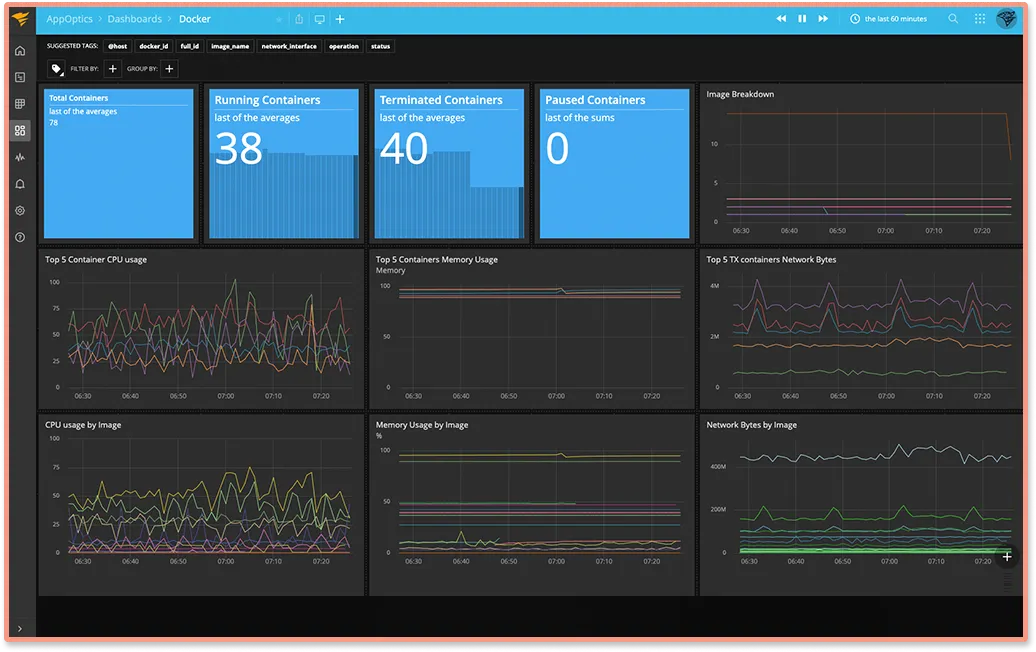
AppOptics is a full-stack observability platform with an APM integrated experience. It features a simple, intuitive UI and code-level analysis, which helps in pinpointing the problem.
Final thoughts
Most traditional monitoring tools monitor infrastructure at the host level. But having insights into container performance is required to run container-based applications. Traditional monitoring tools are not suited to monitor container-based applications.
A monitoring tool that can give you container-level insights along with capabilities to monitor performance at aggregated levels is best suited to monitor container-based applications. You can try out SigNoz to monitor your containerized application. As it is based on OpenTelemetry, you can make use of tags to see aggregated performance of containers.
Getting started with SigNoz
SigNoz Cloud is the easiest way to run SigNoz. Sign up for a free account and get 30 days of unlimited access to all features.

You can also install and self-host SigNoz yourself since it is open-source. With 24,000+ GitHub stars, open-source SigNoz is loved by developers. Find the instructions to self-host SigNoz.
Further Reading
