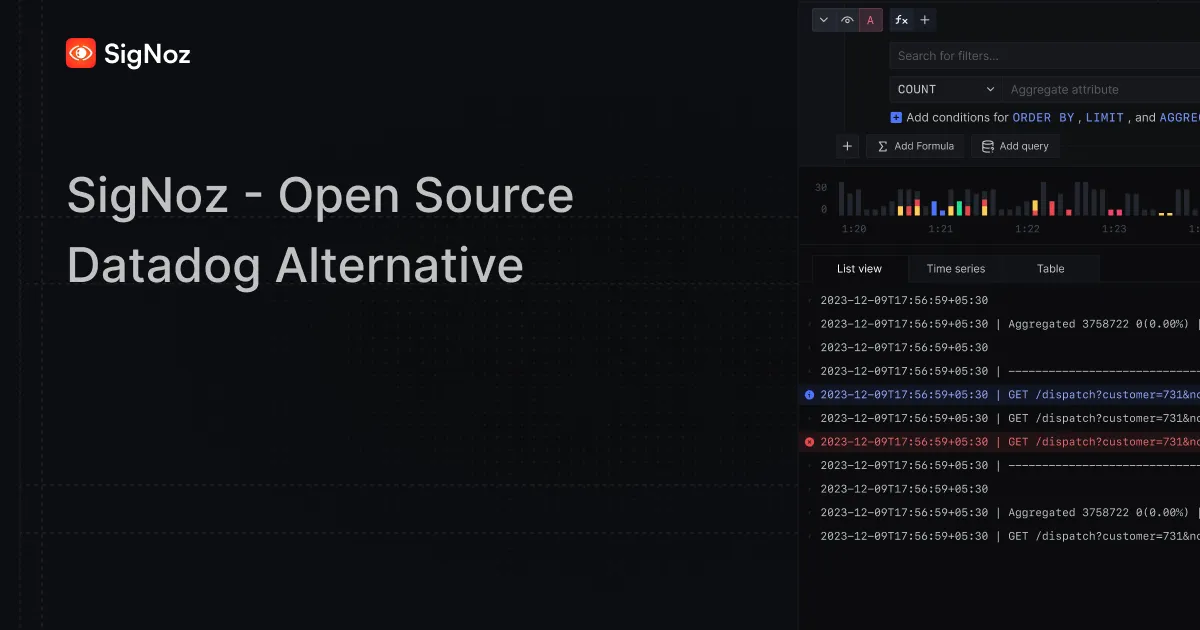
SigNoz - Open-Source Alternative to DataDog
If you’re looking for an open-source alternative of Datadog then you’ve come to the right place. SigNoz is the top choice for anyone looking for an open-source Datadog alternative.
One of the reasons of building SigNoz was a lack of a robust one-stop observability solution in open-source ecosystem that provided a similar user experience that SaaS tools like Datadog do. We also wanted to have a tool that is built on top of OpenTelemetry, no proprietary agents in your application code, just open source software so that you never get locked in with a vendor.
Start with SigNoz Cloud in minutes. Simple usage-based pricing, no surprise bills. Migrate to self-hosted anytime — same open-source codebase.
Get Started - FreeSigNoz is built on top of OpenTelemetry(OTel) from day 1, and leverages OTel data to its full potential. We have helped many users migrate from Datadog to SigNoz using our automated migration tool, and there are numerous reasons that teams want to migrate away from Datadog, or look for a better alternative.
The issues with Datadog and why SigNoz
The first and the most common issue of users with Datadog is its billing practices. Before we talk about the main issues with Datadog and how SigNoz can be a better fit, you may want to read our Datadog vs Prometheus write-up that explores the open-source metrics angle in detail.
Complex and Unpredictable billing practices
The core of the confusion with Datadog's pricing lies in its multi-dimensional, usage-based model. You're not just paying for one thing; you're charged across various products, each with its own pricing metric. This can lead to unpredictable bills that are difficult to forecast and control.
Lot of users that migrated from Datadog to SigNoz have received surprised bills that they were not expecting.

Host-based pricing, special pricing for custom metrics and paying twice for logs(ingestion and indexing) are some of the common issues with Datadog billing. SigNoz on the other hand has simple usage based pricing. Some highlights:
- Simple usage-based pricing: $0.3 per Gb for ingested logs or traces, $0.1 per million samples for metrics. Use our cost estimator to estimate your monthly bill.
- No special pricing for custom metrics: Datadog charges a premium for "custom metrics," which are any metrics not from a standard integration. This includes virtually all metrics you'd create for your own application, and critically, all metrics sent via the open-source standard OpenTelemetry (OTel) are billed as custom. We charge all metrics the same, in fact, custom application metrics are essential to setting up robust observability and you should be able to send as many as you might need without thinking about the cost.
- No host-based, no user-based pricing: Monitor as many hosts as you like and add unlimited team members based on your requirements. Both of these make sense for modern architecture and modern engineering teams.
Vendor Lock-in Due to Proprietary Agent
A significant issue with Datadog is vendor lock-in, driven by its proprietary agent. To use Datadog, you must embed their agent throughout your infrastructure. If you ever decide to switch platforms, you face a major migration project: ripping out the Datadog agent everywhere and re-instrumenting your entire application stack for a new tool.
OpenTelemetry is now the default standard for instrumenting cloud-native applications. If you don’t know much about OpenTelemetry, here’s a good read on what is OpenTelemetry and top reasons to use OpenTelemetry.
By using OTel, you instrument your applications with a vendor-neutral standard, not a proprietary tool. This decouples your instrumentation from your observability backend, giving you the freedom to send your data to any OTel-compatible platform, including SigNoz, without being locked in.
SigNoz is OpenTelemetry-native, designed to leverage the full power of OTel data for a unified view of logs, metrics, and traces. We've also recently launched features that double down on our OTel-native approach, including:
- Trace Funnels: Intelligently sample and analyze traces to focus on what's important.
- External API Monitoring: Gain visibility into the performance of third-party APIs your application depends on.
- Out-of-the-box Messaging Queue Monitoring: Effortlessly monitor popular queuing systems.
No flexible deployment options
Datadog is a closed SaaS software where the only option is to send data to Datadog cloud services. We believe in today’s world of data privacy and strict data governance laws, you should have flexibility in deployment options.
Based on your company stage and requirements, you can choose between the following deployment options for using SigNoz:
- SigNoz Cloud: A fully-managed, scalable solution for teams that want to focus on their core business without the overhead of managing an observability platform.
- SigNoz Enterprise: For organizations with strict data residency or privacy requirements, we offer a self-hosted enterprise edition (bring-your-own-cloud or on-premise) with dedicated support and advanced security features.
- SigNoz Community: A self-hosted, open-source version that's perfect for getting started and for teams with the capability to manage their own infrastructure.
Why only SigNoz, and why not any other open source tool?
You might ask - is SigNoz the only open-source tool that you can consider as an Datadog alternative? Short answer, yes. The only other viable option apart from SigNoz is Grafana. But Grafana comes with its own challenges. (If you want to explore the wider landscape, check out our roundup of the best open source APM tools available.)
Grafana originated as an data visualization tool and it does an amazing job at it. If you want to build dashboards from different data sources then Grafana might be a better option. But since you’re looking for a Datadog alternative, I assume you need more out-of-the-box opinionated observability tool which helps you get started with ease and helps you troubleshoot common issues with out-of-the-box modules.
And that’s where SigNoz shines over Grafana. Though Grafana is being marketed as an all-in-one observability tool now, you need to keep in mind that Grafana’s observability stack is stitched together with multiple tools.
Under the hood, Grafana is powered by multiple tools like Loki, Tempo, Mimir & Prometheus. While SigNoz is powered by a single columnar to serve logs, metrics, and traces in a single pane.
If you’re planning to self-host to replace Datadog, then this means much lesser operational overhead if you choose SigNoz over Grafana. Because of being powered by a single datastore, the developer experience of correlating different signals like logs, metrics and traces and doing complex aggregations is much simpler in SigNoz.
An Overview of SigNoz Features
Application metrics
Get out of the box p90, p99 latencies, RPS, Error rates and top endpoints for a service out of the box.

SigNoz UI showing application overview metrics like 50th/90th/99th Percentile latencies, request rate and Apdex
Seamless flow between telemetry signals
Powered by OpenTelemetry's semantic conventions, you can quickly jump between telemetry signals in SigNoz. Found something suspicious in a metric, just click that point in the graph & get details of traces which may be causing the issues. Seamless, Intuitive.
Similarly, we have enabled correlation between other telemetry signals.
APM Metrics to Traces & Logs
 to Traces & Logs](/_next/image/?url=https%3A%2F%2Fd3nu8xzr1i9u95.cloudfront.net%2Fweb%2Fimg%2Fblog%2F2024%2F09%2Fintroducing-correlation-of-signals-apm-charts-to-logs.webp&w=3840&q=75)
Traces to Logs
If you see a API call taking more time than usual, you can go to related logs to investigate further.

Similarly you can click on detailed view of logs and then go to related trace ID to see the flow of user requests.

Logs with Infrastructure metrics
While troubleshooting with logs, you can investigate the related infrastructure metrics to see if issues are happening becuase of that.

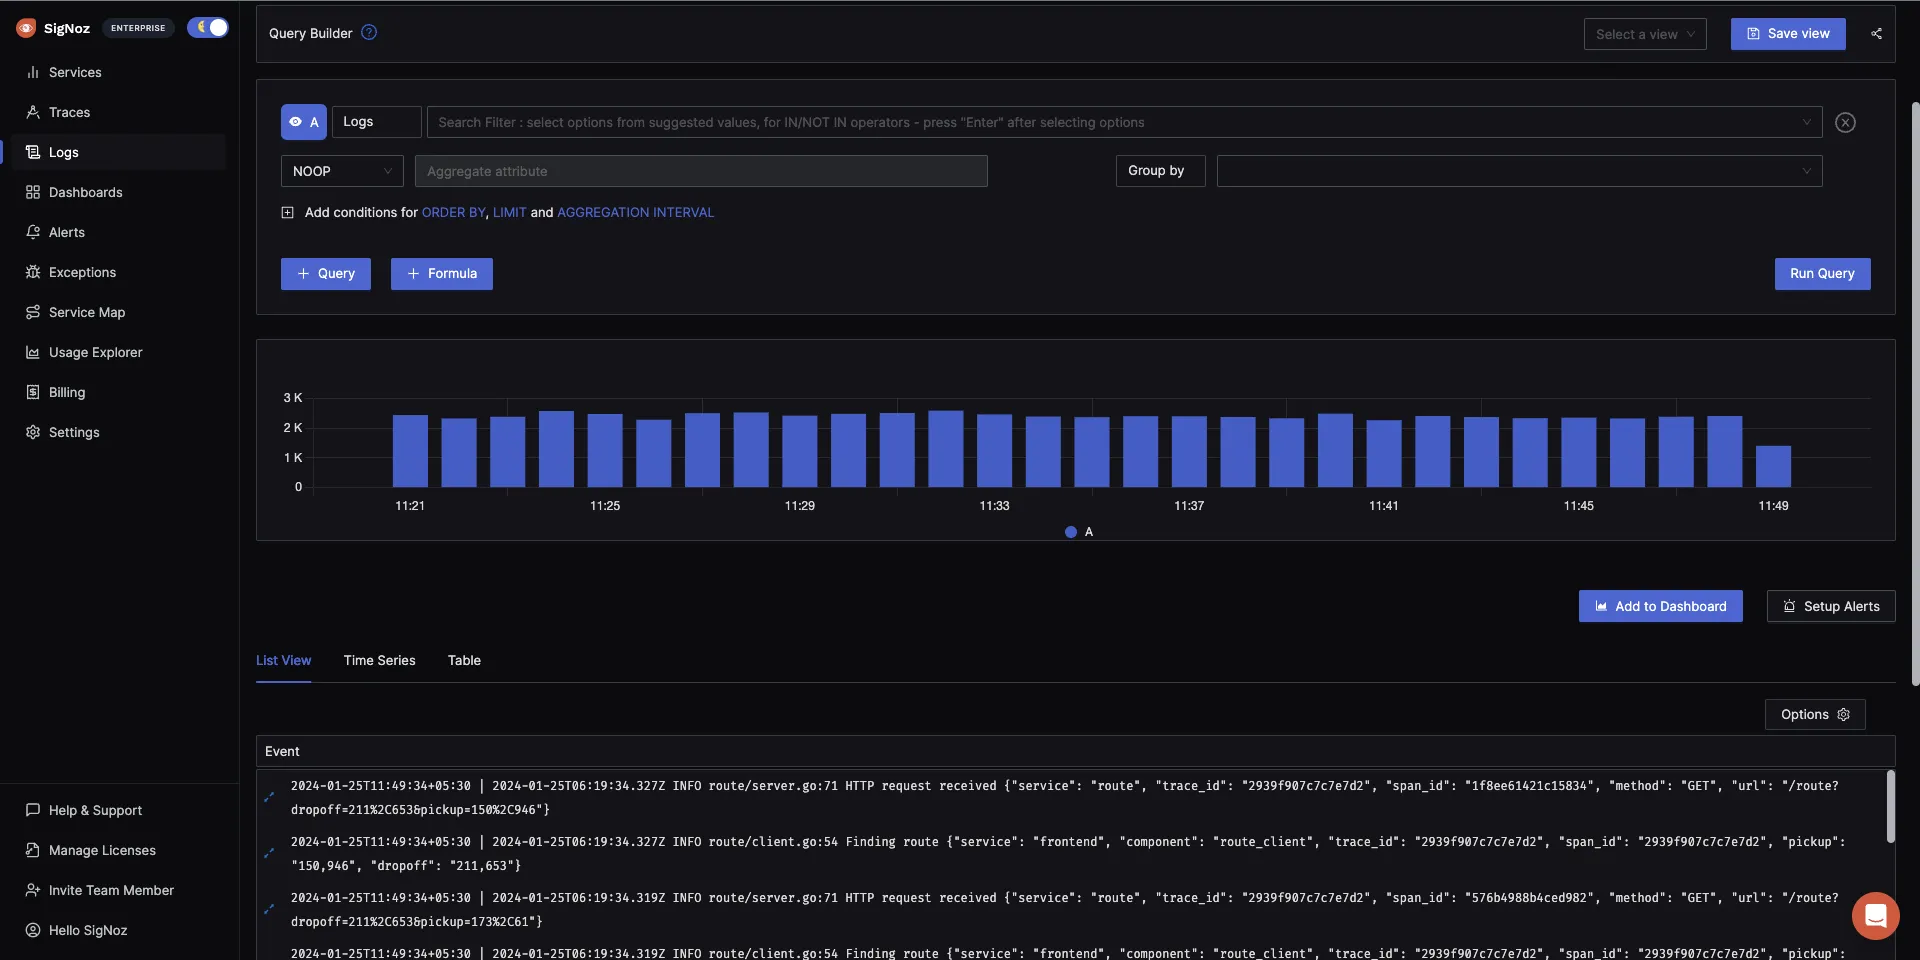
Quick filers & Advanced Query Builder for all telemetry signals
For all telemetry signals, there are quick filters to quickly filter out the data needed. We have built customized query builders for each signal to make your troublshooting work easier.
For example, query builder for traces allows you to create queries for finding the p99 latency of services.

Similarly, use quick filters to quickly filter the data that you need.

You can create custom metrics from filtered traces to find metrics of any type of request. Want to find p99 latency of customer_type: premium who are seeing status_code:400. Just set the filters, and you have the graph. Boom!
Flamegraphs & Gantt charts
Detailed flamegraph & Gantt charts to find the exact cause of the issue and which underlying requests are causing the problem. Is it a SQL query gone rogue or a Redis operation is causing an issue? Get more context on your spans with tags and events.

Spans of a trace visualized with the help of flamegraphs and gantt charts in SigNoz dashboard
Logs Management
SigNoz provides Logs management with advanced log query builder. You can also monitor your logs in real-time using live tailing. SigNoz uses a columnar database ClickHouse to store logs, which is very efficient at ingesting and storing logs data. Columnar databases like ClickHouse are very effective in storing log data and making it available for analysis.
Metrics & Dashboards
Monitor any metrics important to you. Ingest metrics from your infrastructure or applications and create customized dashboards to monitor them.
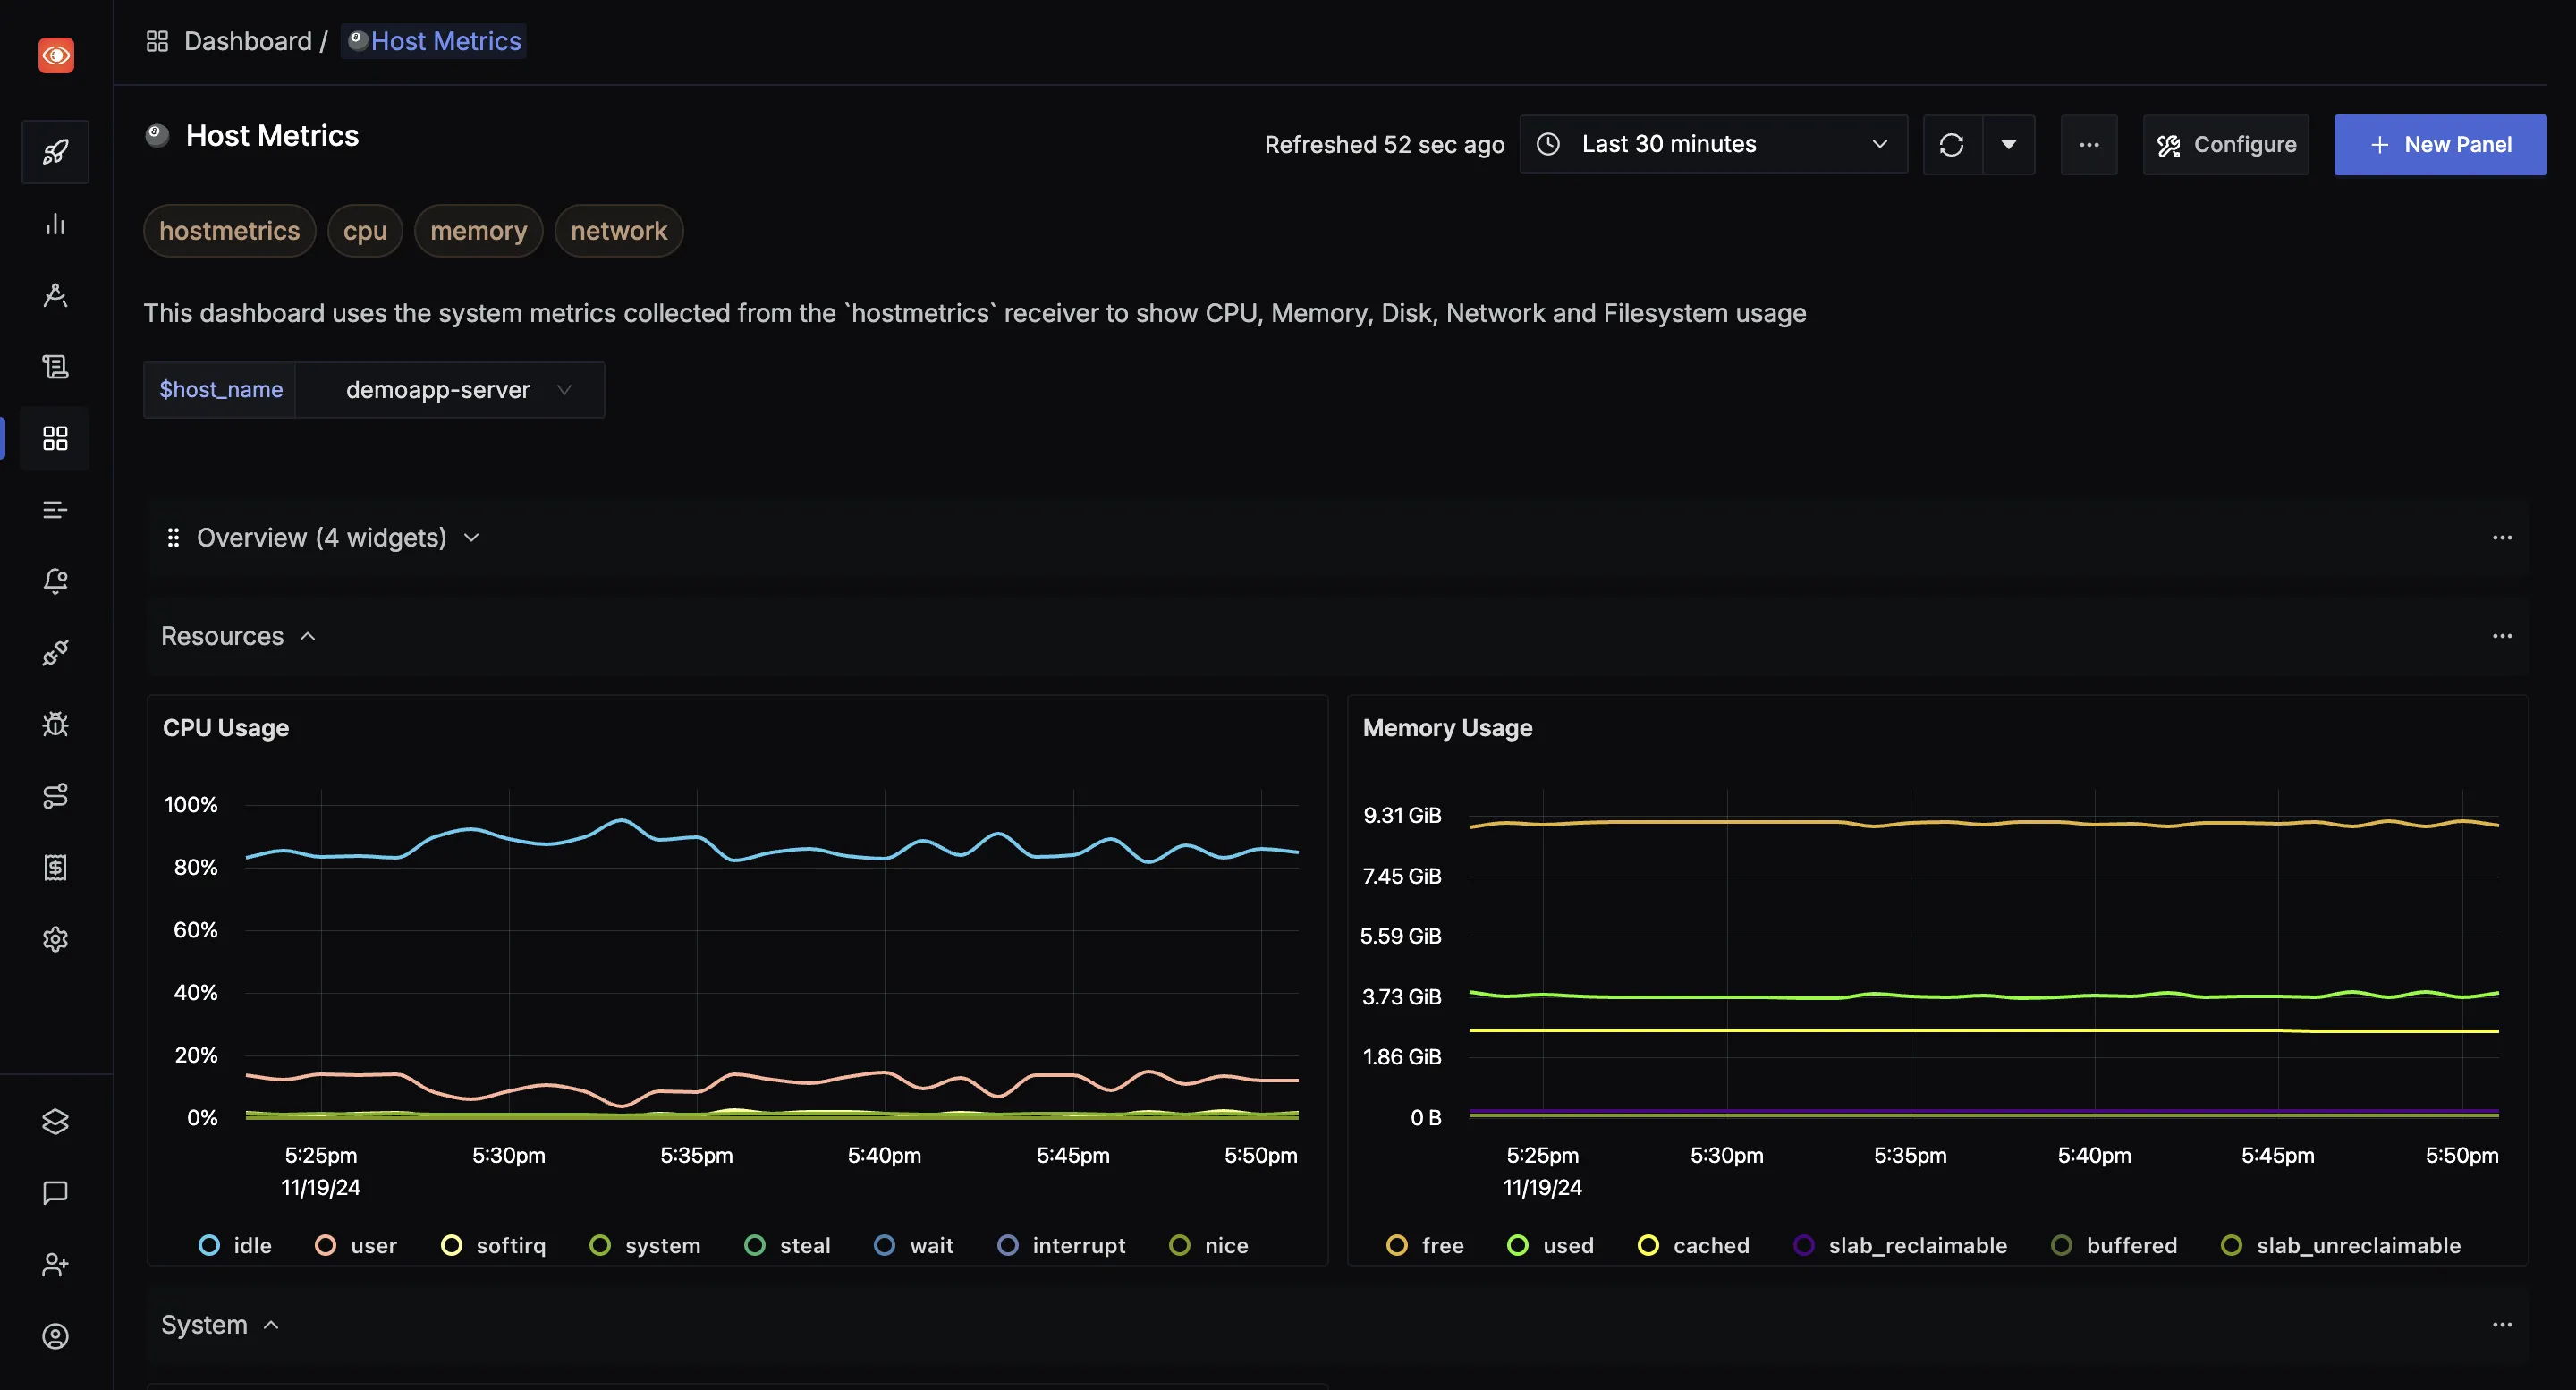
You can create any kind of customized dashboards using different visualization panel types and an advanced query builder
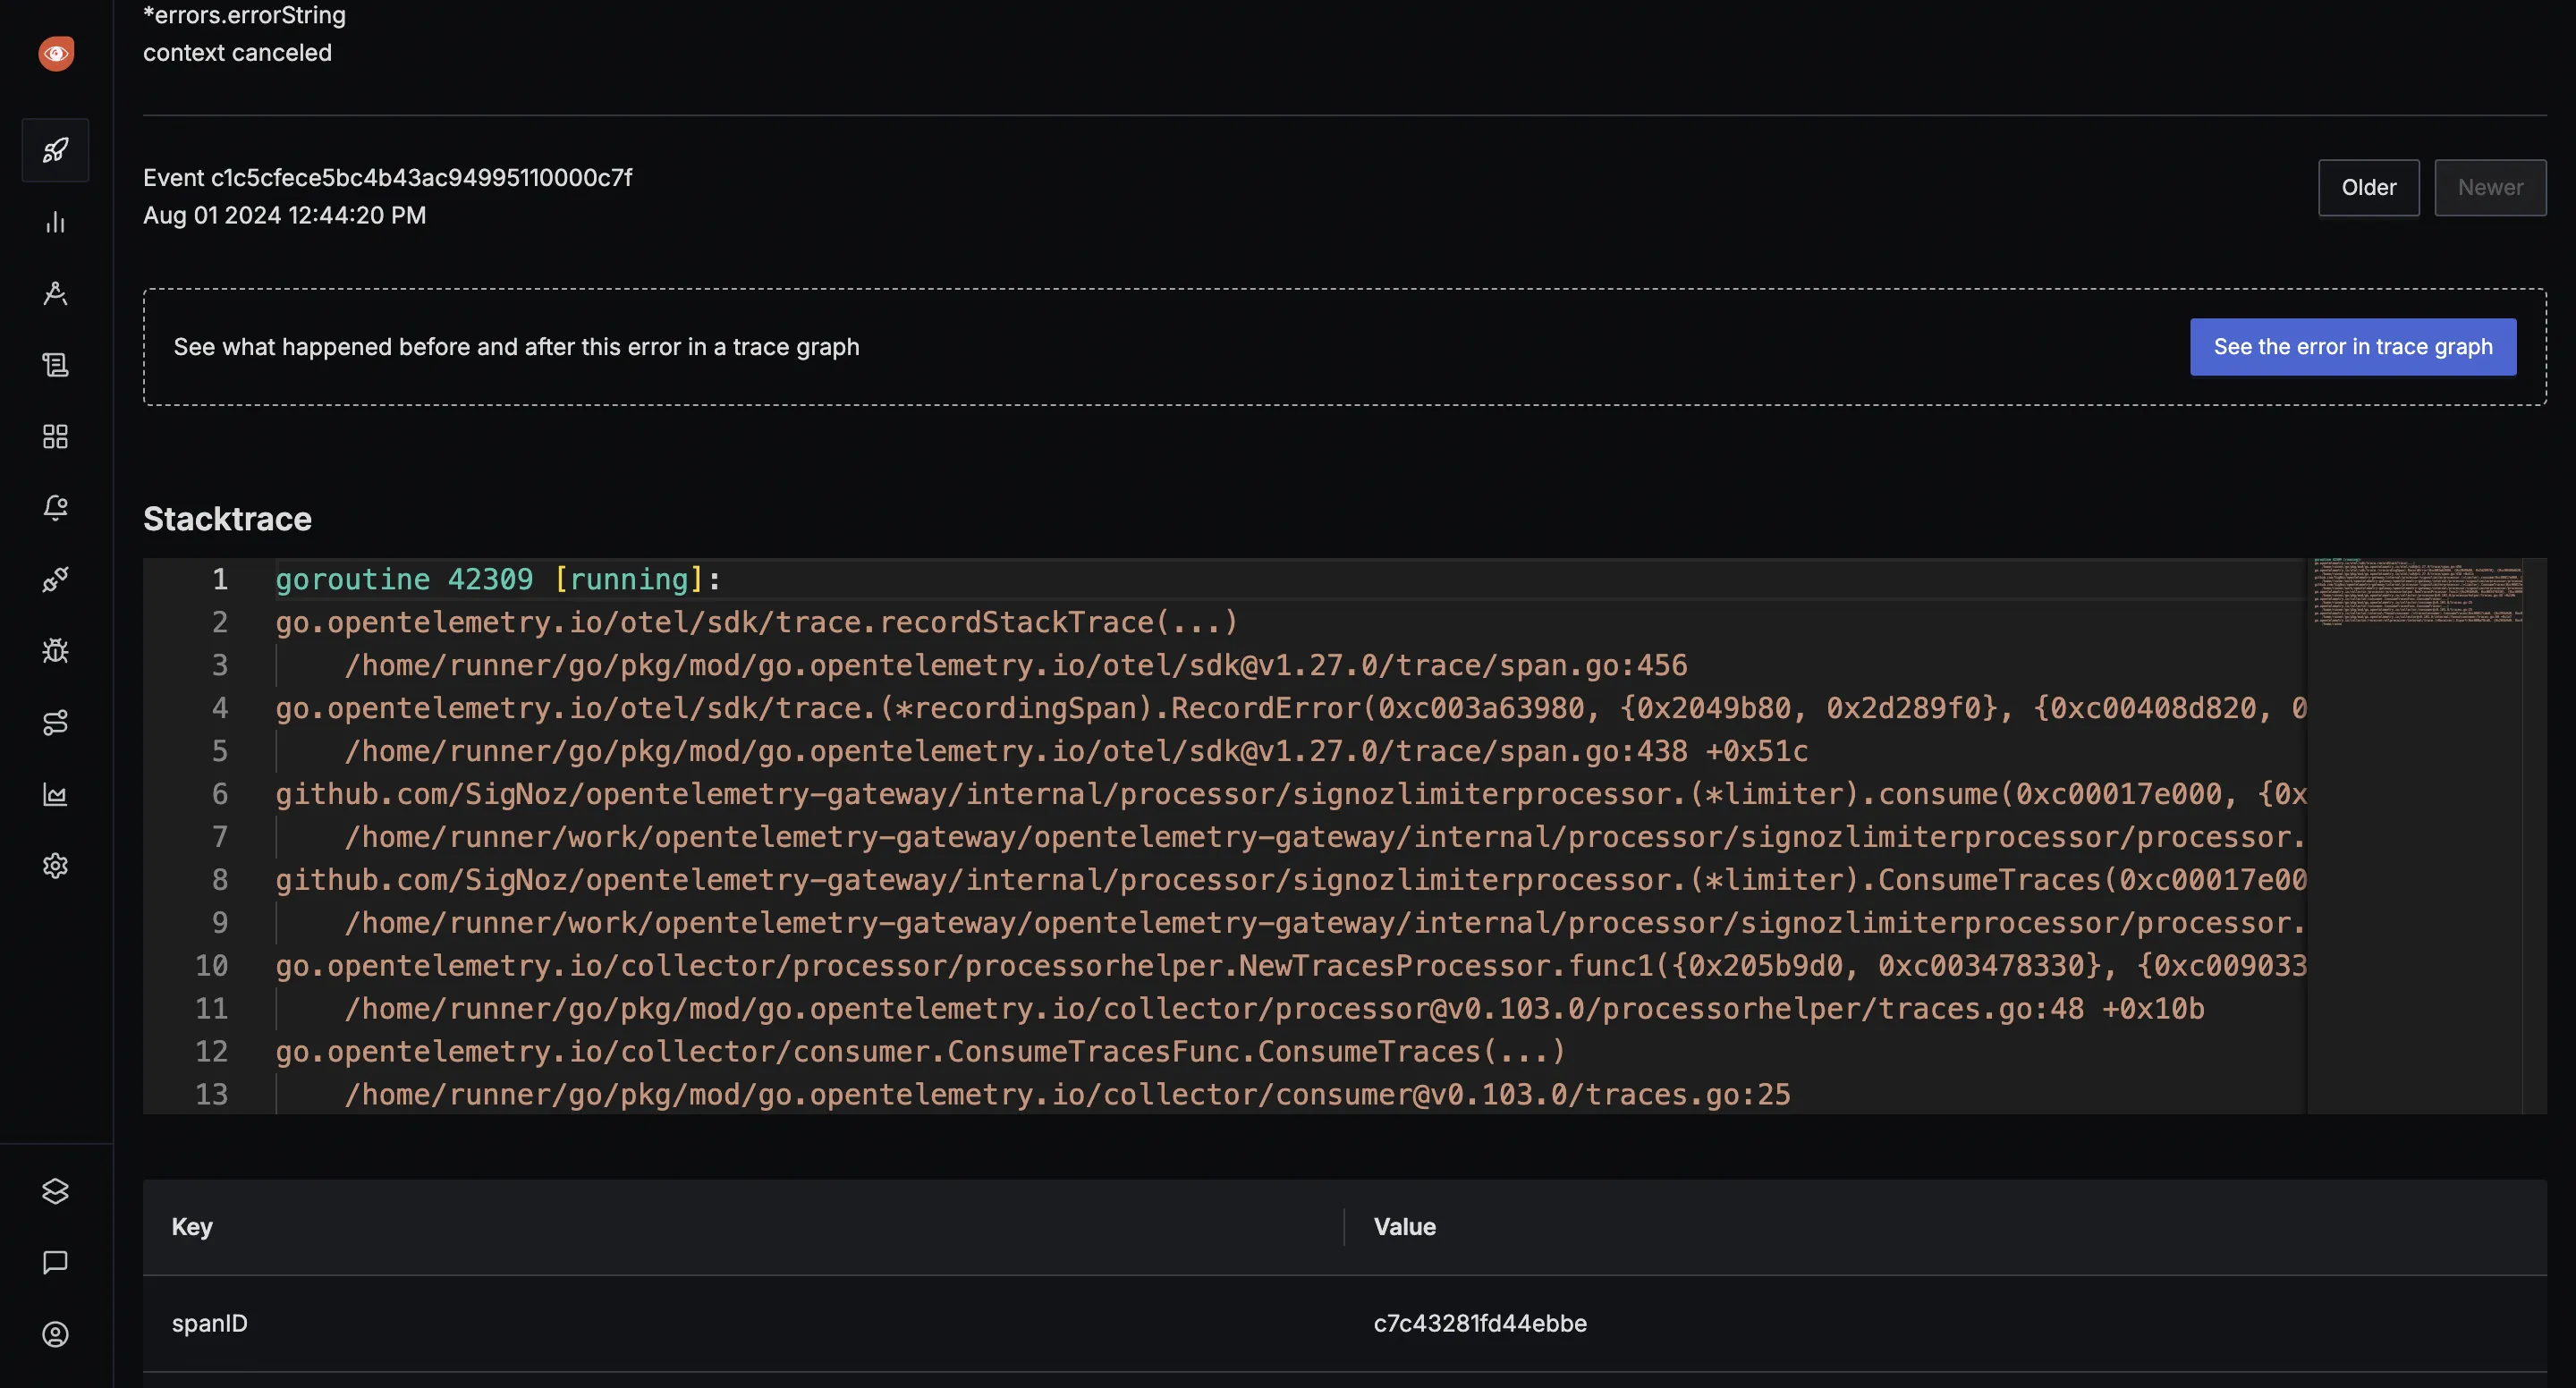
Exceptions Monitoring
Monitor exceptions automatically in Python, Java, Ruby, and Javascript. For other languages, just drop in a few lines of code and start monitoring exceptions.
LLM Observability
Building with LLMs? SigNoz provides end-to-end observability for your LLM applications. Track token usage, costs, and latency for providers like OpenAI, Anthropic, and frameworks like LangChain and LlamaIndex.

Getting started with SigNoz
As discussed earlier, you can choose between various deployment options in SigNoz. The easiest way to get started with SigNoz is SigNoz cloud. We offer a 30-day free trial account with access to all features.
Those who have data privacy concerns and can’t send their data outside their infrastructure can sign up for either enterprise self-hosted or BYOC offering.
Those who have the expertise to manage SigNoz themselves or just want to start with a free self-hosted option can use our community edition.
Hope we answered all your questions regarding choosing SigNoz as the Datadog alternative. Making the switch is simple with our automated migration tool that converts your Datadog dashboards in minutes. If you have more questions, feel free to use the SigNoz AI chatbot, or join our slack community.
Related Content
SigNoz vs Datadog
Beware these surprises in Datadog pricing
LLM-powered Datadog to SigNoz Migration Tool
Cut Your Observability Spend by 80%—Here's How
Switch from Datadog seamlessly with our automated migration tool, comparable features and up to 80% cost savings.
