What is Context Propagation in Distributed Tracing?
In modern microservices-based applications, it is difficult to get an overview of how requests are performing across multiple services, infrastructure, and protocols. As companies began moving to distributed systems, they realized they needed a way to track requests in their entirety for debugging applications. Distributed tracing is a technology that was born out of this need.

Fundamentally, context propagation helps in distributed system monitoring by passing a context object(a unique identifier and some other metadata) with a transaction across multiple software components.
What is context propagation in distributed tracing?
A distributed system is monitored with distributed tracing by passing a context object along the execution path of a transaction or user request that might span across multiple software components. The propagation of context correlates events in a specific user request or transaction, and this correlation helps in further analyses of application performance.
Before we deep dive into context propagation, let’s understand what distributed tracing is and why it is needed in brief.
Distributed Tracing - a brief overview
A modern internet-scale application is built on distributed systems leveraging cloud-native, serverless, and software architectures like microservices. Unfortunately, while bringing many benefits to the companies implementing them, these systems also make it harder to maintain software performance and debug issues.
Read our complete guide on Distributed Tracing
The operational challenge of maintaining a distributed system has increased, and troubleshooting is more complicated.
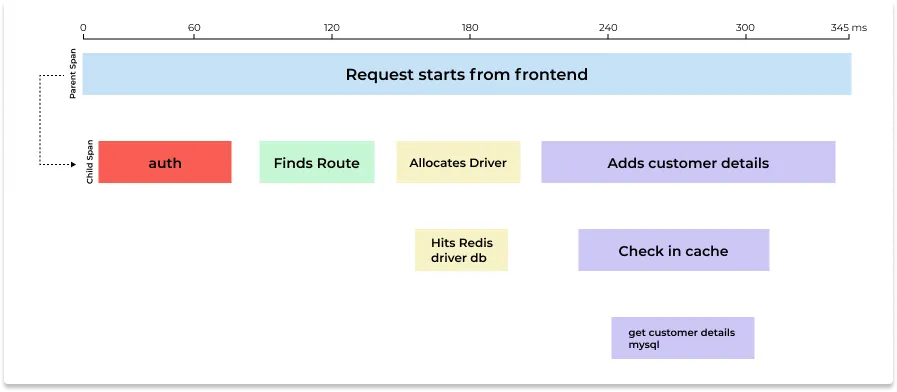
Distributed tracing is becoming the go-to solution for solving this complexity and helping engineering teams have a much-needed central overview of distributed systems. With distributed tracing, transactions and user requests are tracked across each software component they traverse to help identify bottlenecks.

Context Propagation in Distributed Tracing
Introduction
Distributed tracing is built on causal metadata context propagation. It aims to capture events in a sequential flow that depicts the causal relationship between the events in a single user request.
The underlying concept behind recreating an execution flow is based on identifying two data points:
- all events related to a specific execution flow
- a causal relationship between events
Together, this forms the substrate of tracing data which is then analyzed and visualized by tracing tools. To collect both these data points, context propagation comes into the picture.
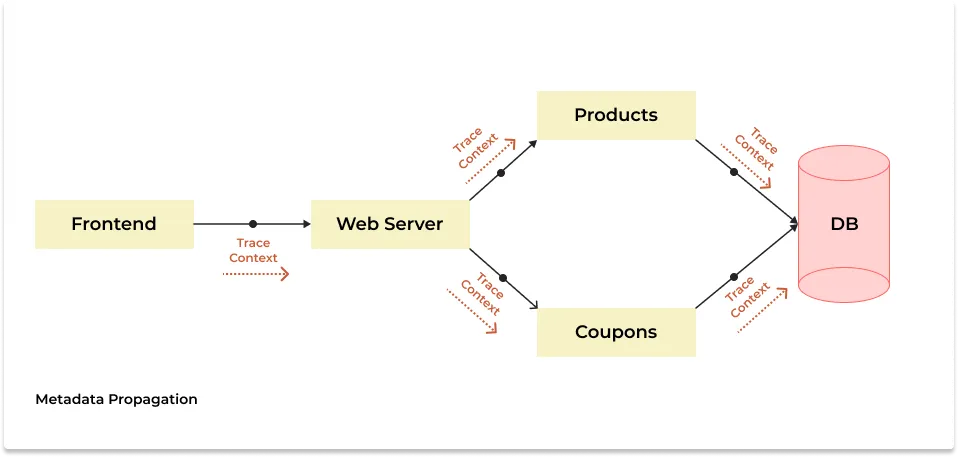
Suppose a request gets triggered at the frontend client in a fictional e-commerce website. It will travel to different services to complete the user request. For example, users might have requested a search for a particular category of products, or they might want to know the discount codes available. The request will traverse all the services involved in completing the request.
A trace context is passed along the execution flow that can be used to correlate the events involved in the process. Other data points also get passed alongside a trace context, e.g., tags and attributes. Tracing context propagation is also known as metadata propagation.

Types of Trace Context Propagation
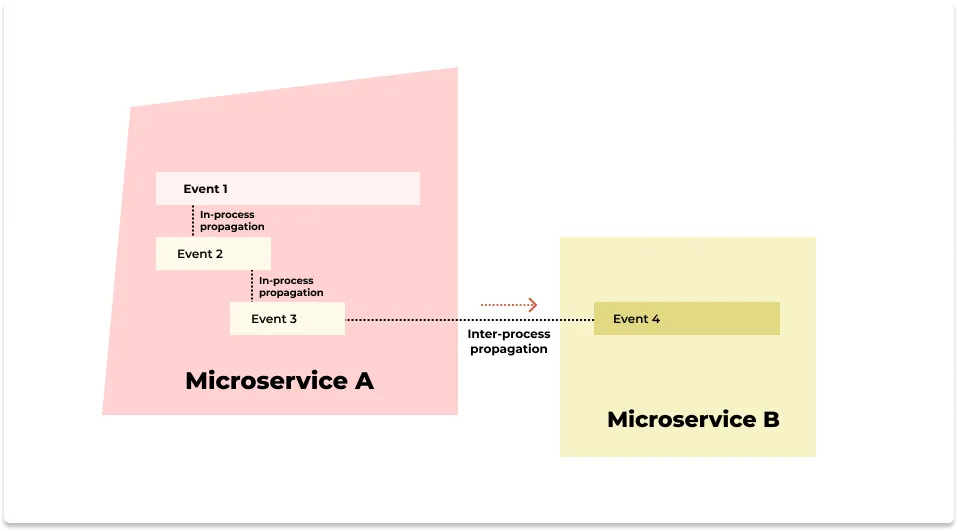
Today’s applications based on distributed systems are quite complex. Multiple software components come together to serve users’ needs across many hosts and process boundaries. There are mainly two types of context propagation to trace these complex systems:
In-process propagation
This type of context propagation involves passing the metadata inside a process. A request can do multiple logical operations inside a service itself. A process inside a service might involve possible thread switches and asynchronous tasks. In-process propagation takes care of correlating these events with context propagation.Inter-process propagation
This type of context propagation happens between network calls, and the metadata is passed along with headers of different communication frameworks like HTTP.

Identifiers used for context propagation
World Wide Web Consortium (W3C) has recommendations on the format of trace contexts. The aim is to develop a standardized format of passing trace context over standard protocols like HTTP. It saves a lot of time in distributed tracing implementation and ensures interoperability between various tracing tools.
Popular open standards for application instrumentation(the process of enabling application code to generate trace data) like OpenTelemetry follow the W3C Trace Context specification.
There are two important identifiers used for passing context propagation:
- A global identifier usually called TraceID identifies the set of correlated events
- An identifier for child events usually called SpanID to show the causal relationship between events in an execution flow
For example, OpenTelemetry specification defines these two IDs as follows:
TraceID
TraceId is the identifier for a trace. It is worldwide unique with practically sufficient probability by being made as 16 randomly generated bytes. TraceId is used to group all spans for a specific trace together across all processes.SpanID
SpanId is the identifier for a span. It is globally unique with practically sufficient probability by being made as 8 randomly generated bytes. When passed to a child Span this identifier becomes the parent span id for the child Span.
The W3C trace context recommendation also specifies a format called tracestate that is meant to help pass additional metadata.
Conclusion
Context Propagation in distributed tracing is what makes tracing possible. And with APIs of open standards like OpenTelemetry, all of this is taken care of. Most tracers in today’s market are expected to support W3C trace context recommendations apart from what their agents provide. But the safest option is to go with open source standards like OpenTelemetry. OpenTelemetry provides you with a set of client libraries in all major programming languages to enable distributed tracing following W3C trace context propagation recommendations.
OpenTelemetry provides libraries to take care of your application instrumentation. You need a tracing backend to store, analyze and visualize the generated trace data by OpenTelemetry. SigNoz is an open-source distributed tracing tool built natively to support OpenTelemetry. You can check out its GitHub repo.
Read more from SigNoz blog:
Spans - a key concept of distributed tracing
OpenTelemetry collector - complete guide
References
Mastering Distributed Tracing by Yuri Shkuro
OpenTelemetry Specification
W3C recommendations on Trace Context

