Implementing Distributed Tracing in a Golang application
In this article, we will implement distributed tracing for a Golang application with three microservices. To implement distributed tracing, we will be using open-source solutions - SigNoz and OpenTelemetry, so you can easily follow the tutorial.

What is distributed tracing?
Modern application architecture using cloud-native, containerization, and microservices is a very complex distributed system. A typical web-search example will illustrate some of the challenges such a system needs to address.
A front-end service may distribute a web query to many hundreds of query servers. The query may also be sent to a number of other sub-systems that may process advertisements or look for specialized results like images, news, etc. This might involve database access, cache lookup, network call, etc. In total, thousands of machines and many different services might be needed to process one search query.
Moreover, web-search users are sensitive to delays, which can be caused by poor performance in any sub-system. An engineer looking only at the overall latency may know there is a problem but may not be able to guess which service is at fault nor why it is behaving poorly. And such services are also not written and managed by a single team. Also, day by day, new components might get added to the system. Distributed tracing provides insights into the inner workings of such a complex system. Tracing such complex systems enables engineering teams to set up an observability framework.
Distributed tracing gives insights into how a particular service is performing as part of the whole in a distributed software system. It involves passing a trace context with each user request which is then passed across hosts, services, and protocols to track the user request.
In this article, we will use OpenTelemetry and SigNoz to enable distributed tracing in a sample Golang application with microservices. But before we deep dive into the implementation steps, let us give you a brief context on OpenTelemetry and SigNoz.
OpenTelemetry and SigNoz
OpenTelemetry is a vendor-agnostic set of tools, APIs, and SDKs used to instrument applications to create and manage telemetry data(logs, metrics, and traces). It aims to make telemetry data a built-in feature of cloud-native software applications.
OpenTelemetry provides the instrumentation layer to generate and export your telemetry data to a backend. Then, you need to choose a backend tool that will provide the data storage and visualization for your telemetry data. That’s where SigNoz comes into the picture.
SigNoz is a full-stack open-source observability tool that provides logs, metrics, and traces under a single pane of glass.
OpenTelemetry is the way forward for cloud-native application owners who want to set up a robust observability framework. It also provides you the freedom to choose any backend analysis tool. SigNoz is built to support OpenTelemetry natively, thus making a great combo.
Distributed Tracing in a Golang application
We will demonstrate implementing distributed tracing in a Golang application in the following sections:
- Instrumenting the Golang app with OpenTelemetry
- Running the sample Golang application
- Visualizing traces data with SigNoz dashboards
Prerequisites
- Go (version ≥ 1.16)
- For installation see getting started
- MySQL 8
- Download the MySQL community version from here
- If your MySQL is configured with a password, update it here: https://github.com/SigNoz/distributed-tracing-golang-sample/blob/master/.env
servefor frontend. For installation see: https://www.npmjs.com/package/serve- SigNoz - For instructions, please refer to Installing SigNoz section.
Installing SigNoz
First, you need to install SigNoz so that OpenTelemetry can send the data to it.
SigNoz can be installed on macOS or Linux computers in just three steps by using a simple installation script.
The install script automatically installs Docker Engine on Linux. However, on macOS, you must manually install Docker Engine before running the install script.
git clone -b main https://github.com/SigNoz/signoz.git
cd signoz/deploy/
./install.sh
You can visit our documentation for instructions on how to install SigNoz using Docker Swarm and Helm Charts.

When you are done installing SigNoz, you can access the UI at http://localhost:3301/application.
Instrumenting the Golang app with OpenTelemetry
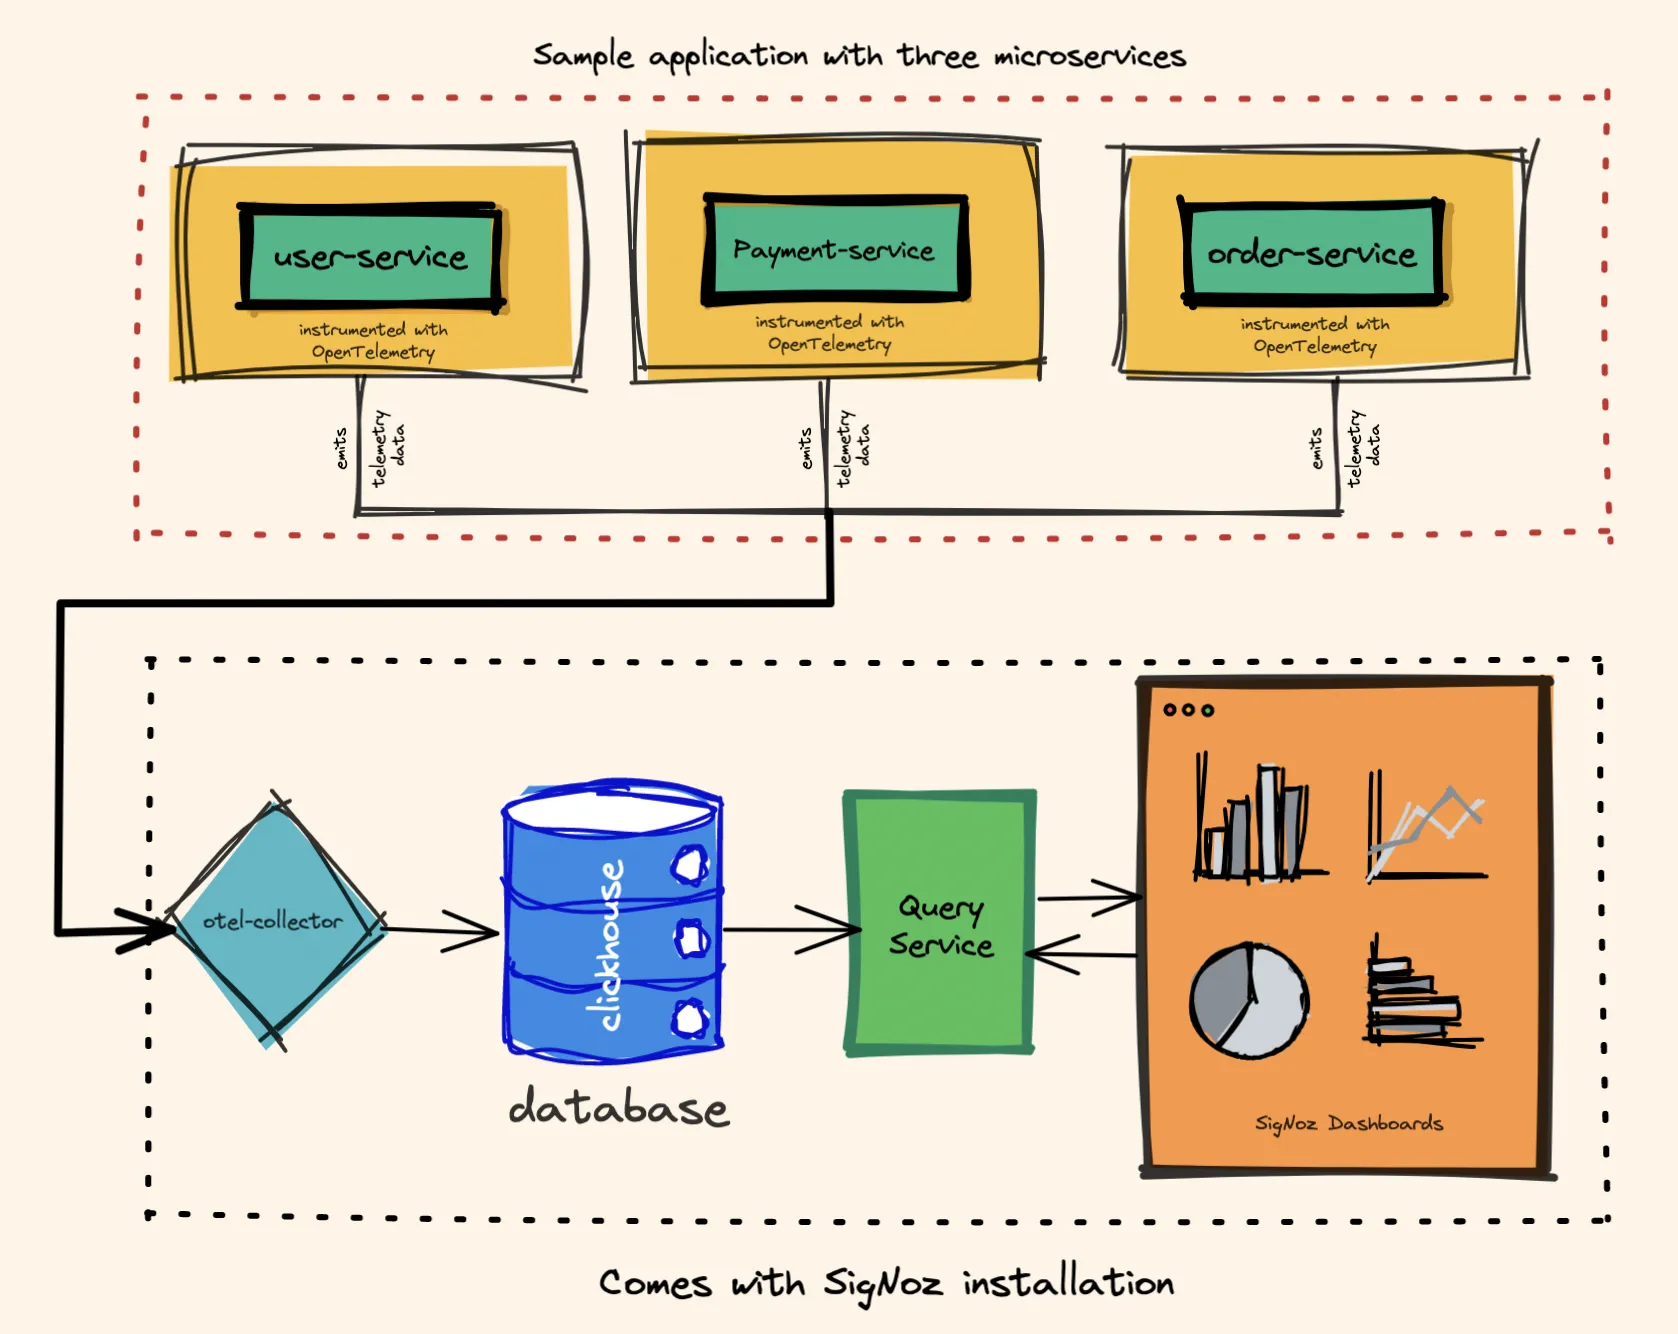
We have built a sample Golang application for the purpose of this tutorial. It has 3 services:
- user-service
- payment-service, and
- order-service
These services are instrumented with OpenTelemetry libraries, and when they interact with each other, OpenTelemetry emits the telemetry data to OTel collector which comes bundled with SigNoz.
Step 1: Clone sample Golang app repository and go to the root folder We will be using a sample Golang app at this GitHub repo.
git clone https://github.com/SigNoz/distributed-tracing-golang-sample.git
cd distributed-tracing-golang-sample
Step 2: Install the required dependencies
Check the list of all the required modules from go.mod. For OpenTelemetry, we need:
go.opentelemetry.io/contrib/instrumentation/github.com/gorilla/mux/otelmux v0.32.0
go.opentelemetry.io/contrib/instrumentation/net/http/otelhttp v0.32.0
go.opentelemetry.io/otel v1.7.0
go.opentelemetry.io/otel/exporters/otlp/otlptrace v1.7.0
go.opentelemetry.io/otel/exporters/otlp/otlptrace/otlptracegrpc v1.7.0
go.opentelemetry.io/otel/sdk v1.7.0
go.opentelemetry.io/otel/trace v1.7.0
github.com/XSAM/otelsql v0.14.1
All the dependencies can be installed using:
go mod tidy
go mod vendor
Step 3: Configure the OpenTelemetry collector
Ideally, you should start OpenTelemetry at the beginning of main, before any other services start running. When your program exits, call Shutdown on the SDK to ensure the last bit of telemetry is flushed before the program exits.
tp := config.Init(serviceName)
defer func() {
	if err := tp.Shutdown(context.Background()); err != nil {
		log.Printf("Error shutting down tracer provider: %v", err)
	}
}()
// tracer is later used to create spans
tracer = otel.Tracer(serviceName)
We also initialized the tracer which is later used to create custom spans.
Let’s now understand what does Init function in config/config.go does.
- Initialize exporter:
The exporter in SDK is responsible for exporting the telemetry signal (trace) out of the application to a remote backend, logging to a file, etc. In this demo, we are creating a gRPC exporter to send out traces to an OpenTelemetry Collector backend running at collectorURL (SigNoz). It also supports TLS and application auth using headers.secureOption := otlptracegrpc.WithTLSCredentials(credentials.NewClientTLSFromCert(nil, "")) // config can be passed to configure TLS if len(insecure) > 0 { secureOption = otlptracegrpc.WithInsecure() } exporter, err := otlptrace.New( context.Background(), otlptracegrpc.NewClient( secureOption, otlptracegrpc.WithEndpoint(collectorURL), otlptracegrpc.WithHeaders(headers), ), ) - Construct trace provider:
TracerProvider provides access to instrumentation Tracers. We configure it to sample all the traces and send the traces in batches to the collector. The resource describes the object that generated the telemetry signals. Essentially, it must be the name of the service or application. We set it toserviceName:traceProvider := sdktrace.NewTracerProvider( sdktrace.WithSampler(sdktrace.AlwaysSample()), sdktrace.WithSpanProcessor(sdktrace.NewBatchSpanProcessor(exporter)), sdktrace.WithResource(resource.NewWithAttributes(semconv.SchemaURL, semconv.ServiceNameKey.String(serviceName))), )
Now, we are ready to configure various components in our application.
Step 4: Instrument HTTP handler with OpenTelemetry
We are using gorilla/mux for the HTTP router. It can be instrumented with OpenTelemetry using otelmux:
router.Use(otelmux.Middleware(serviceName))
Now, all the HTTP calls pass through the OpenTelemetry middleware.
Our services communicate with each other using HTTP APIs. We need to configure our client to pass on the tracing metadata. We can do that using:
func SendRequest(ctx context.Context, method string, url string, data []byte) (*http.Response, error) {
	request, err := http.NewRequestWithContext(ctx, method, url, bytes.NewBuffer(data))
	if err != nil {
		return nil, fmt.Errorf("create request error: %w", err)
	}

	client := http.Client{
		// Wrap the Transport with one that starts a span and injects the span context
		// into the outbound request headers.
		Transport: otelhttp.NewTransport(http.DefaultTransport),
		Timeout:   10 * time.Second,
	}

	return client.Do(request)
}
The ctx parameter contains the tracing metadata of the parent span. So now the client sends the metadata and the server can extract this and connect the tracing information of various services.
Apart from the instrumentation already provided by otelhttp library, we might want to have custom spans for various purposes (e.g. trace database call, or trace function execution). We can do that using:
ctx, span := tracer.Start(r.Context(), "update user amount")
defer span.End()
We can also attach attributes, events, etc. to this span. Please refer to the documentation for that.
Step 5: Instrument MySQL with OpenTelemetry
Database lies in the hot path for most of the applications and any insights into its performance are valuable. We instrument it with the help of github.com/XSAM/otelsql. And while making any DB call, we pass on the context.
db, err = otelsql.Open("mysql", datasourceName(username, password, host, dbName), otelsql.WithAttributes(
		semconv.DBSystemMySQL,
	))
....
....
res, err := stmt.ExecContext(ctx, p.Vars...)
http://github.com/XSAM/otelsql is not yet officially supported by OpenTelemetry.
Running the sample Golang application
Step 1: Configuration
To set up OpenTelemetry to collect and export telemetry data, you need to specify OTLP (OpenTelemetry Protocol) endpoint. It consists of the IP of the machine where SigNoz is installed and the port number at which SigNoz listens.
OTLP endpoint for SigNoz - <IP of the machine>:4317
If you have installed SigNoz on your local machine, then your endpoint is 127.0.0.1:4317.
If you have installed SigNoz on some domain, then your endpoint is test.com:4317
Do not use http or https in the IP address.
Configuration for the following can be set up in .env
# service config
USER_URL=localhost:8080
PAYMENT_URL=localhost:8081
ORDER_URL=localhost:8082

# database config
SQL_USER=root
SQL_PASSWORD=password
SQL_HOST=localhost:3306
SQL_DB=signoz

# telemetry config
OTEL_EXPORTER_OTLP_ENDPOINT=localhost:4317
INSECURE_MODE=true
Step 2: Run the microservices
As we have already cloned the repo in the above section, from the root folder, run these commands, each in a separate terminal:
go run ./users
go run ./payment
go run ./order
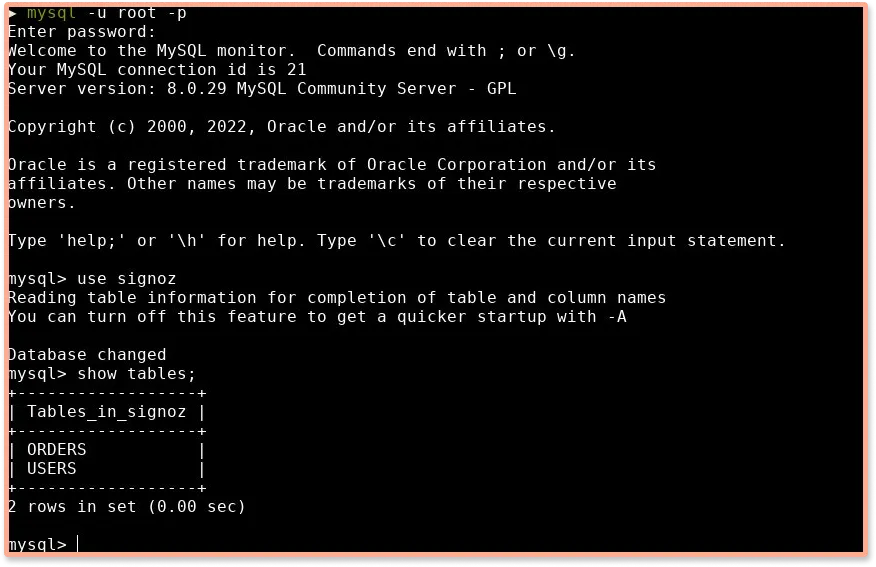
Step 3: Confirm table creation:
After running the services, check if the tables ORDERS and USERS are created using the commands below:
mysql> use signoz;
mysql> show tables;
Visualizing Distributed Tracing data with Signoz
To visualize the trace data with SigNoz, we first need to generate some user data by interacting with the frontend.
Generating user data by interacting with the sample app:
You need to generate some user data to see how it appears in the SigNoz dashboard. The sample application comes with a UI to interact with the app. Use the below command in the root folder to launch the UI:
serve -l 5000 frontend
Now go to the app frontend running at http://localhost:5000. Perform the below given steps 4-5 times to generate some data.
-
Create a user:
ClickCreate Userbutton to create a new user in the MySQL db.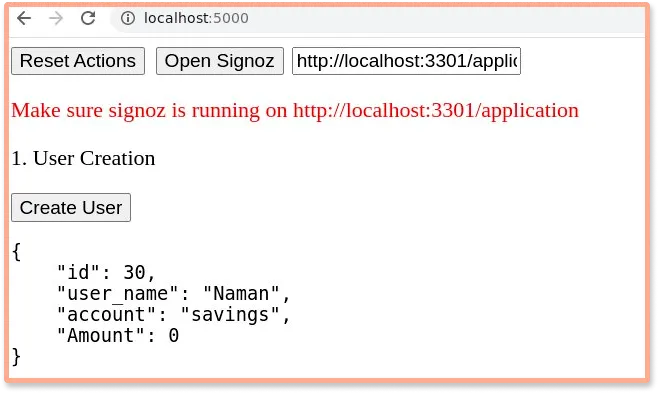
-
Transfer the fund:
Transfer some amount by clickingTransfer Fundbutton.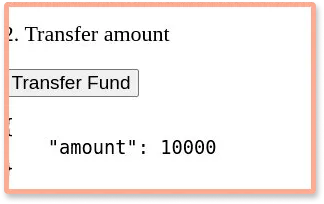
-
Place an order:
Place an order by selecting a product from the dropdown.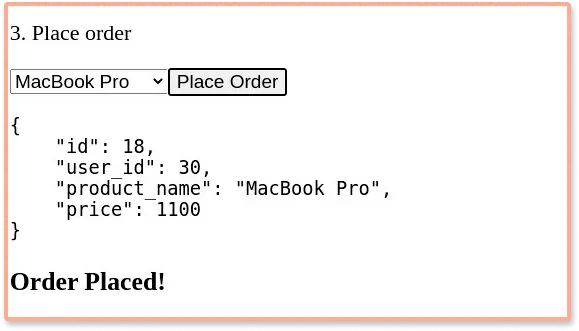
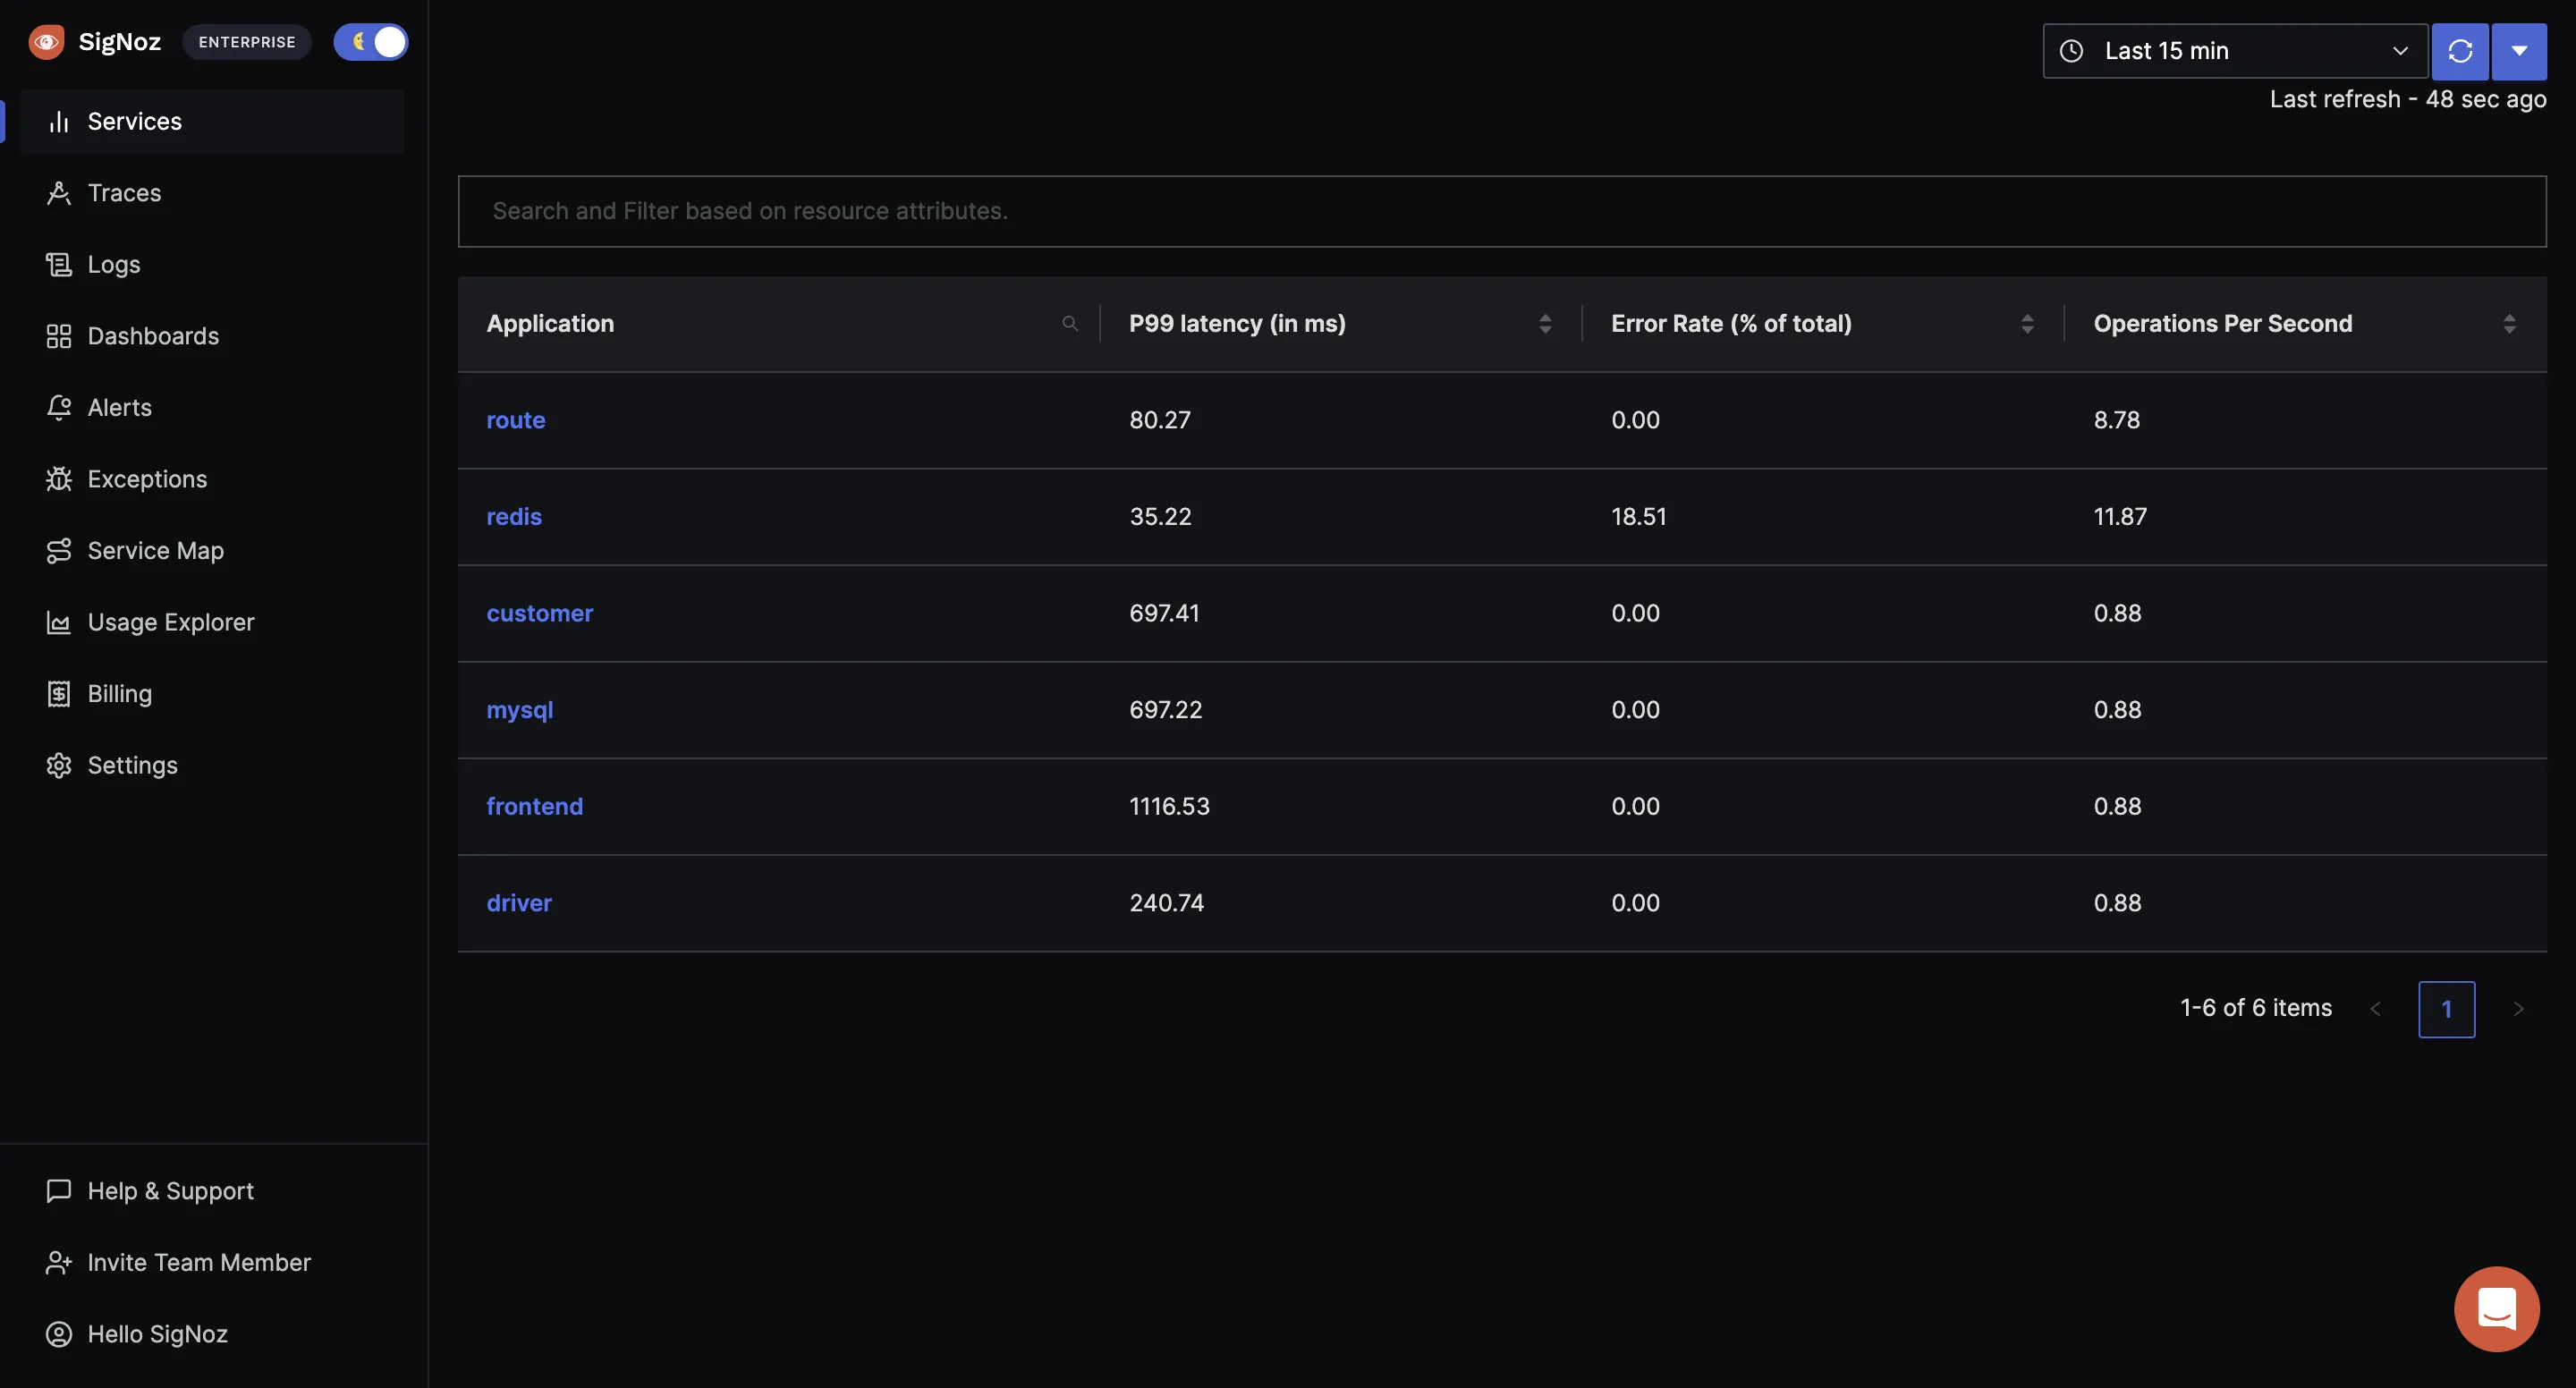
Now go to the SigNoz dashboard (running on http://localhost:3301/ by default), wait for some time, and refresh the dashboard. You will notice the list of service names that we configured:
- user-service
- order-service
- payment-service
Analyze traces and metrics using the Signoz dashboard
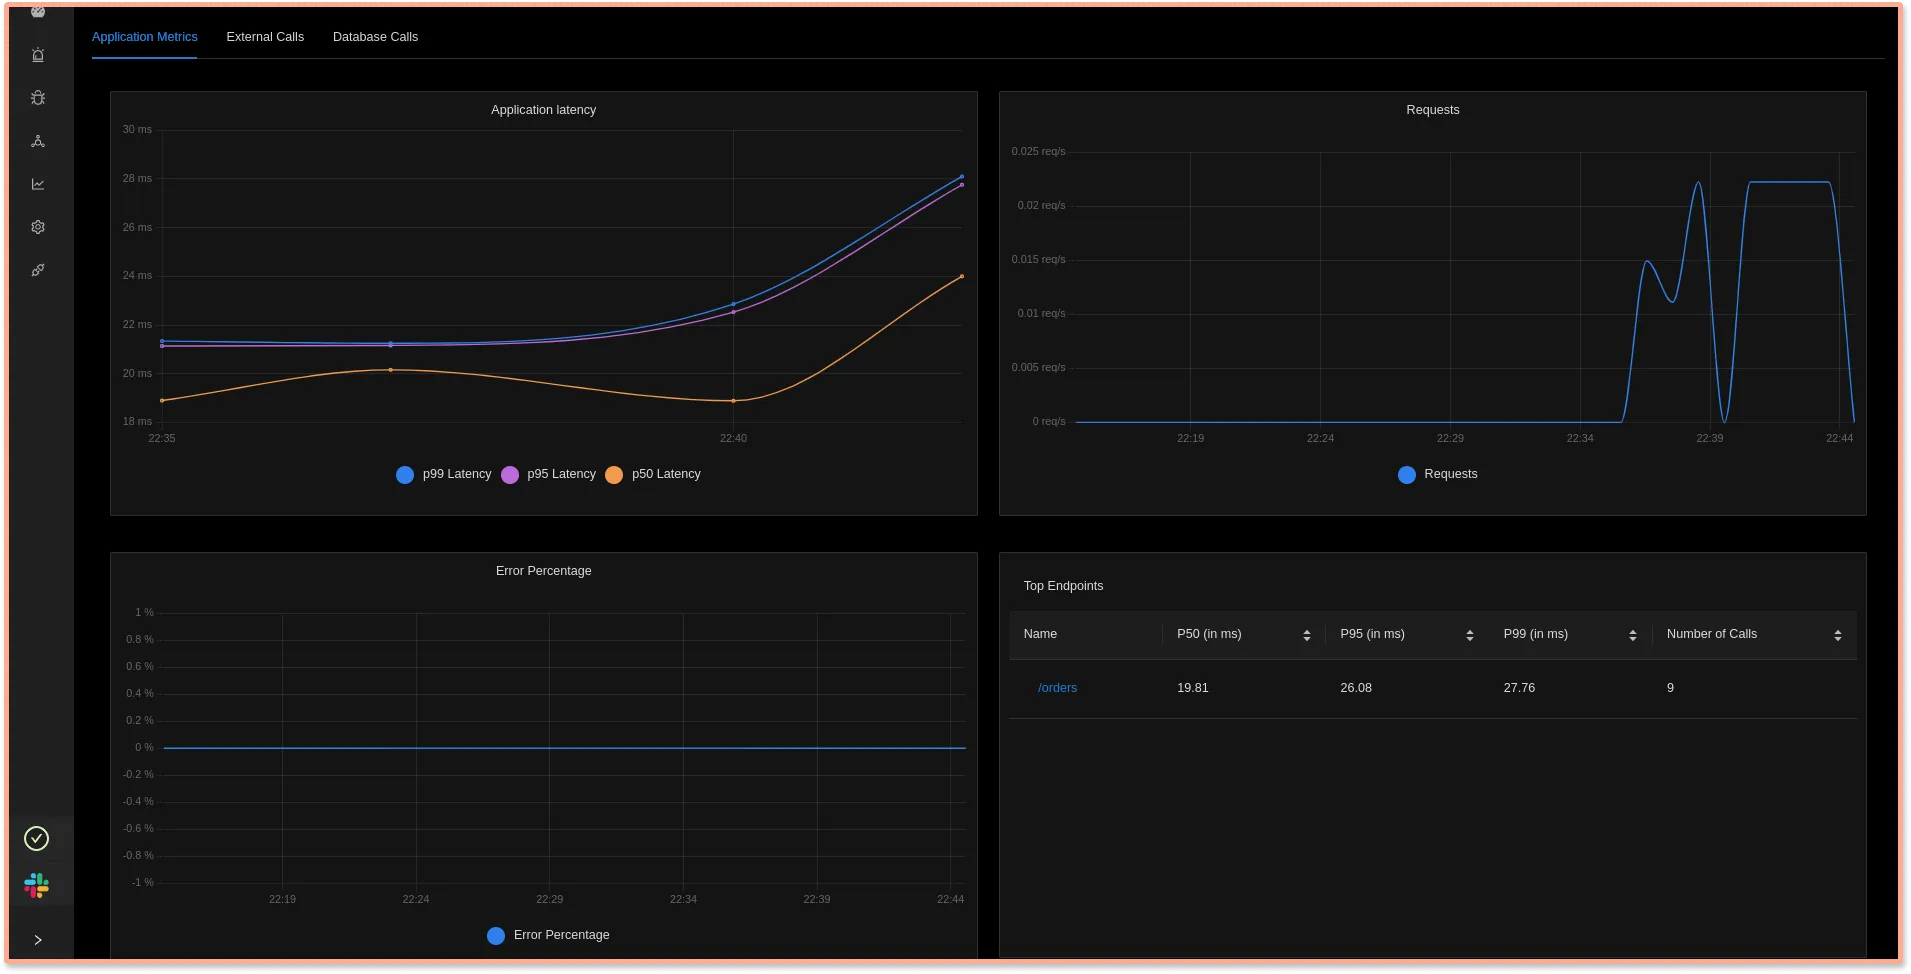
In the metrics tab, you can see Application Metrics, External Calls, and Database Calls:
Application metrics:
Here, we can see the application latency, requests per second(rps), error percentage, and the endpoints that were hit for a given service.
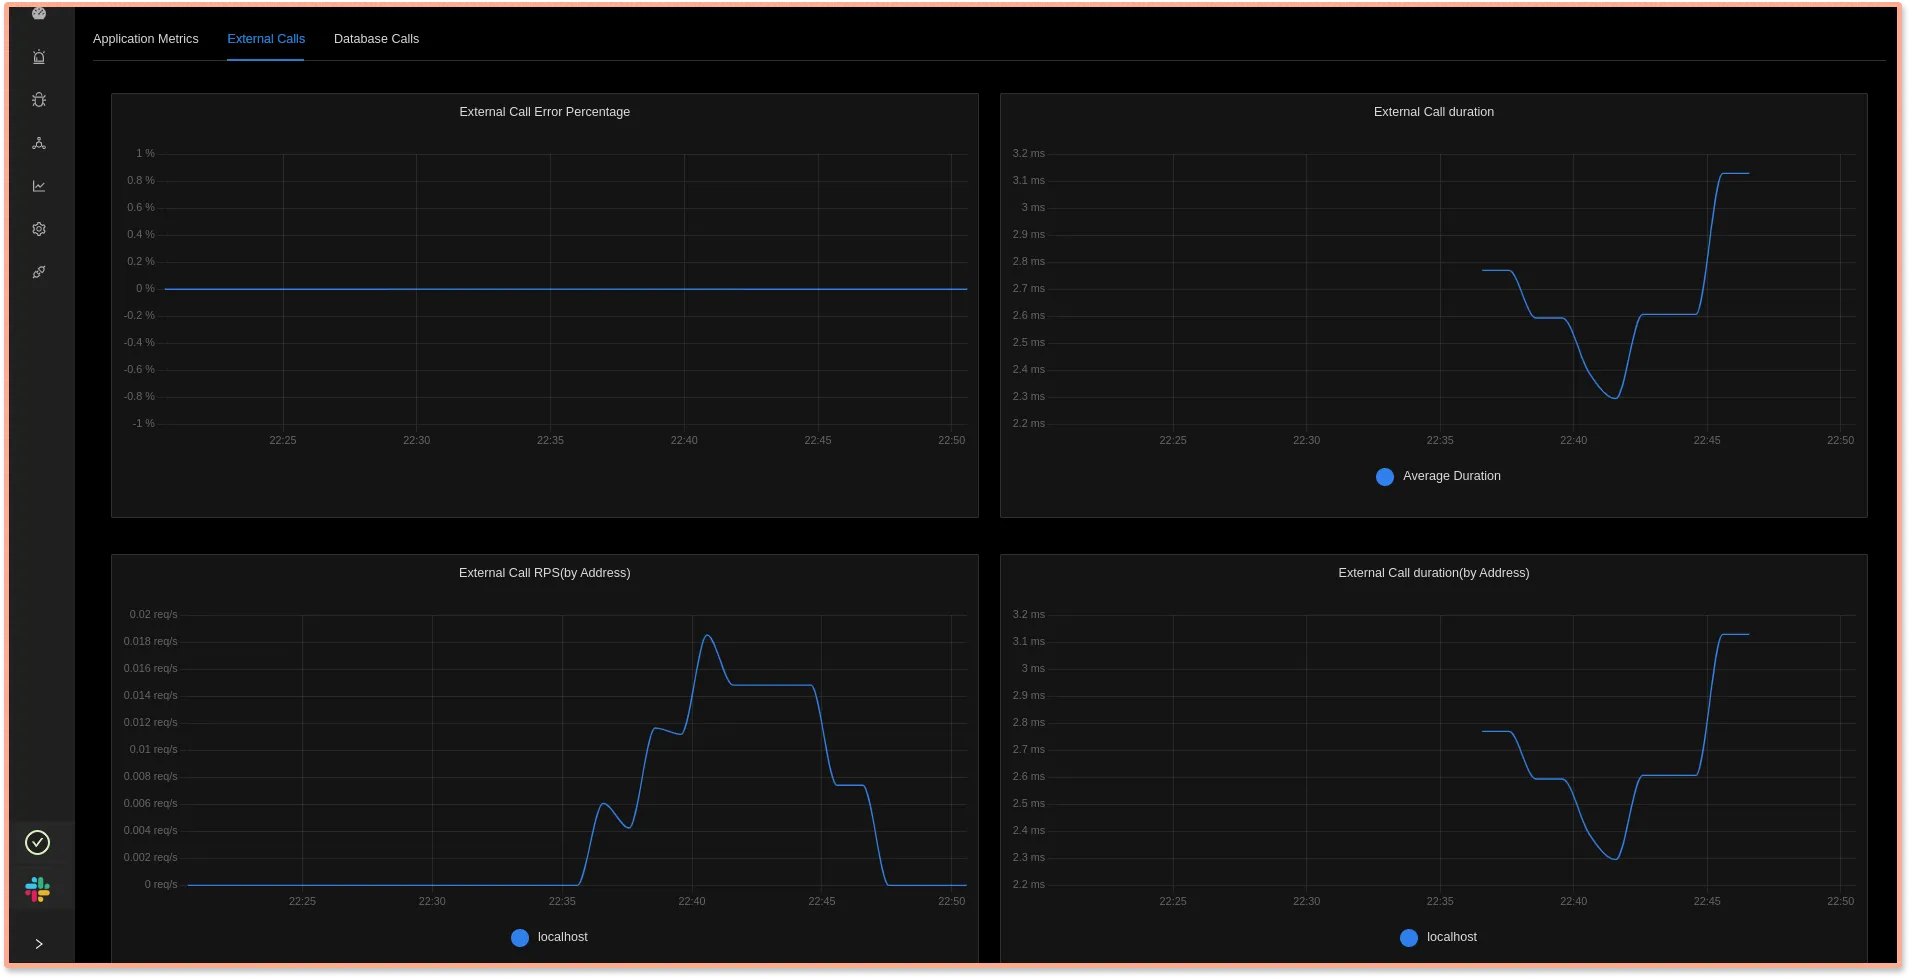
External Calls:
Here, you can see the metrics about the calls made to external services. In our case, we are running the services on localhost; hence we see a single line. Metrics like external call duration (by address) give a quick glimpse of the network connectivity with the external service. This might be useful to detect a network issue.
For more features on metrics, please read the documentation.
Identify latency issues with Flamegraphs and Gantt charts
You can inspect each event in the spans table with Flamegraphs and Gantt charts to see a complete breakdown of the request. Establishing a sequential flow of the user request along with info on time taken taken by each part of the request can help identify latency issues quickly. Let’s see how it works in the case of our sample Go app.
Go to the service name filter on the left and select order-service. Now select any span:
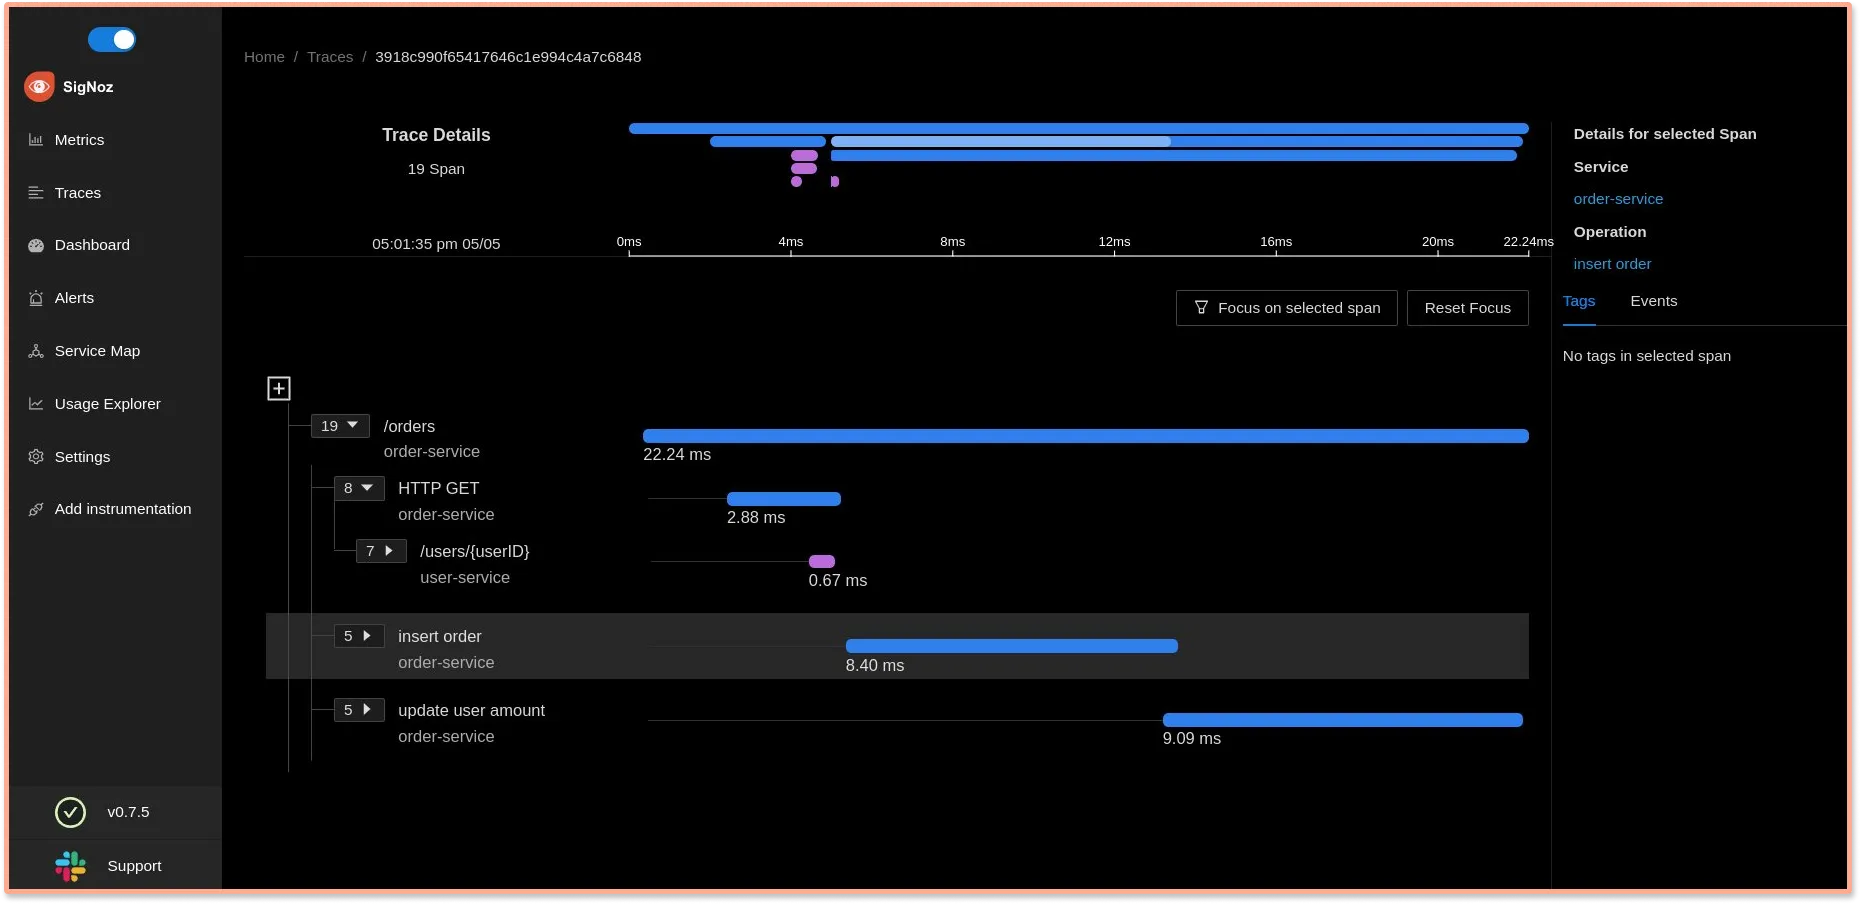
Here, expanding on insert order you will see the time utilised in various SQL DB calls.
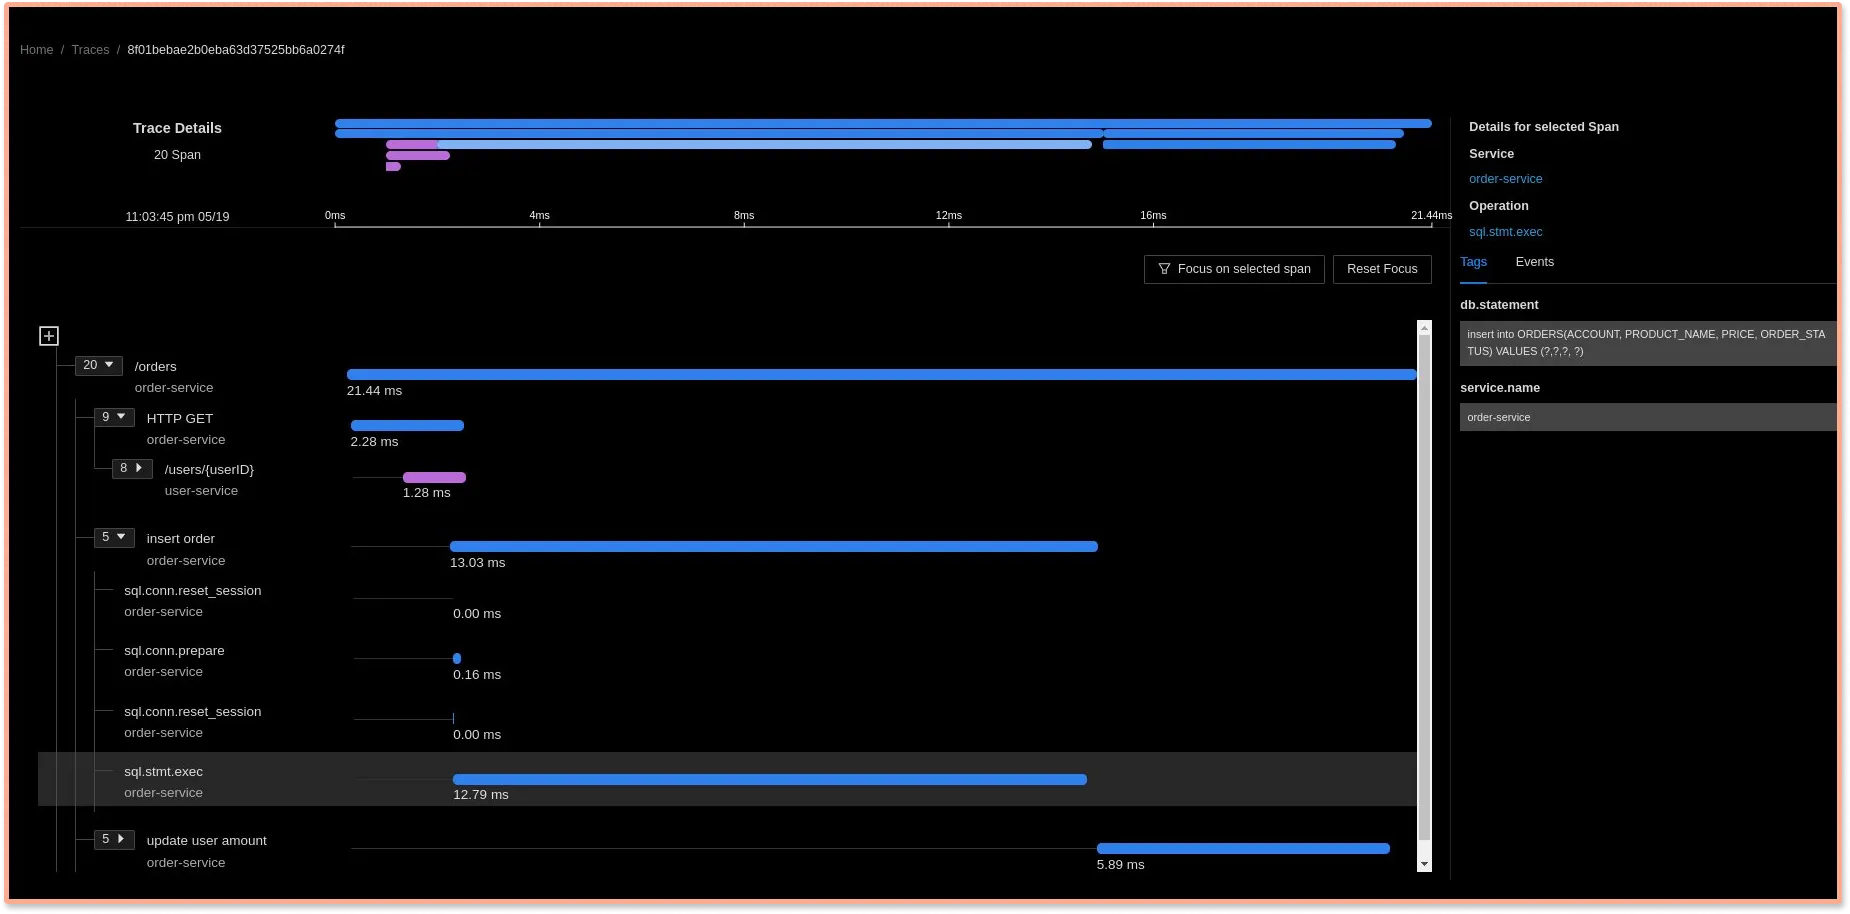
Also, note that we also have additional information about the query that was run in the tags panel on the right.
Conclusion
Distributed tracing is a powerful and critical toolkit for developers creating applications based on microservices architecture. For Golang applications using microservices architecture, distributed tracing can enable a central overview of how requests are performing across microservices.
This lets application owners reconstruct the whole path of the request and see how individual components performed as part of the entire user request.
OpenTelemetry and SigNoz provide a great open-source solution to implement distributed tracing for your applications. You can try out SigNoz by visiting its GitHub repo 👇
If you are someone who understands more from video, then you can watch the below video tutorial on the same with SigNoz.
If you have any questions or need any help in setting things up, join our slack community and ping us in #support channel

If you want to know more about distributed tracing or SigNoz, feel free to follow these links:
