Distributed tracing using Jaeger with Cassandra
With microservices becoming popular, tracing is increasingly more important in debugging production software. In this post, we take you through a step by step guide on setting up Jaeger over Kubernetes with Cassandra storage.

What is distributed tracing?
Distributed tracing, also called distributed request tracing, is a method used to profile and monitor applications, especially those built using a microservices architecture. Distributed tracing helps pinpoint where failures occur and what causes poor performance.
How does tracing differ from logs?
- Lack of structure in logs makes indexing and hence storage costly and no proper format to search while debugging. It's all in the mental model of the developer
- Logs are printed concurrently for application serving multiple requests making it difficult to debug and find the order of execution of a log line.
- Logs do not propagate context across services
A simple workaround for maintaining context across logs is passing a global requestId in the header when one service calls another service. A trace is more about an individual request and adding info to it as it moves across process boundaries, adding tags with valuable information about deployment versions, priority, IP, device info, etc.
Tools and cost to run it in-house
Zipkin and Jaeger are two popular choices for request tracing. Zipkin was originally inspired by Dapper and developed by Twitter. It’s now maintained by a dedicated community.
Jaeger was originally built and open-sourced by Uber. Jaeger is a Cloud Native Computing Foundation project.

- Instrument application using jaeger client libraries available in multiple languages
- JaegerClient sends spans to jaeger-agent which is usually deployed as a daemonSet in each host to receive UDP or HTTP spans. If we skip jaeger-agent and send spans directly to jaeger-collector then UDP spans may be missed
- Jaeger-Agent can be set to batch the span and sample data before sending to the collector which then stores to DB for persistence
- Jaeger supports Elastic, Cassandra and Kafka as backend databases but there is a github issue tracking integration of other storage plugins like BadgerKV and InfluxDB
- Jaeger Query service enables querying the DB for traces via UI
Factors on which cost depends:
- Level of instrumentation - detailed instrumentation means more spans
- RPS being served by applications - more requests being served means more traces
- Number of days of data retention needed - more days of data need more storage
- Infrastructure cost to run OSS tools
- Employee resource to set up and maintain OSS tools
I instrumented my applications using fork of DataDog client libraries. A set of 4 microservices were sending 40 spans/s to jaeger-collector with a rough load of 1 RPS to services. In 2 days, 172800 seconds, total spans saved = 40*172800 ~6.9M spans.
And Cassandra took 8.8GiB of disk space when used with a ReplicationFactor of 2. Thus, estimated storage needs would be 1.27 GiB per million spans.
We will share a more detailed analysis of the cost to run Jaeger in-house soon and shall compare the pricing of existing vendors in the APM space.
Set up Jaeger for Kubernetes
We shall install Jaeger from Helm chart. The other recommended way to install Jaeger is using Jaeger Operator but I find the native Jaeger helm chart easier.
Install Prometheus Operator for enabling ServiceMonitor and visualising metrics about Jaeger by running: helm install stable/prometheus-operator
Add JaegerTracing repo to your helm helm repo add jaegertracing https://jaegertracing.github.io/helm-charts
The below chart will deploy jaeger-agent as a DaemonSet and deploy the jaeger-collector and jaeger-query components as Deployments. Check the helm repo of Jaeger this Link.
We need to modify the values.yaml file:
provisionDataStore.cassandra=true- This the default value. This will create a new Cassandra cluster. If we wish to use an existing Cassandra cluster check this- Enable persistence in Cassandra
cassandra.persistence.enabled=true - Enable serviceMonitor for exposing Jaeger related metrics to Prometheus
serviceMonitor:
enabled: true
additionalLabels: {release: prometheus}
- Enable sample application already instrumented to send metrics to jaeger-agent. Read the full blog post on this medium blog. For now, we just need to set
hotrod.enabled=true
With the new values.yaml file, install Jaeger with the below command:
helm install jaeger jaegertracing/jaeger -f values.yaml
Watch status of pods by running
kubectl get pods -w
Now wait for Cassandra cluster to get ready. The collector and query service will restart several times before the DB is ready.
More about Cassandra setup in Jaeger
Looking at schema creation script at Jaeger Repo, the default retention period of traces in Cassandra is set to 2 days
TRACE_TTL - time to live for trace data, in seconds (default: 172800, 2 days)`
The Replication Factor is 2 and LZ4Compressor is used to compress trace data.
Now run,
kubectl exec -it jaeger-cassandra-0 /bin/bash
nodetool status, the below is the result: 
Table Names: dependencies_v2, duration_index, operation_names_v2, service_name_index, service_names, service_operation_index, tag_index, traces
Sample application to see tracing in work
We enabled HotROD application while installing Jaeger from helm chart, remember?

To access the UI of the HotROD application run
kubectl port-forward svc/jaeger-hotrod 4000:80
The below screen will be visible. Click on a few buttons and check whether you get a response about a driver arriving in some time, something like below.

Now to access the Jaeger UI run
kubectl port-forward svc/jaeger-query 8080:80
You will see a dashboard like below:


- Each title in trace list displays the service which started the trace, the operation name set and the time taken by the trace on the RHS
- The body shows the total number of spans in the trace and number of errors highlighted in red color
- The body shows the services through which the trace has passed through
- The RHS of the body also shows the time of the trace
From the right panel of dashboard, you can choose to order traces based on the longest trace or most number of spans or most recent traces.
Now, click on a trace to view the details of a single trace. An individual trace consists of many spans where each span represents a unit of operation performed by the application like calling mysql or redis or other services. The spans have parent-child relationships and correctly represent the order of execution (sequential or parallel) along with the time taken by each span.

Clicking on span from mysql service shows the exact query executed and the time it takes. Ideally, you should mask queries that have personal data. You need to check how this is handled with Jaeger instrumentation or from the collector side.

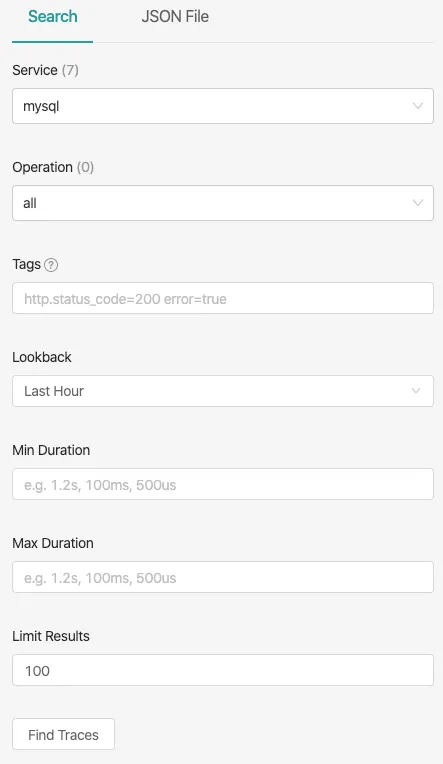
The below image shows the left panel of Jaeger-UI in detail. You can filter to see traces of mysql service which took more than 1s by choosing Service and Min Duration filter.
You can also filter based on Operation of that service and if you wish to see all the traces where mysql service responded with an error, just set the Tags filter with value error=true. We can also filter based on various other tags that you have instrumented.
Since we now know that instrumentation plays a big role in being able to filter and analyse traces based on tags. Most of the OpenCensus libraries provide auto-instrumentation libraries for different languages.
OpenTracing and OpenCensus are merged to OpenTelemetry to provide a vendor neutral instrumentation
Monitor Jaeger using Prometheus and Grafana
Run
kubectl port-forward svc/prometheus-grafana 3000:80
to proxy to grafana dashboard installed in your Kubernetes cluster. At the login page fill the below credentials which is the default setting when installing prometheus-operator:
username: admin
password prom-operator
Go to Dashboards -> import and add id 10001 and choose data source as Prometheus. The publicly available dashboard can be found at this link. You need to generate a sufficient amount of traffic to your sample application to get such graphs.

The above dashboard is of Jaeger Collector which displays:
- Spans received per second
sum(rate(jaeger_collector_spans_received_total[5m])) - Average in-queue latency
- Batch size of spans
- Queue length
- Spans dropped per second
- Latency to save span to DB


- Write Error Rate
sum(rate(jaeger_cassandra_errors_total[5m]))*100/sum(rate(jaeger_cassandra_attempts_total[5m])) - Read Error Rate
sum(rate(jaeger_cassandra_read_errors_total[5m]))*100/sum(rate(jaeger_cassandra_read_attempts_total[5m])) - Write Duration by table
increase(jaeger_cassandra_latency_ok_sum[5m])/increase(jaeger_cassandra_latency_ok_count[5m]) - Writes per second by table
sum(rate(jaeger_cassandra_inserts_total[5m])) by (table)
How to find issues from the Flame graph
Chapter 9 from this book from Yuri Shkuro, the author of Jaeger gives details on how to find patterns in your tracing data which are likely indicative of a performance issue.

Look For Error Markers
Error in a span The spans with tag
error=trueare marked in red and can provide useful information about the error in the logs section or other tags.Look for the longest span on the critical path
Optimising for the longest span Optimising time taken by the longest span in the trace would help the most in reducing the trace time.
Look out for the missing details
Instrumentation gap Probably the server was waiting on a database query and our database driver is not instrumented for tracing. Whenever a considerable portion of the trace is unaccounted for, ask for instrumentation.
Avoid Sequential Execution Or "STAIRCASE"
Sequential Execution The staircase pattern means sequential execution. This may require a deeper look into whether it is intended or it is happening unintentionally, if such, there lies a scope of improvement. For example, I have seen many times where using an object-relational mapping (ORM) library has produced the "staircase" pattern without the developer even realizing that it is happening.
Be wary when things finish at exactly the same time
Spans finishing at same time What could cause a series of spans to finish at exactly the same time? One possible explanation is when the system supports timeouts with cancellations. In the above figure, the top-level span may have been waiting for the four tasks to finish, but since they did not complete in the allotted timeframe, it canceled them and aborted the whole request. In this scenario, we may want to tune the timeout parameter or to investigate why the individual work units were taking longer than anticipated.
Another example where we can observe this pattern is when there is a resource contention and all the requests are waiting on some lock, such as a long-running database transaction from another request that locked the table. Once the lock is released, our units of work can complete quickly. We may want to investigate what it is that is blocking all these spans, by adding additional instrumentation.
Conclusion
I have been working with Jaeger and see a lot of potential in improving the UI of traces. More importantly, I would say there is a need to merge monitoring and tracing for the following reasons:
- Prometheus gives us aggregated metrics, which is great for getting alerts on an erroneous service or a spike in latency. To debug it, we need to drill down to traces in during that time and figure out exactly which spans and tags of traces during that time need inspection.
- Tracing alone does not provide the overall performance of a service. We may need to maintain SLAs of individual services and hence looking into anomalies in traces of that service needs attention on priority.
I am also analyzing the cost of running Jaeger in-house and the price APM vendors ask. I think there is a huge gap in between. If it remains the case companies will always be confused whether to use commercial vendors or run everything in-house.
For any Jaeger/Tracing related queries, I am reachable at:
On a mission to make observability essential and affordable to every business
