Using Jaeger for your microservices
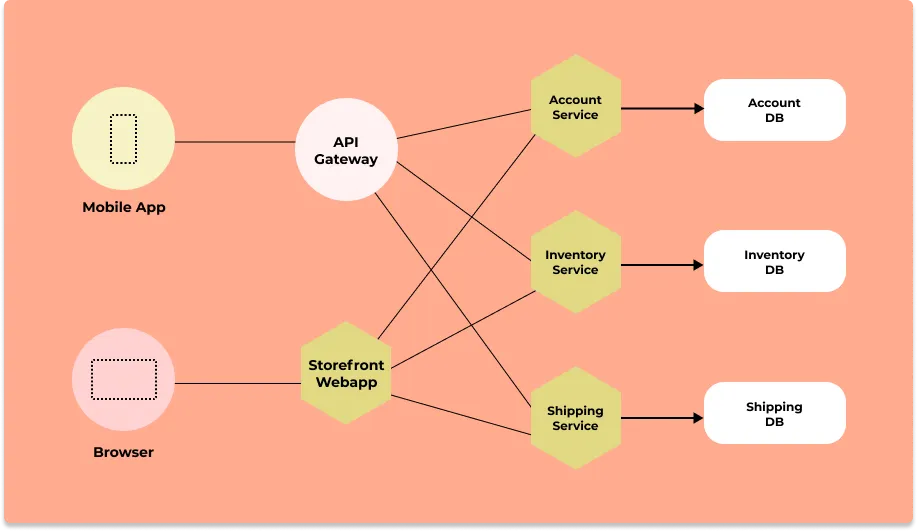
Jaeger is a popular open-source tool used for distributed tracing in a microservice architecture. In a microservice architecture, a user request or transaction can travel across hundreds of services before serving what a user wants. Distributed tracing helps to track the performance of a transaction across multiple services.
Jaeger is a fantastic open-source tool for distributed tracing. But for effective resolution of production issues, engineering teams need both metrics and traces. SigNoz, a full-stack open-source tool, provides a unified UI for both metrics and traces.
Before we deep dive into how Jaeger accomplishes distributed tracing for microservices-based architecture, let's take a short detour to understand distributed tracing.
What is distributed tracing?
In the world of microservices, a user request travels through hundreds of services before serving a user what they need. To make a business scalable, engineering teams are responsible for particular services with no insight into how the system performs as a whole. And that's where distributed tracing comes into the picture.
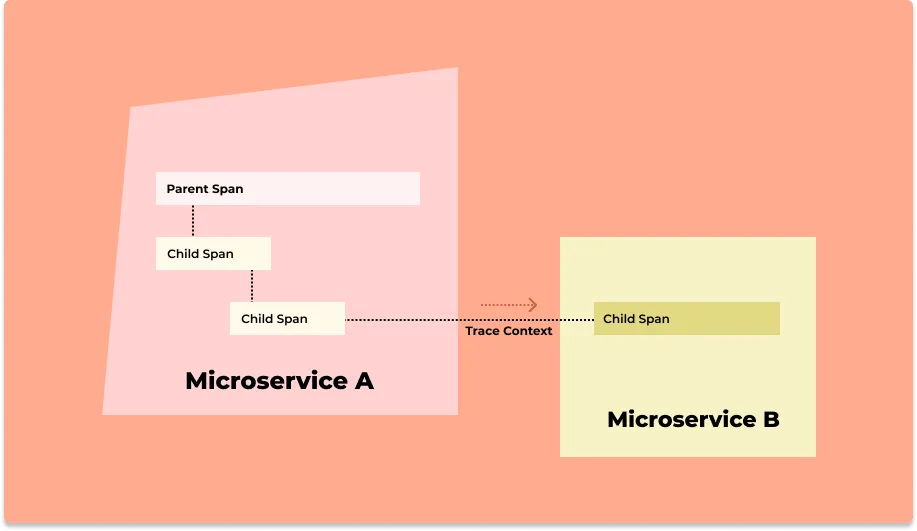
Distributed tracing gives you insight into how a particular service is performing as part of the whole in a distributed software system. There are two essential concepts involved in distributed tracing: Spans and trace context.
Read our complete guide on Distributed Tracing
User requests are broken down into spans.
What are spans?
Spans represent a single operation within a trace. Thus, it represents work done by a single service which can be broken down further depending on the use case.
A trace context is passed along when requests travel between services, which tracks a user request across services. Thus, you can see how a user request performs across services and identify what exactly needs your attention without manually shifting through multiple dashboards.
What is Jaeger?
Jaeger is a distributed tracing tool meant to monitor and troubleshoot transactions in a microservice architecture. It was developed by teams at Uber and then open-sourced in 2015. It was accepted as a Cloud Native Computing Foundation (CNCF) Incubation project in 2017 and was promoted to graduate status in 2019.
With Jaeger you can generate and visualize trace data, which gives you an idea of how your requests are performing across services.
How does Jaeger track transactions across a microservice architecture?
There are four key components to a distributed tracing tool. These components together capture transactions into spans and then correlate those spans to form a trace.
The four key components are:
- Instrumentation
- Data pipeline
- Backend Storage
- Web UI/Visualization
Let us see in detail what these components are and how these components come together to monitor a microservice architecture.
Instrumentation
What is instrumentation?
Instrumentation is the process of generating telemetry data(logs, metrics, and traces) from your application code. It is essentially writing code that enables your application code to emit telemetry data, which can be used later to investigate issues.
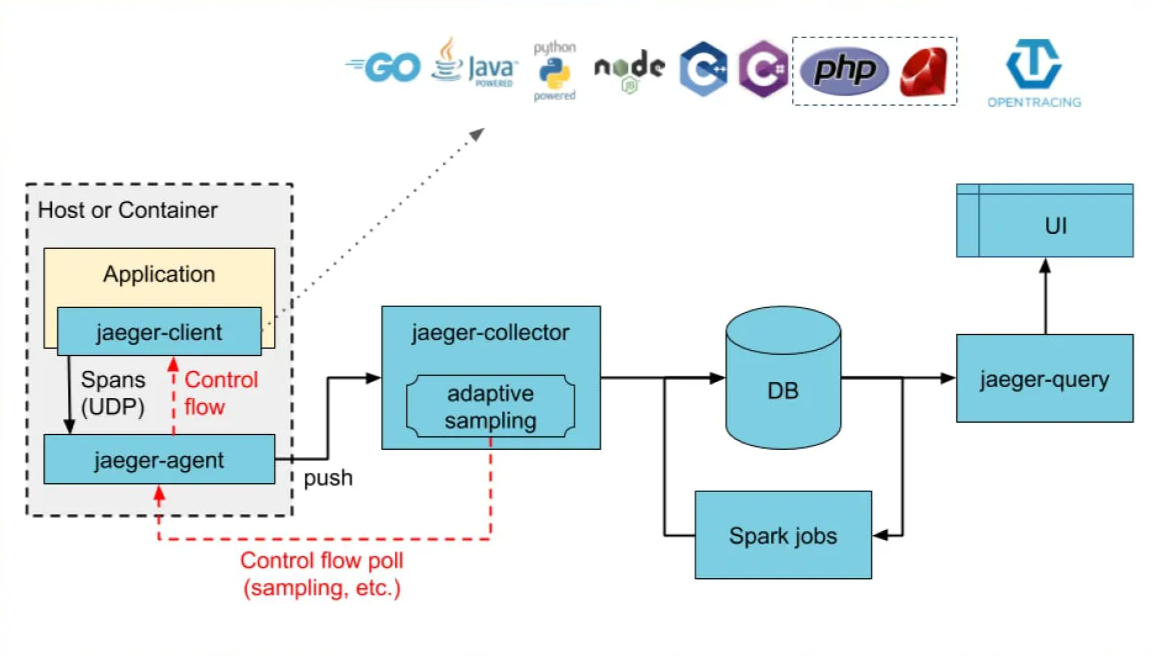
Most distributed tracing tools offer clients libraries, agents, and SDKs to instrument application code. Jaeger's client libraries for instrumentation are based on OpenTracing APIs.
OpenTracing was an open-source project aimed at providing vendor-neutral APIs and instrumentation for distributed tracing. It later got merged into OpenTelemetry. Jaeger has official client libraries in the following languages:
- Go
- Java
- Node.js
- Python
- C++
- C#
When a service is instrumented, it generates spans for incoming transactions and attaches trace context to outgoing transactions.
Data pipeline
Once the trace data is collected with the help of client libraries, it can be directly sent to the storage backends for storage and visualization. But it's a good practice to have a tracing pipeline for data buffering as the application scales. The pipeline enables receiving data in multiple formats, manipulation, batching, indexing, and queueing.
Jaeger provides Jaeger collectors, as seen in the architecture diagram. The collectors validate traces, index them and perform any transformation before storing the trace data.
Backend Storage
Jaeger ships with simple in-memory storage for testing setups. Jaeger supports two popular open-source NoSQL databases as trace storage backends:
- Cassandra
- ElasticSearch
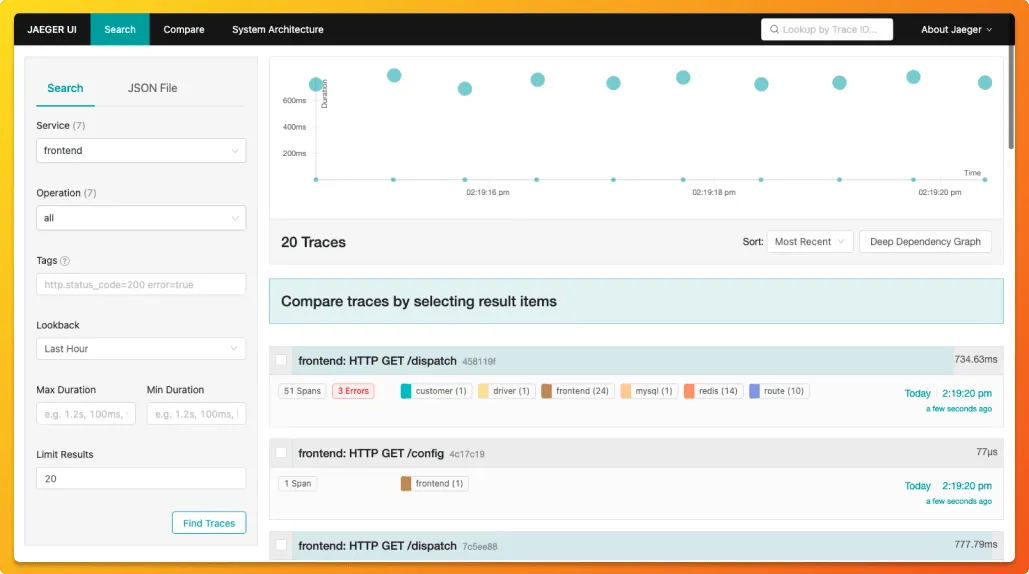
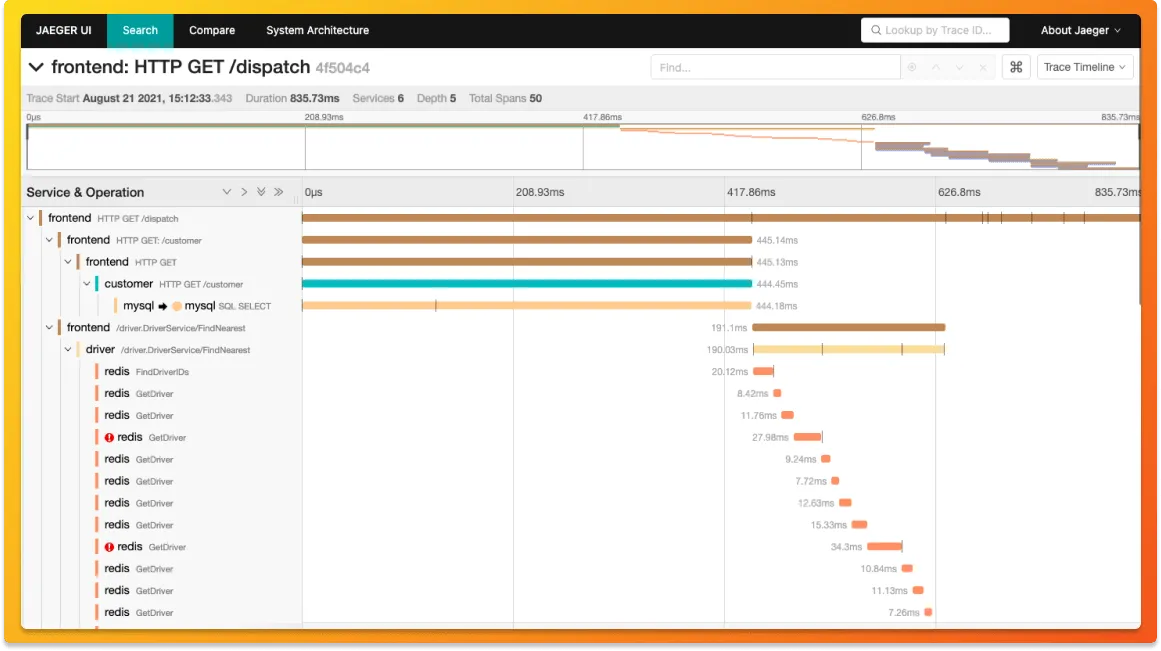
Web UI/Visualization
Jaeger's UI is basic but comprehensive when it comes to distributed tracing.
Challenges of using Jaeger
Jaeger is a preferred choice when it comes to distributed tracing. But engineering teams need more than traces to resolve issues quickly. They need access to both metrics and traces. Metrics such as response times, error rates, request rates, and CPU usage are equally important to understand application performance.
A few key challenges of using Jaeger as a distributed tracing tool are as follows:
- Only provides trace data. You will have to use another tool for metrics and log management.
- Databases supported by Jaeger need active maintenance.
- Jaeger's web UI is limited with basic visualizations.
For a fast-moving engineering team, you need dashboards that can drive quick insights and resolution. And that's where SigNoz comes into the picture. It is a great alternative to Jaeger for distributed tracing in microservices.
SigNoz - a Jaeger alternative for microservices
SigNoz is a full-stack open-source application performance monitoring and observability tool which can be used in place of Jaeger. SigNoz is built to support OpenTelemetry natively. OpenTelemetry is becoming the world standard to generate and maintain telemetry data(Logs, metrics, and traces).
SigNoz can be used as a distributed tracing tool for a microservice architecture.
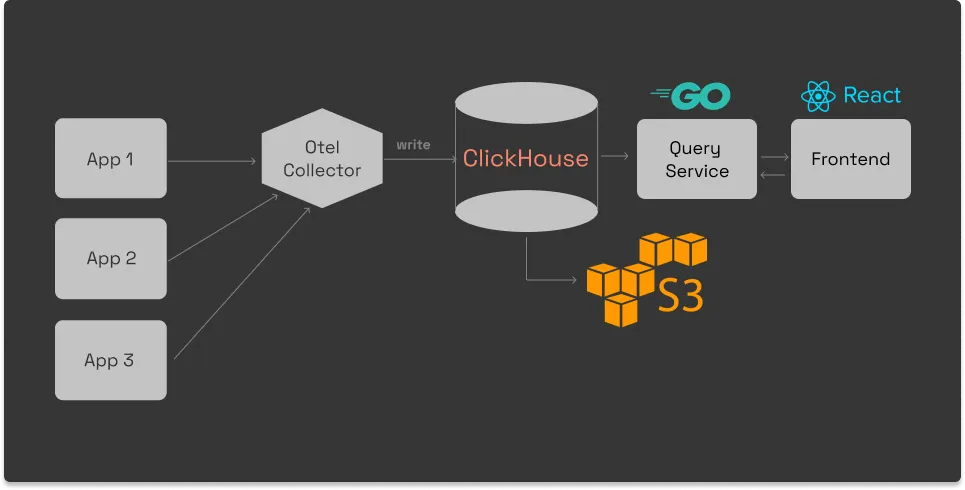
It also provides a fast OLAP datastore, ClickHouse as the storage backend.
SigNoz comes with out of box visualization of things like RED metrics.

You can also use flamegraphs to visualize spans from your trace data. All of this comes out of the box with SigNoz.

Some of the things SigNoz can help you track:
- Application overview metrics like RPS, 50th/90th/99th Percentile latencies, and Error Rate
- Slowest endpoints in your application
- See exact request trace to figure out issues in downstream services, slow DB queries, call to 3rd party services like payment gateways, etc
- Filter traces by service name, operation, latency, error, tags/annotations.
- Run aggregates on trace data
- Unified UI for both metrics and traces
Getting Started with SigNoz
SigNoz Cloud is the easiest way to run SigNoz. Sign up for a free account and get 30 days of unlimited access to all features.

You can also install and self-host SigNoz yourself since it is open-source. With 24,000+ GitHub stars, open-source SigNoz is loved by developers. Find the instructions to self-host SigNoz.
Related Content
Jaeger distributed tracing - complete guide
Jaeger vs SigNoz
