Diving in to OpenTelemetry data with our new Trace and Logs Explorer
The team at SigNoz would like to share recent developments released this month that greatly enhance the ability to dynamically query your trace and log data. With these tools anyone can explore complex OpenTelemetry data and gain insight into their stack.
Taking ClickHouse Queries beyond SQL
These capabilities are now part of the broader query builder that powers log and trace exploration.
We've talked recently about how ClickHouse, the datastore that SigNoz uses, allows powerful queries into your observability data. But with any query language you're going to limit the reach of your data for two reasons:
Only those who can write queries can build new charts
While ClickHouse queries are written in SQL and should be familiar to many many developers, the goal of DevOps is, after all, a sharing of operational and dev knowledge as far as possible. Requiring everyone to write queries will always have limits, creating one group who create dashboards and another who just view them.
You often have to know what data is present to work with it
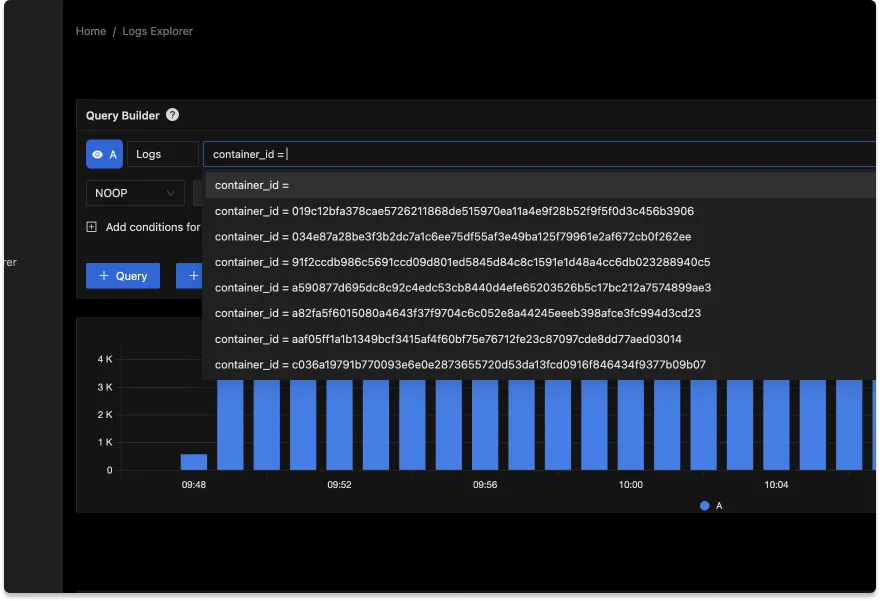
I'll say that as a die-hard SQL user, you absolutely can explore your data just using queries. But it's immensely helpful in this query builder that completions for your queries, both with attribute names and attribute values. For example, I wanted to look at log lines only for a single container ID. Instead of having to query and pick an ID, the explorer suggests some frequent values.
Let's talk about what else the new Explorer pages enable:
1. Compare results by charting multiple queries together
Comparison may be the death of joy, but with our multiple query interface you can create a perfect way to find correlations, compare performance, or just see trends.
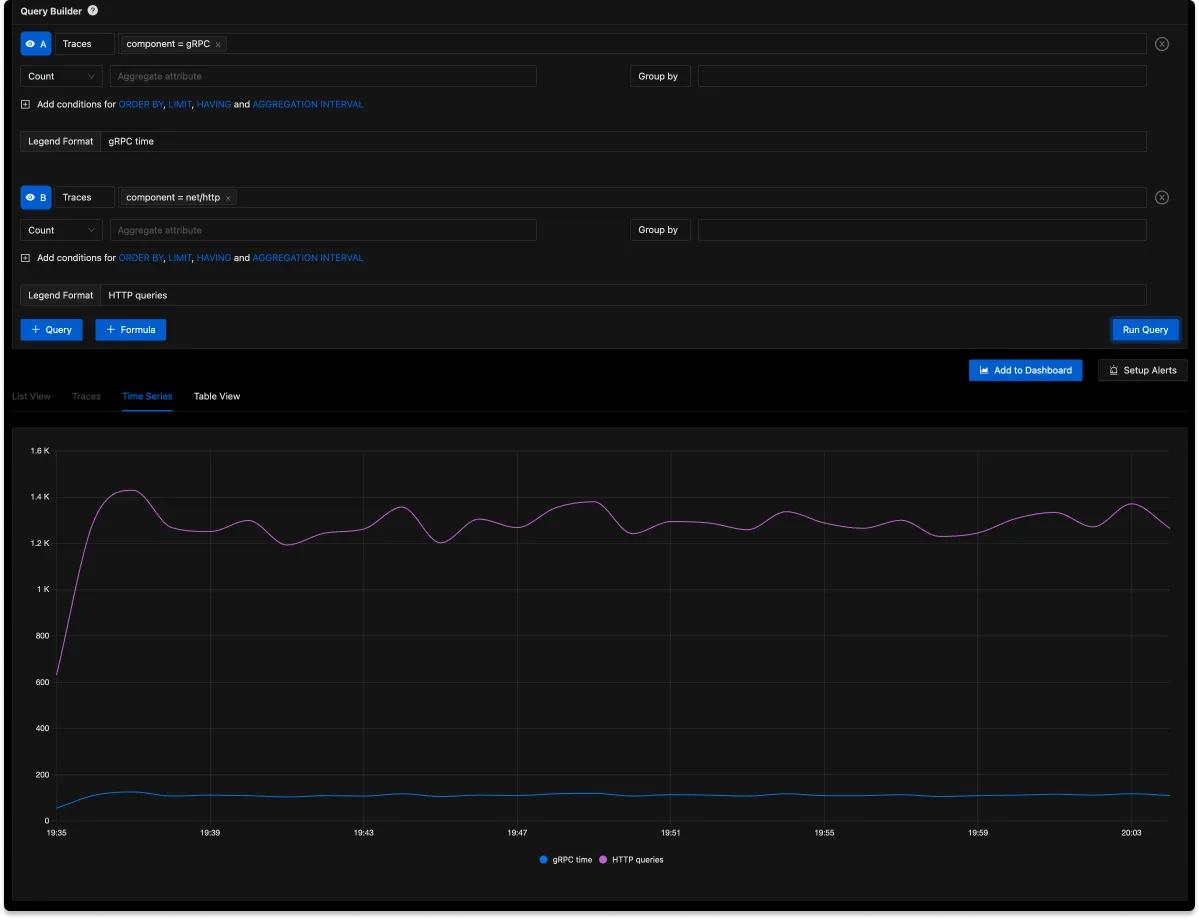
You can customize the legends on charts to make the results more readable
2. Timeseries, tables, and lists
Every observability dashboard tool is going to need custom data views, because no one knows what your data really means better than you do. It may be that timeseries like the one above are meaningful, but you may prefer a simple list of results.
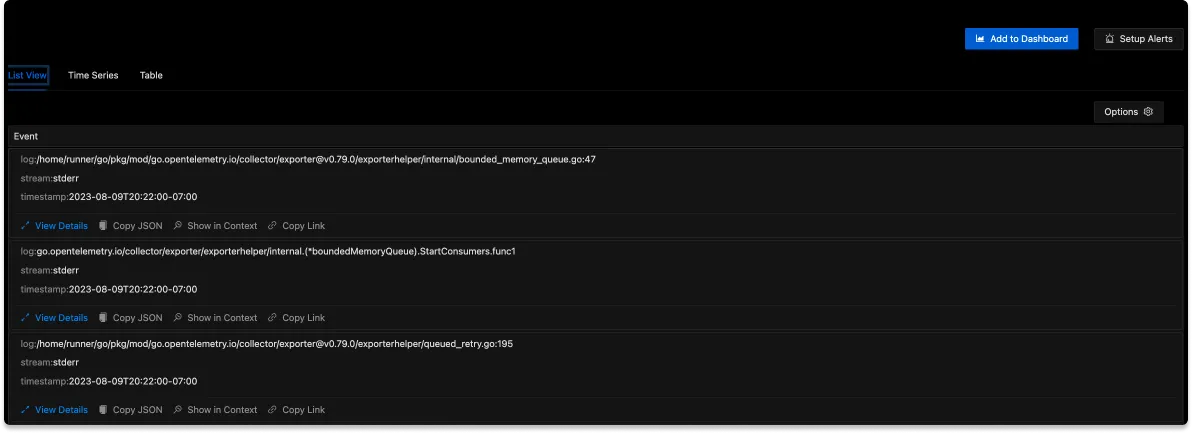
or a table view that aggregates results together:
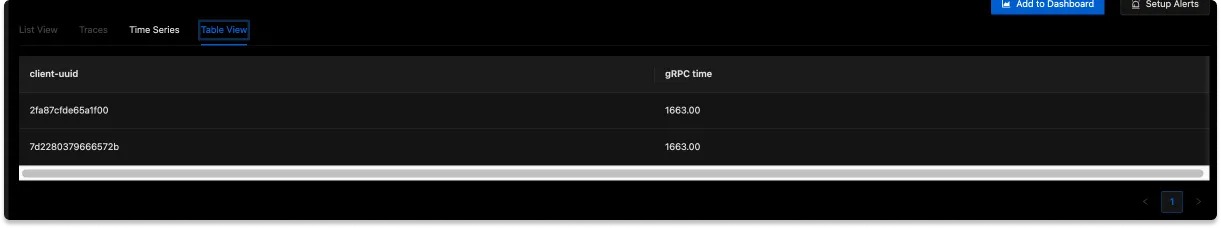
It may be that time correlation isn't the goal, you can still add lists and table views to your dashboards!
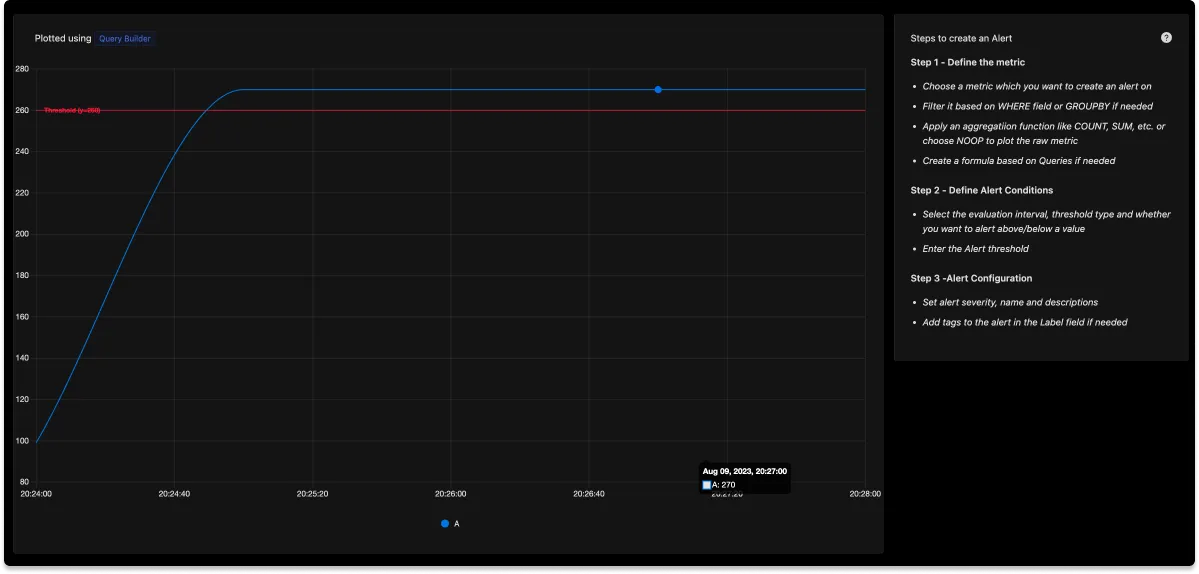
3. Alerts based on your queries
Directly from results you can add the query to a dashboard and set up an alert. For logs, this makes the timeseries view especially useful, as you can now create an alert when a certain event is logged beyond a certain rate.
Conclusion
In the ever-evolving landscape of observability tools, SigNoz continues to make significant strides towards providing an open-source alternative to proprietary solutions.
By addressing the inherent limitations of query-based exploration, SigNoz has broken down barriers that often restrict meaningful engagement with observability data. Our new query builder for logs and traces allows teams to bring in SRE's and Operations Engineers to the process of querying their observability data.
Once you're getting good OpenTelemetry data, you'll be amazed by how many teams want access to it. After that, the need for custom views, dashboards, and visualizations is sure to follow. Our query tools will allow you to share OpenTelemetry data further within your team.
Get Started - Free to get started quickly and unlock the full potential of your OpenTelemetry data.
