The Top 9 Dynatrace Alternatives & Competitors in 2026
Are you looking for a Dynatrace alternative? Then you have come to the right place. In this article, we will go through the top 9 Dynatrace alternatives. First, let's briefly discuss what Dynatrace offers and why you might consider other solutions.

No host-based pricing, no complex licensing. Get full-stack observability with simple usage-based pricing you can actually predict.
Get Started - FreeUnderstanding Dynatrace and the Need for Alternatives
Dynatrace is a leading observability and application performance management (APM) platform, providing deep insights into application performance and reliability. It supports a wide range of use cases, such as infrastructure observability, application security, business analytics, and automation, optimizing application performance in complex and dynamic environments.
However, Dynatrace may pose challenges for some users due to its complexity, potentially making it less accessible for those who wish to quickly grasp and utilize the data effectively. Organizations often seek alternatives to:
- Reduce expenses
- Simplify their monitoring stack
- Find more specialized solutions
- Explore open-source options
Additionally, while its usage-based pricing model is flexible, the overall costs could be high for large enterprises with extensive monitoring demands. The pricing often doesn't perfectly match usage patterns, especially as data volumes increase with the growth of an organization's IT infrastructure. In cases where customers commit annually, there's also the risk of overpaying for unused services, which might not suit smaller companies or those with particular monitoring needs.
To address some of these concerns, we have curated a list of good alternatives to Dynatrace that can be considered.
List of top Dynatrace alternatives in 2024:
- SigNoz (open-source)
- Datadog
- AppDynamics
- New Relic
- ManageEngine Applications Monitor
- Sematex
- LogicMonitor
- Sumo Logic
- Splunk
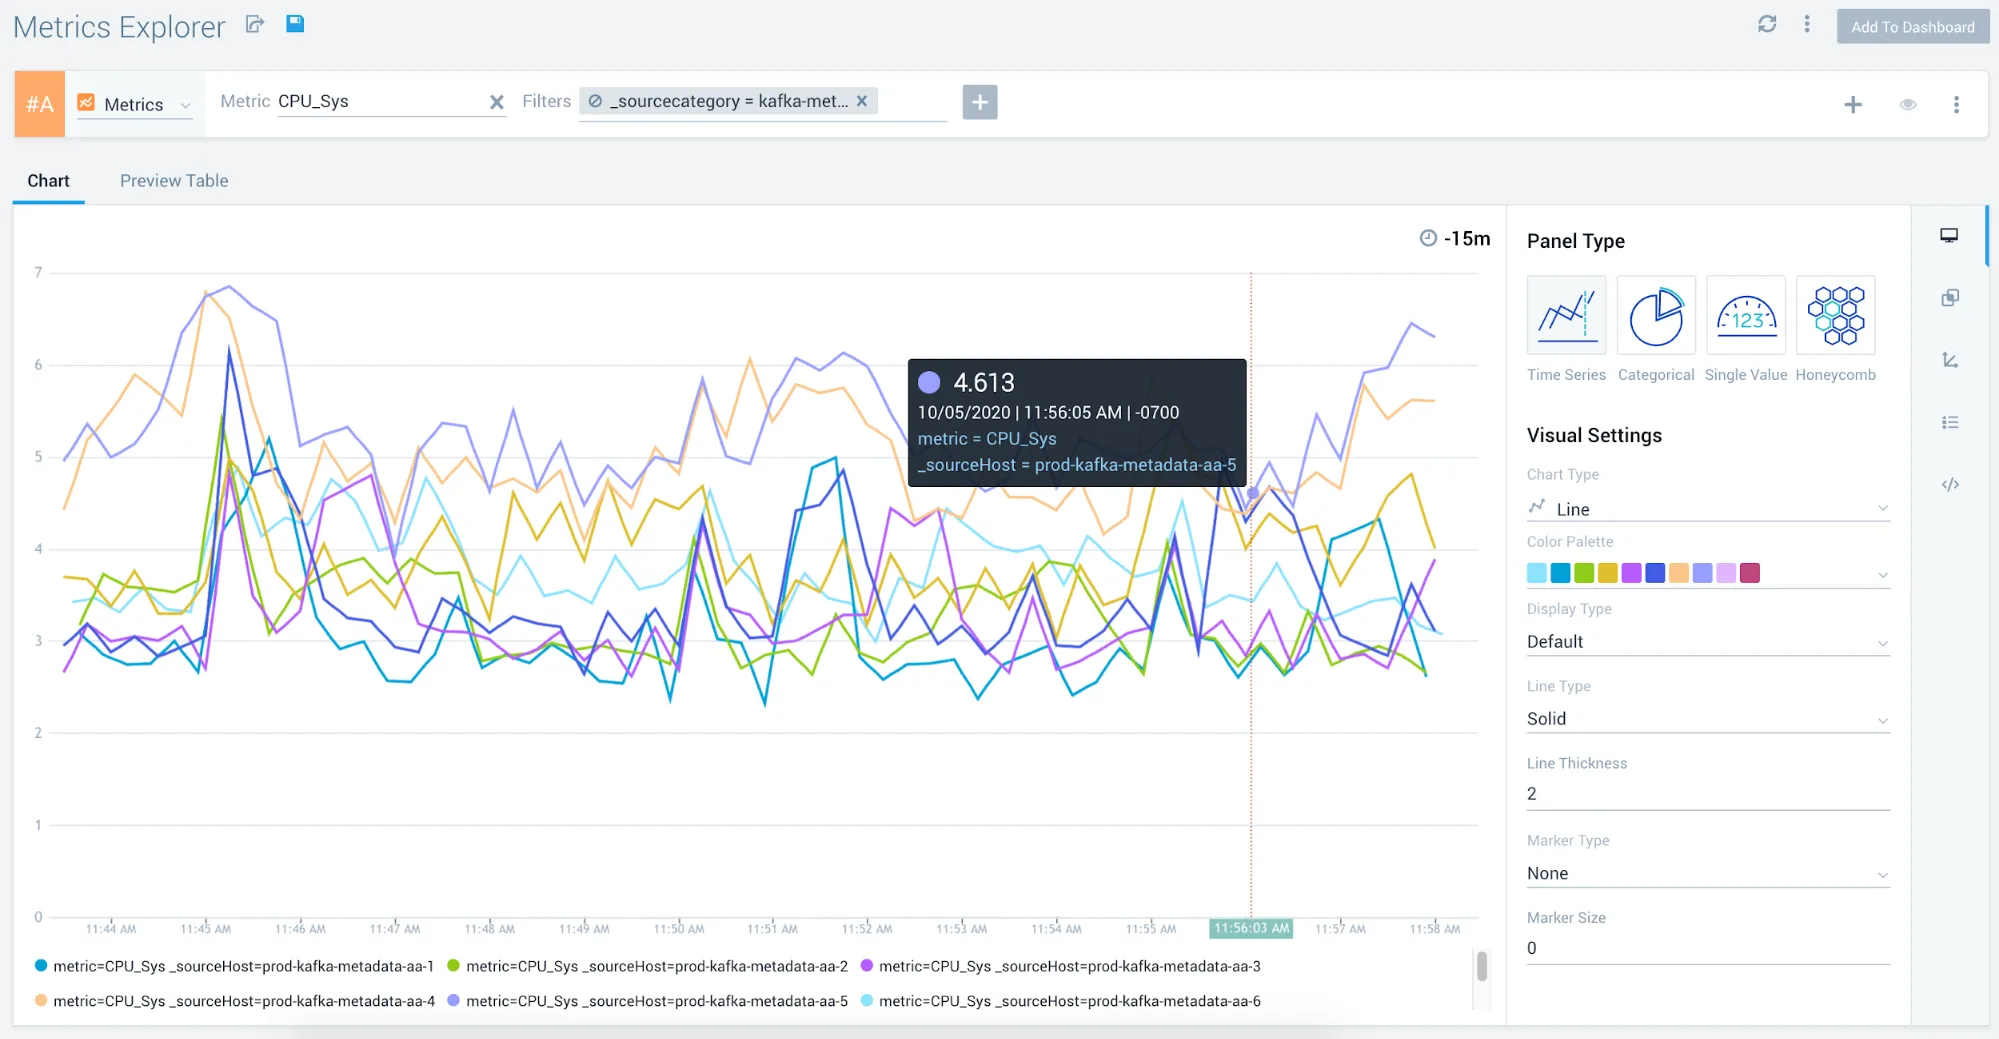
SigNoz (Open-Source)
SigNoz stands out as an excellent alternative to Dynatrace, being a comprehensive open-source Application Performance Management (APM) solution. It provides application metrics, distributed tracing, and logging capabilities, all under a single dashboard. SigNoz is an open source APM that provides a SaaS-like experience depending on your needs. It is built to support OpenTelemetry natively. OpenTelemetry is quietly becoming the world standard for instrumenting cloud-native applications. It has a user-friendly interface and is easy to get started with.
Some of the key features of SigNoz include:
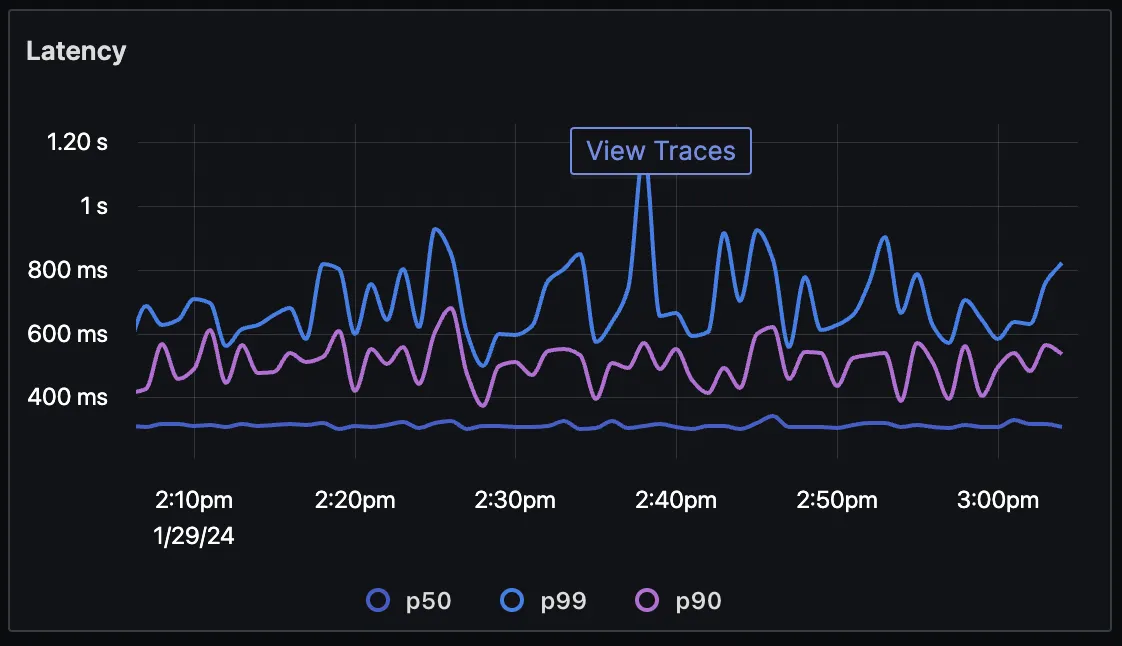
Out-of-box charts for application metrics like p99 latency, error rates, request per second, and top endpoints.

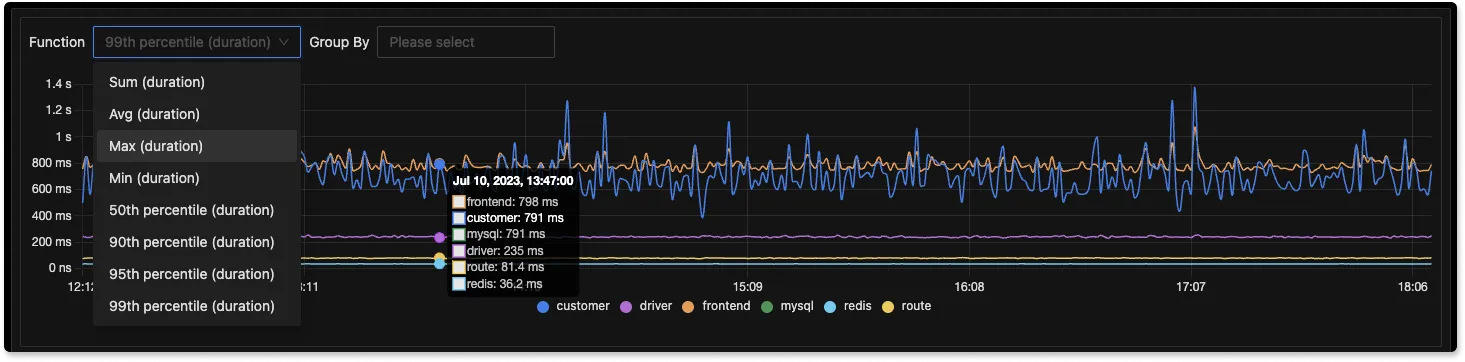
Distributed tracing capabilities: If you found something suspicious in the metric, you can seamlessly move to traces around that time to investigate further.
Traces aggregation: You can do aggregates on traces to get deeper insights from your application and infrastructure.
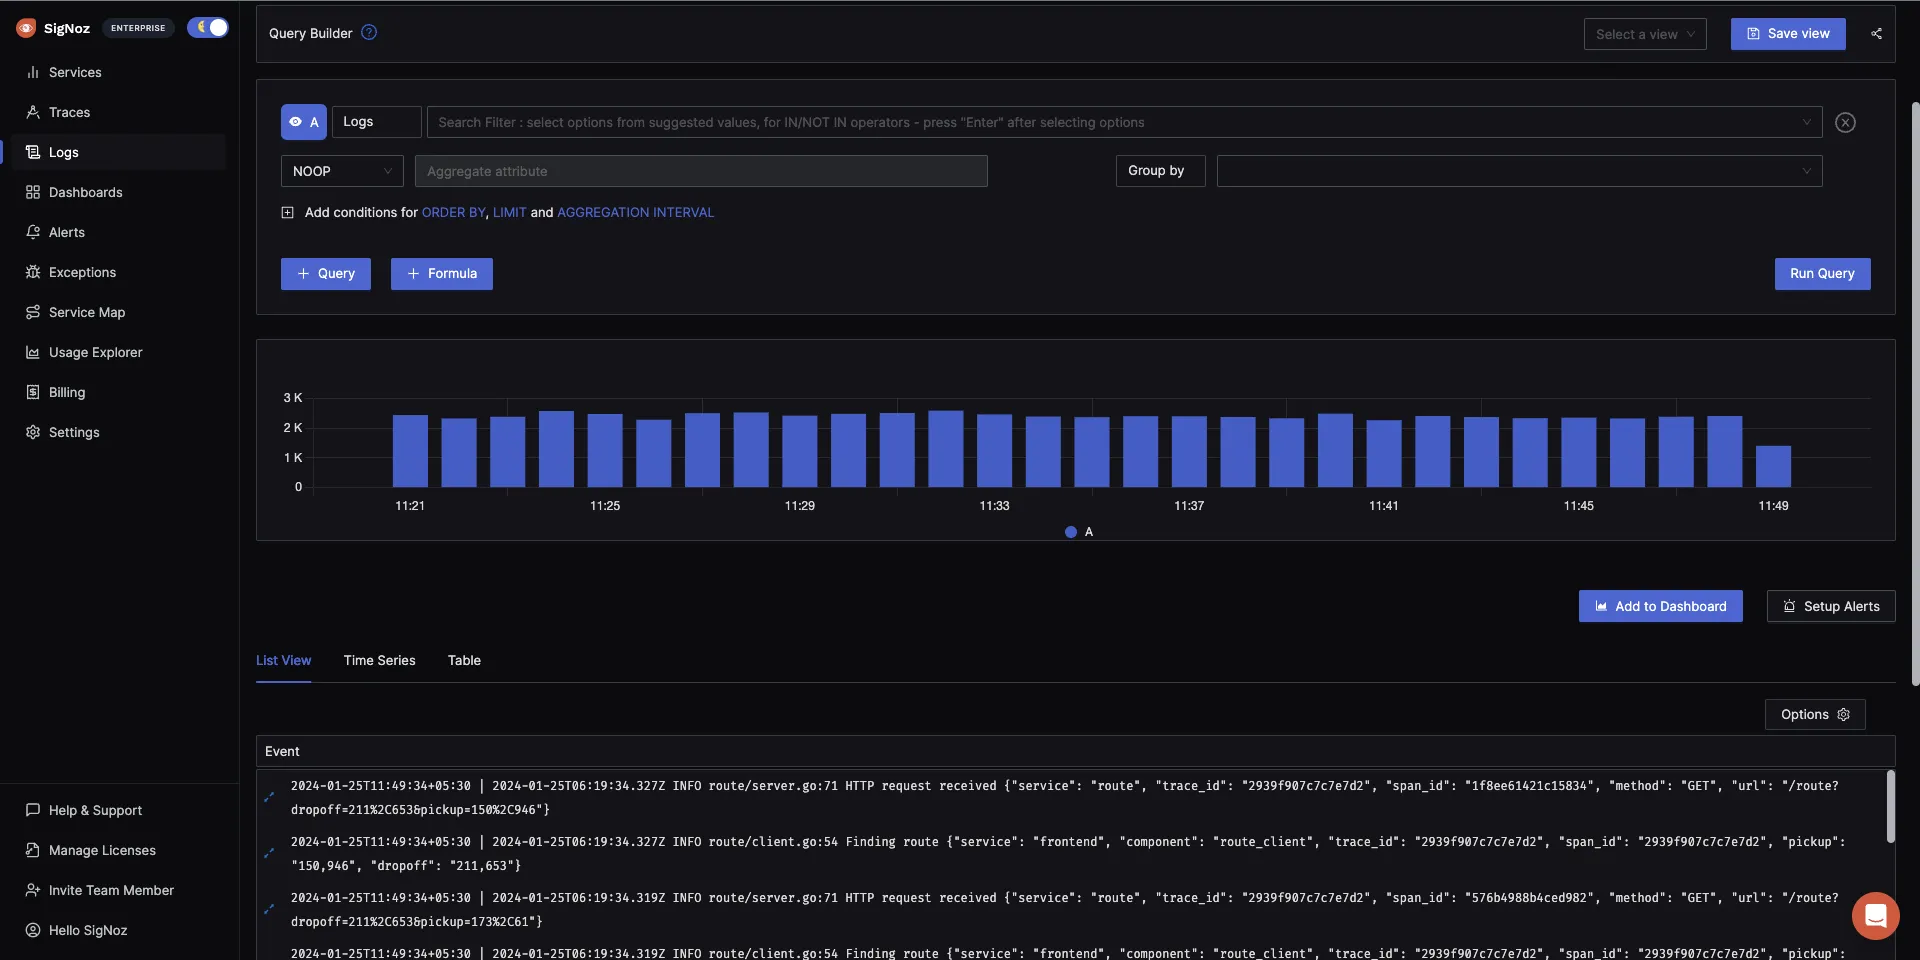
Log management: SigNoz also provides logs that can be intelligently correlated with traces for quick application debugging.
The pricing of SigNoz is usage-based. The cloud plan starts at $49 per month, which includes data usage. After that, logs and traces are charged at $0.3 per GB ingested and metrics at $0.1 per mn samples.
You can find more details on pricing here.
Datadog
Datadog is a cloud-based monitoring service provided as Software as a Service (SaaS). It stands out as a robust alternative to Dynatrace due to its comprehensive monitoring capabilities. With Datadog, users can oversee their entire tech stack through a unified interface. Datadog supports the integration of data from a wide array of sources and offers proactive monitoring enhanced by machine learning algorithms.
Some of the features include:
- Security Monitoring
- Synthetic Monitoring
- Customizable Dashboards
- Real-User Monitoring
- Network Monitoring
- Log Management
- Application Performance Monitoring (APM)
The pricing model for Datadog is decentralized, with distinct rates for each product. For example, products such as infrastructure monitoring, application performance monitoring (APM), and database monitoring are billed on a per-host/per-month basis. On the other hand, log management pricing is calculated based on the volume of ingested or scanned gigabytes per month and per million log events per month.
AppDynamics
AppDynamics is an application and business observability platform that provides code-level visibility into applications across distributed environments. It delivers application and business performance at scale, from code to customer experience.
Key features of AppDynamics include:
- Application Performance Monitoring
- Network Monitoring
- Application Security Monitoring
- Business Transaction Monitoring
- Anomaly Detection
- Custom Dashboarding
- Full-stack Analytics
AppDynamics' pricing is organized into different packages: Infrastructure Monitoring Edition, Premium Edition, Enterprise Edition, Enterprise Edition for SAP, Real User Monitoring, and Cisco Secure Application. These packages are licensed based on the number of CPU cores, and detailed pricing information can be found on their official pricing page.
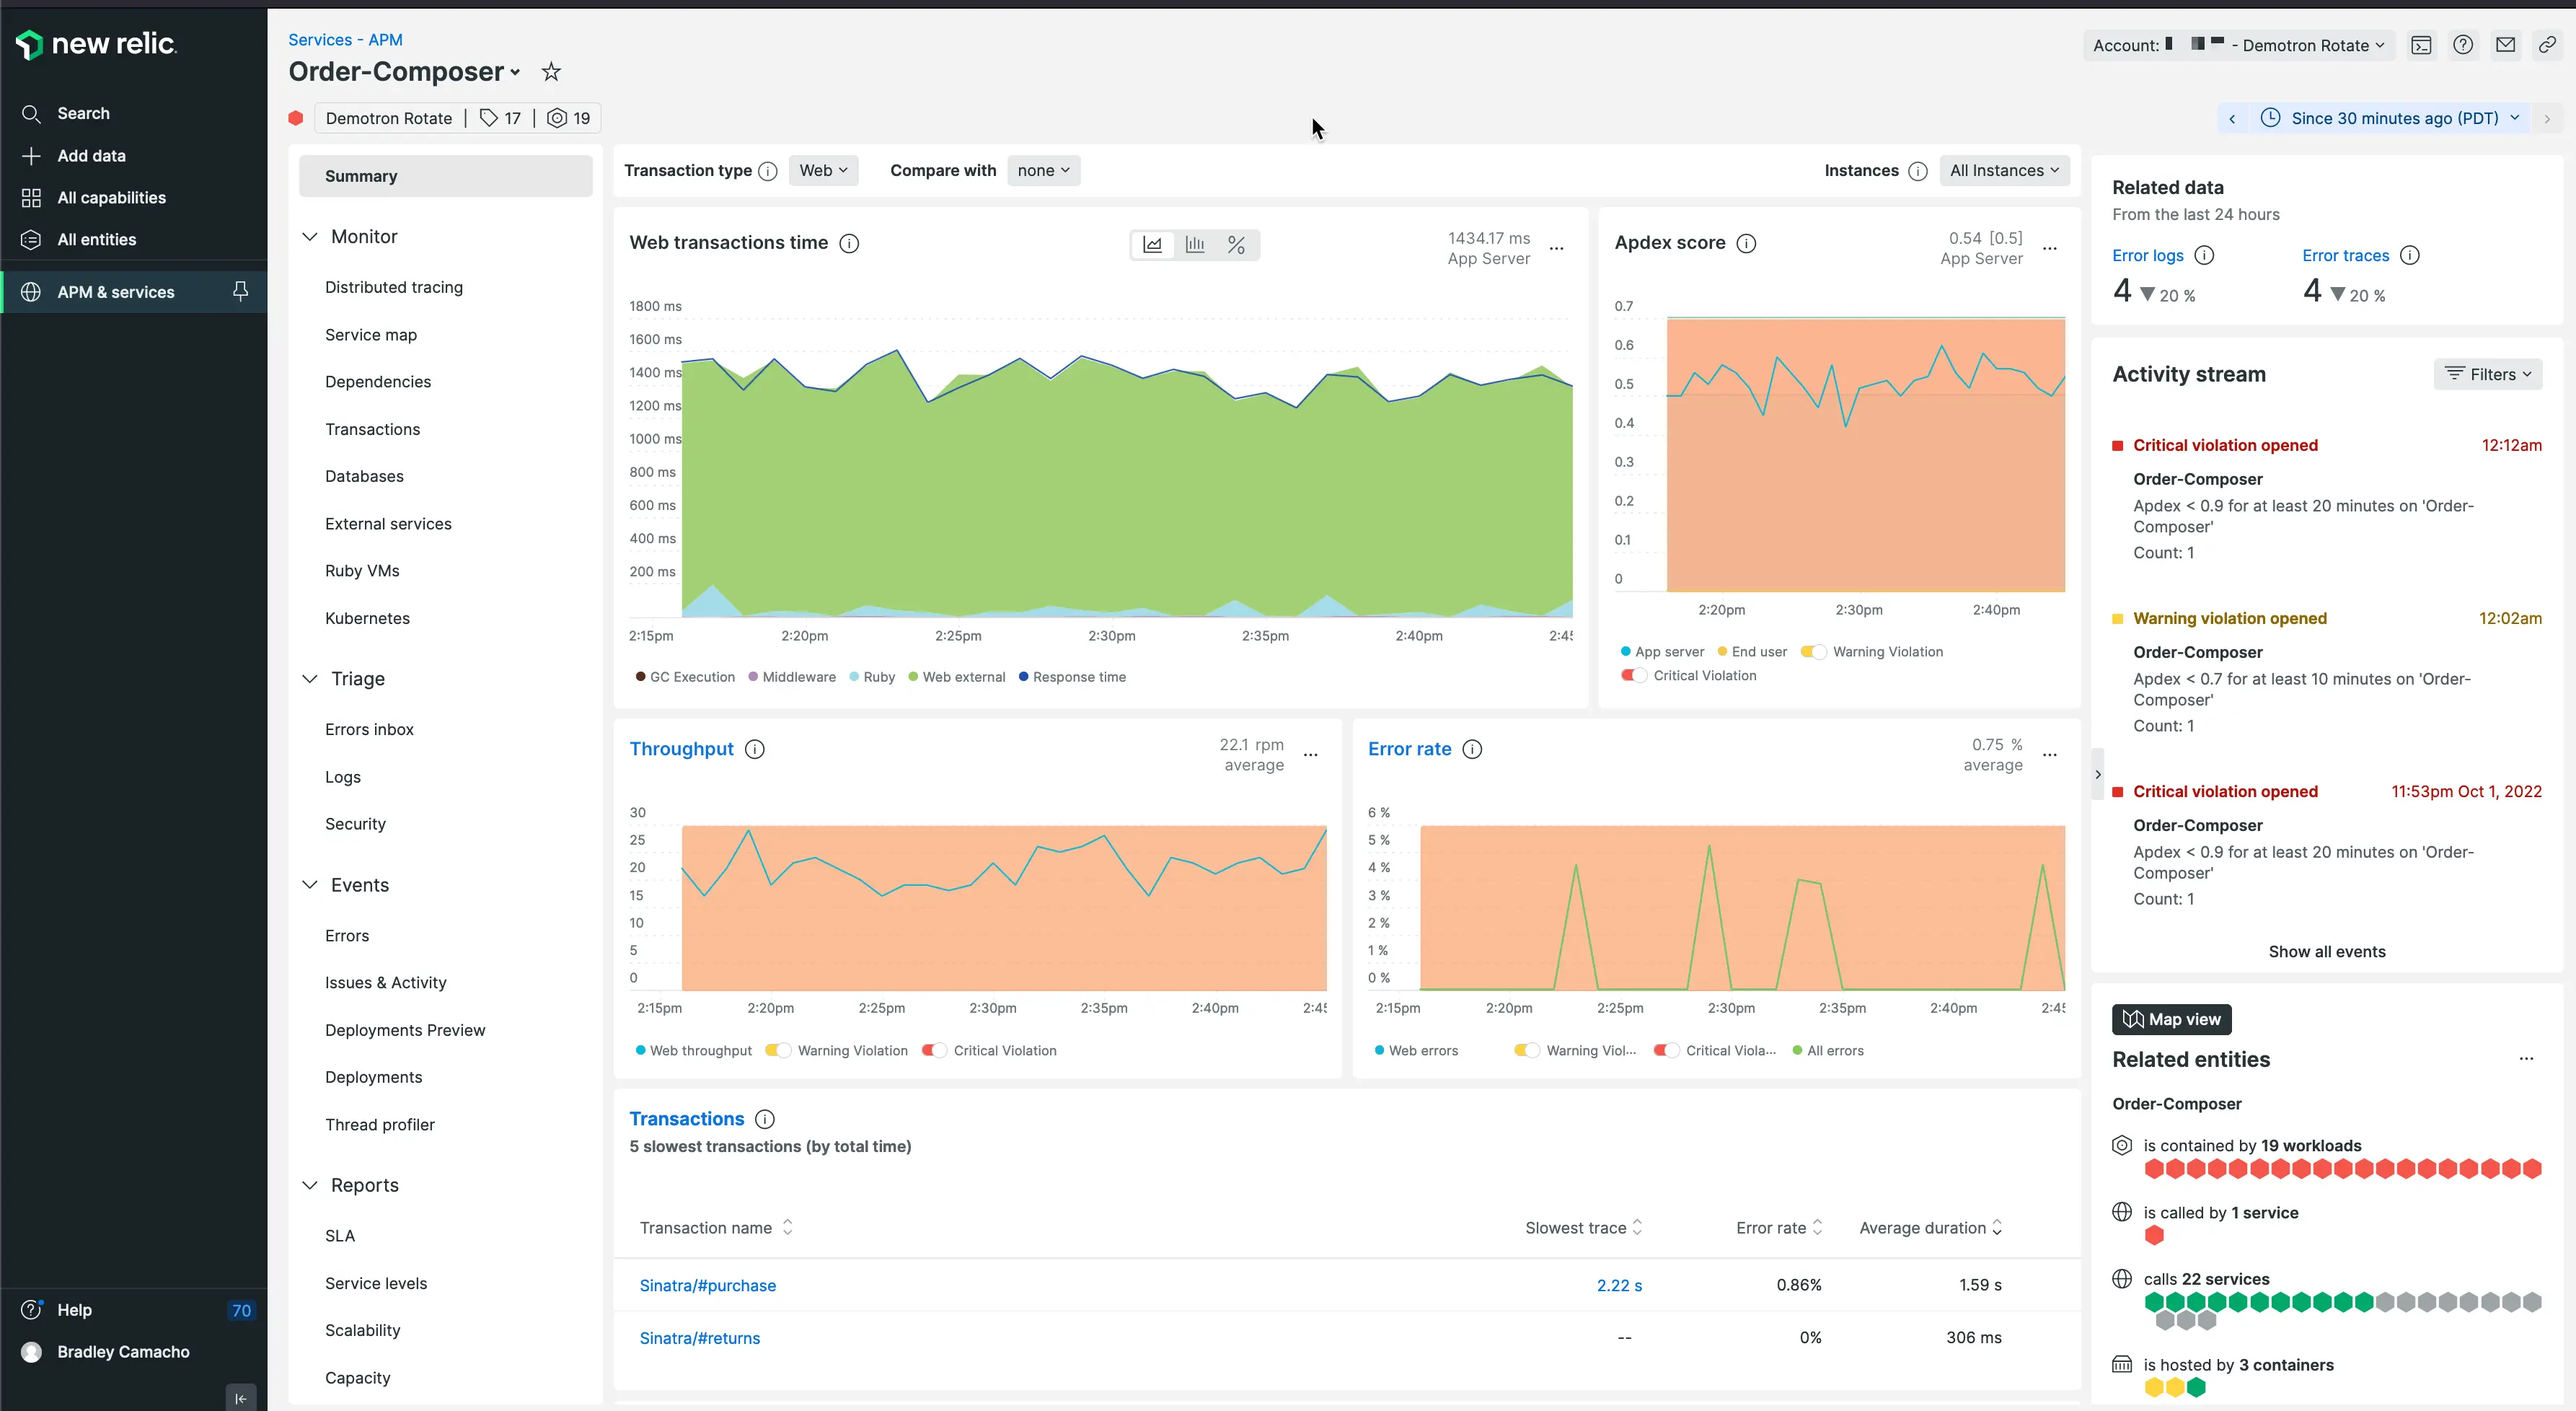
New Relic
New Relic is a SaaS observability platform that provides complete visibility across your application stack. It is a good alternative to Dyntrace given that it has AI-powered insights like Dynatrace, has unlimited scalability, and provides 700+ quickstart integrations.
Key features of New Relic include:
- Full-stack Monitoring
- Infrastructure Monitoring
- Network Monitoring
- Real-User Monitoring
- Interactive Application Security Testing (IAST)
- AI Monitoring
- Log Management
- Business Observability
New Relic's pricing is user-centric, with costs determined by the volume of data ingested per month and the number of users. It has a tiered pricing structure that includes a free basic plan along with core and full platform options. Additionally, New Relic provides 100 GB of free data ingestion per month and an unlimited free option for basic users. More details on their pricing can be found on their official pricing page.
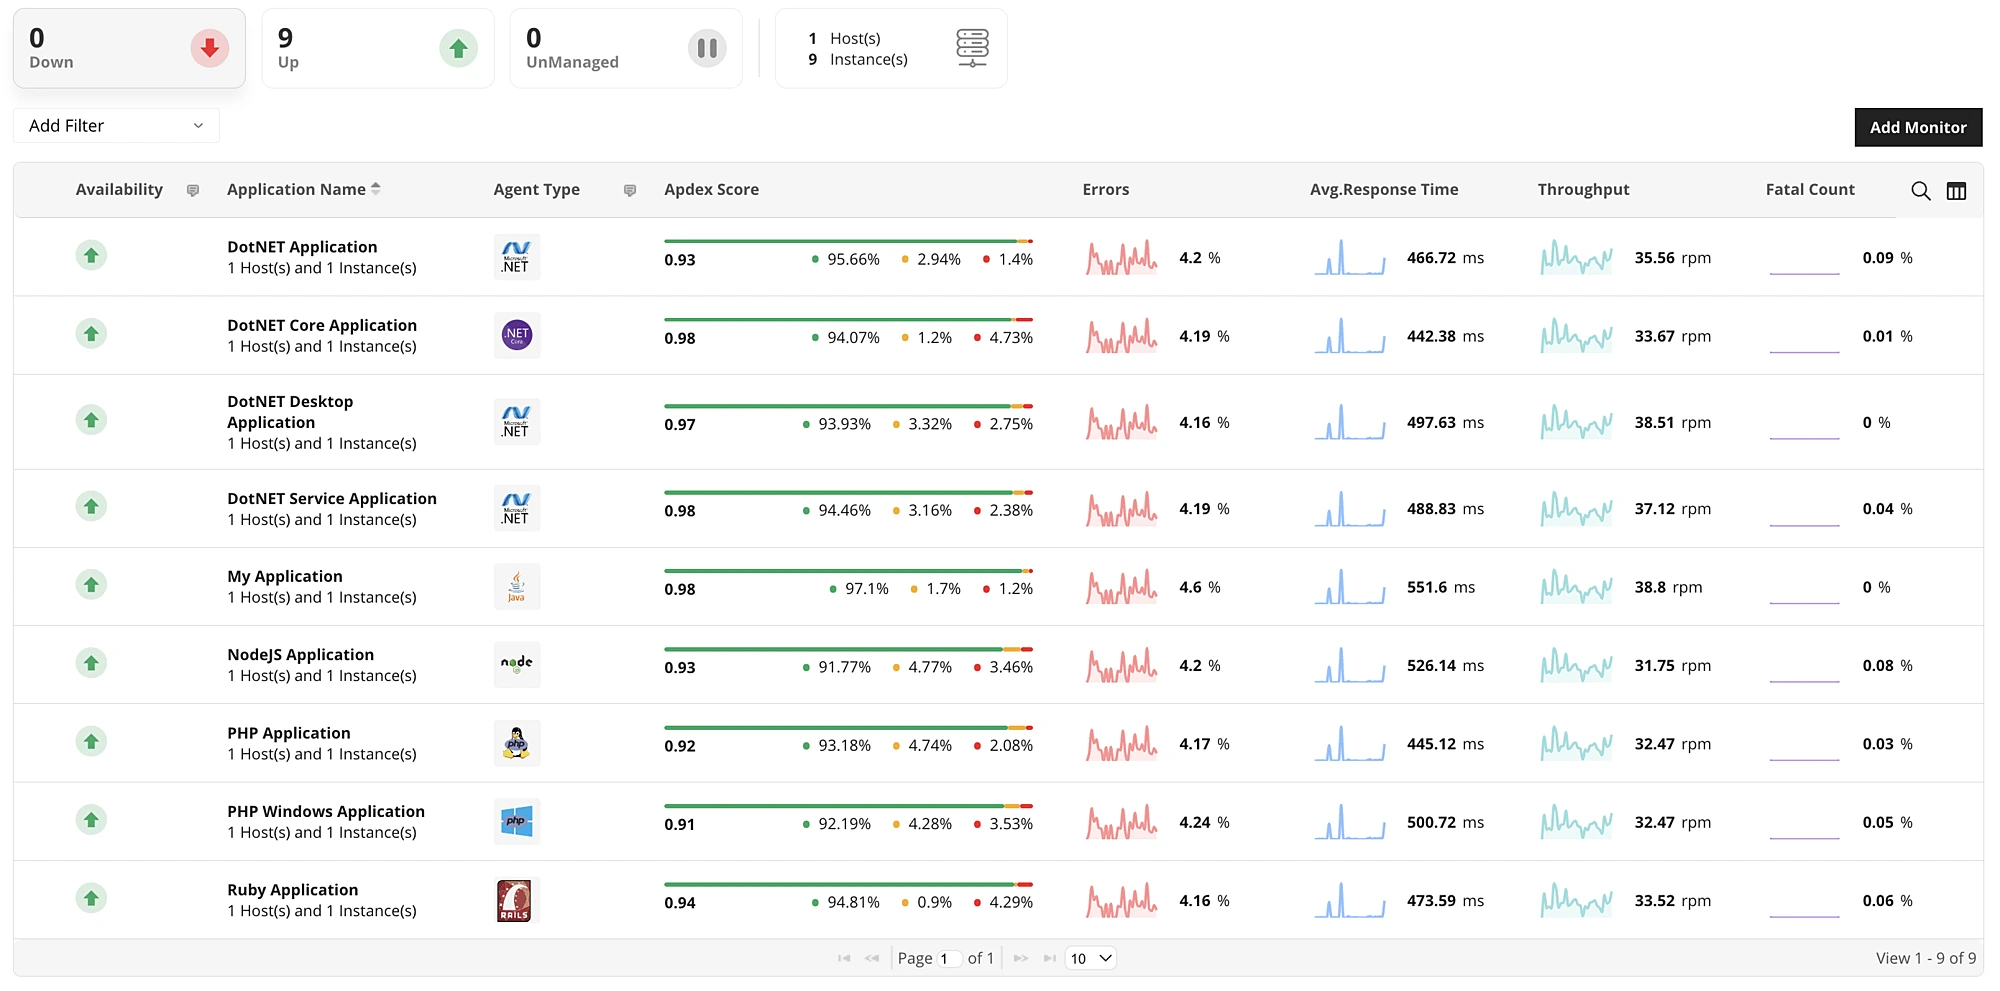
ManageEngine Application Monitor
ManageEngine Application Monitor is an application performance monitoring solution that provides deep visibility into the performance and user experience of complex distributed infrastructure from a single console. It serves as a good Dynatrace alternative, offering several key features:
- Application Performance Monitoring
- Real-time user monitoring
- Database monitoring
- Server Monitoring
- AI-assisted smart alerts
The pricing for ManageEngine Application Monitor is structured around the number of monitors (which could be a single application instance, server, service, or URL) per user. They offer a range of pricing options, including free, enterprise, and professional tiers, which can be reviewed on their official pricing page.
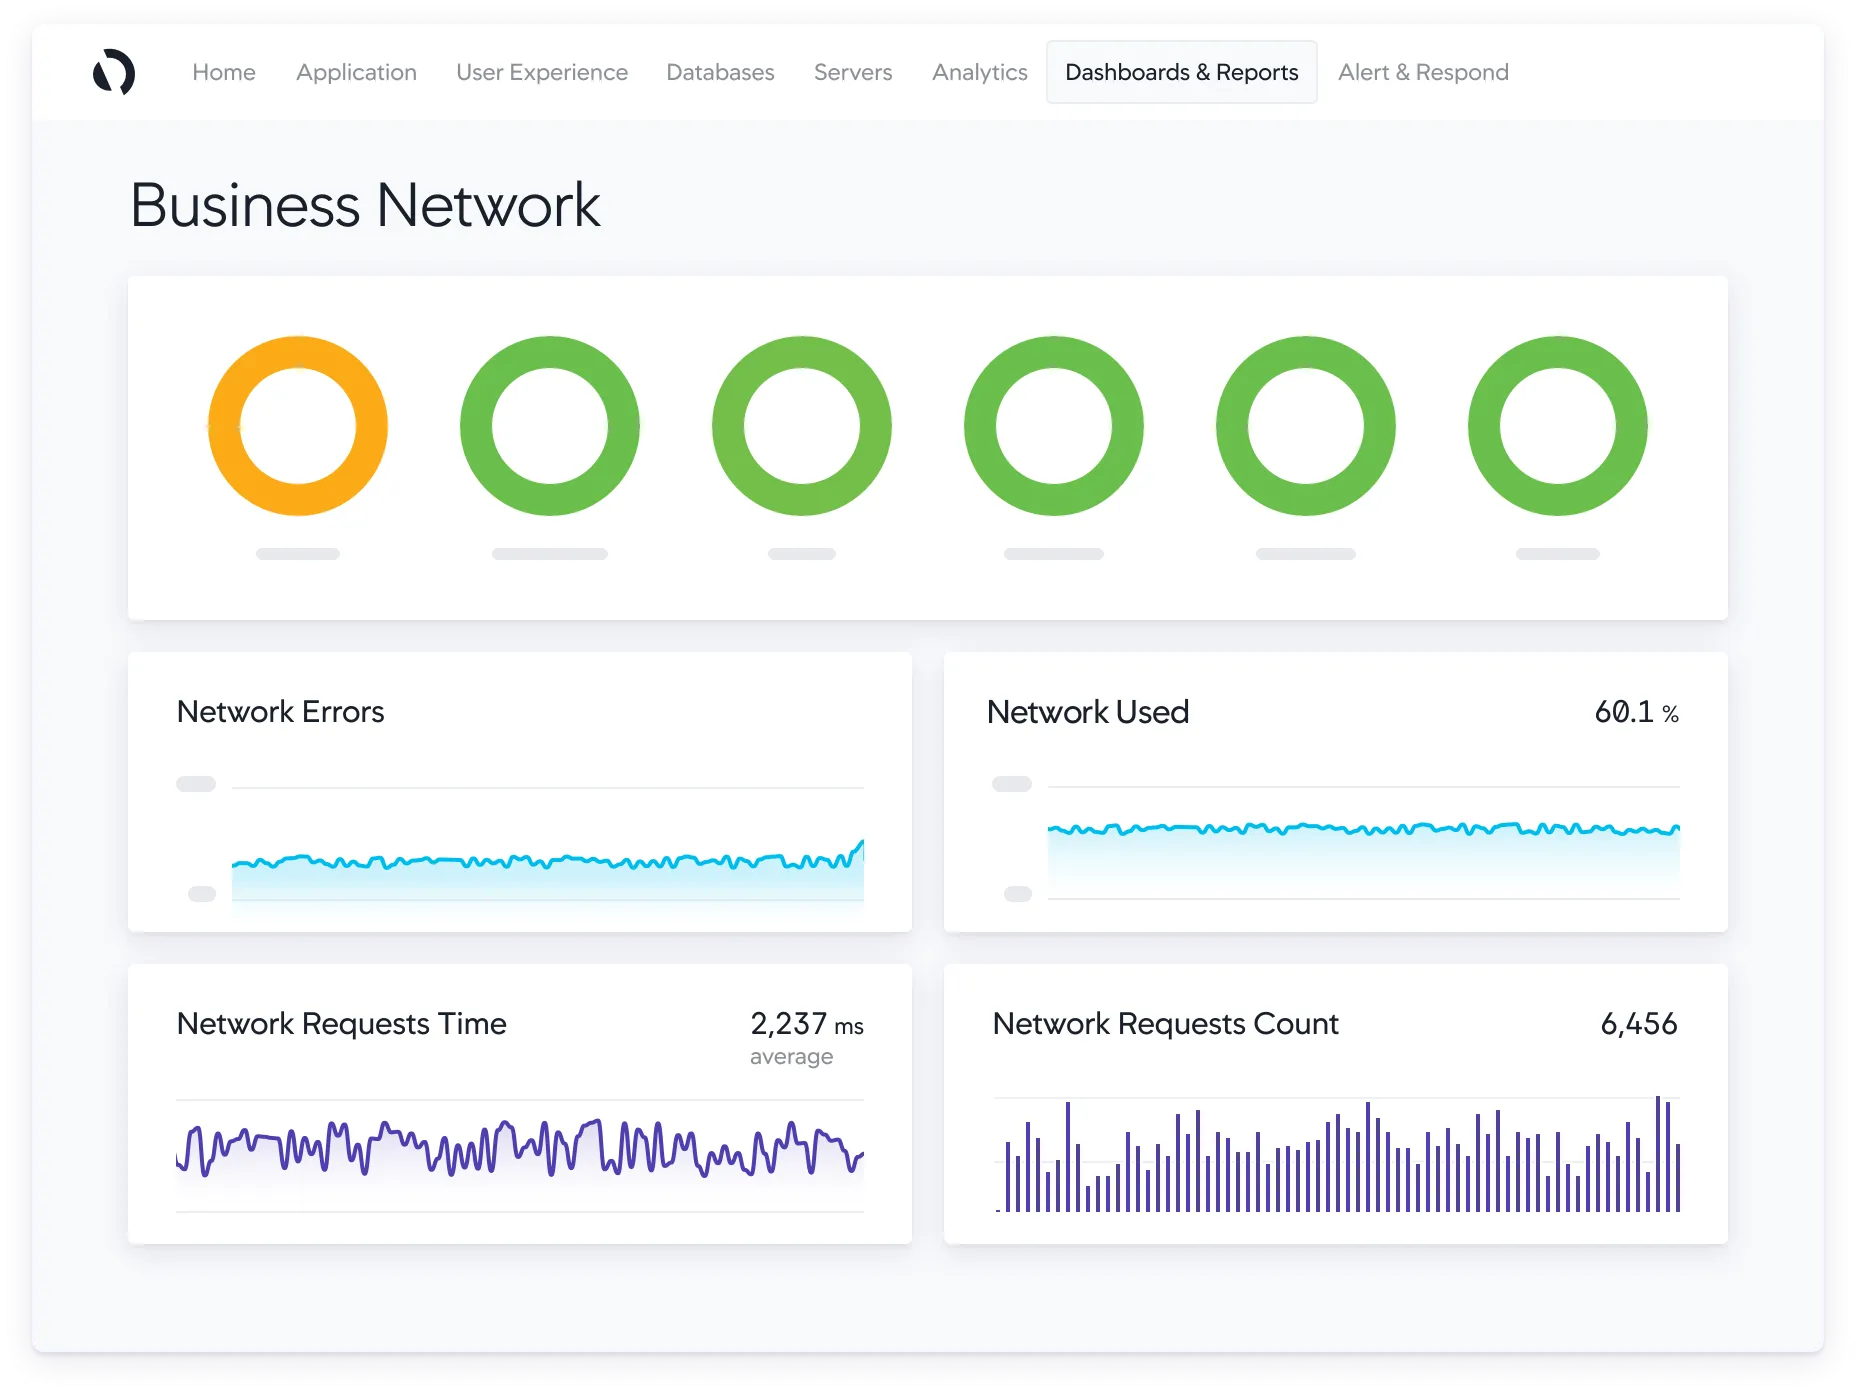
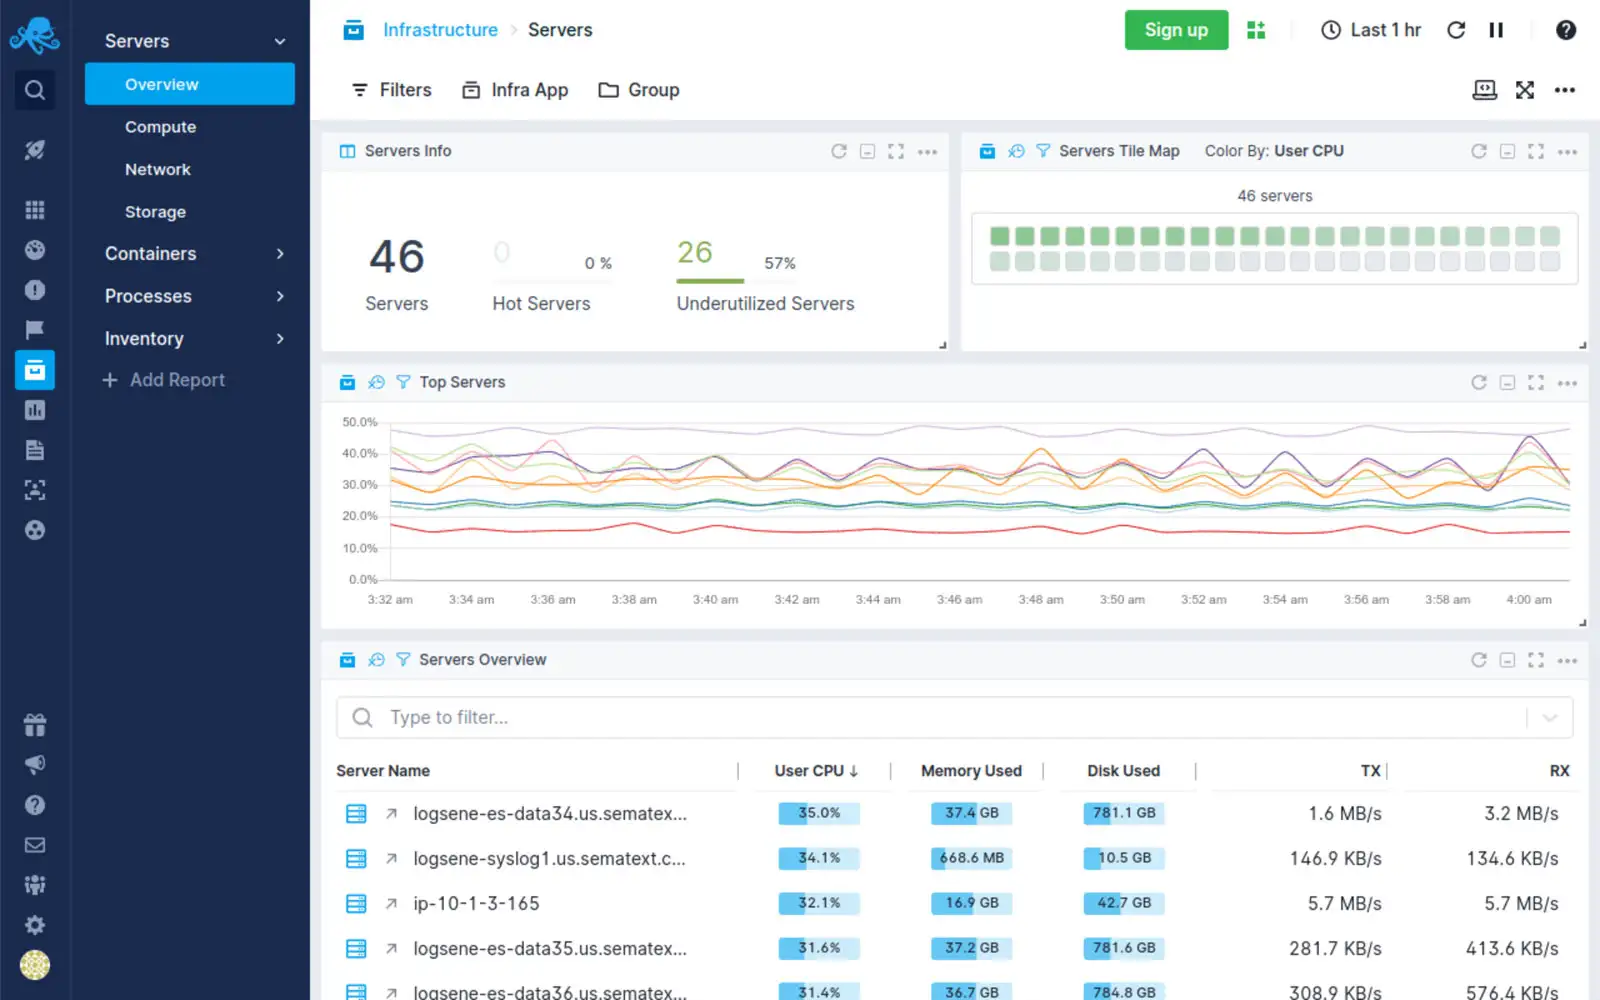
Sematex
Sematext offers two solutions: Sematext Cloud and Sematext Enterprise. Sematext Cloud is a fully managed Software as a Service (SaaS) platform that provides infrastructure monitoring, application performance monitoring, and log management. It offers full-stack visibility by consolidating logs, metrics, and traces in a single interface and ensuring end-to-end visibility from server performance to the availability of SaaS applications. Sematext Enterprise is the self-managed counterpart to Sematext Cloud, allowing businesses to maintain control over their monitoring environment.
Key features of Sematext include:
- Real-User Monitoring
- Infrastructure Monitoring
- Synthetic Monitoring
- Tracing
- Database Monitoring
- Application Performance Monitoring
Sematex’s pricing model is decentralized, with standard rates varying by service. For instance, infrastructure monitoring starts at $3.6 per month per host, service monitoring starts at $10.08 per month per agent, and log monitoring starts at $50 per month. Additional costs apply for log data received ($0.1/GB) and log data storage ($1.57 per GB).
Sematext also offers a range of pricing structures, including basic, pro, pay-as-you-go, and startup options. Detailed pricing information can be found on their official website.
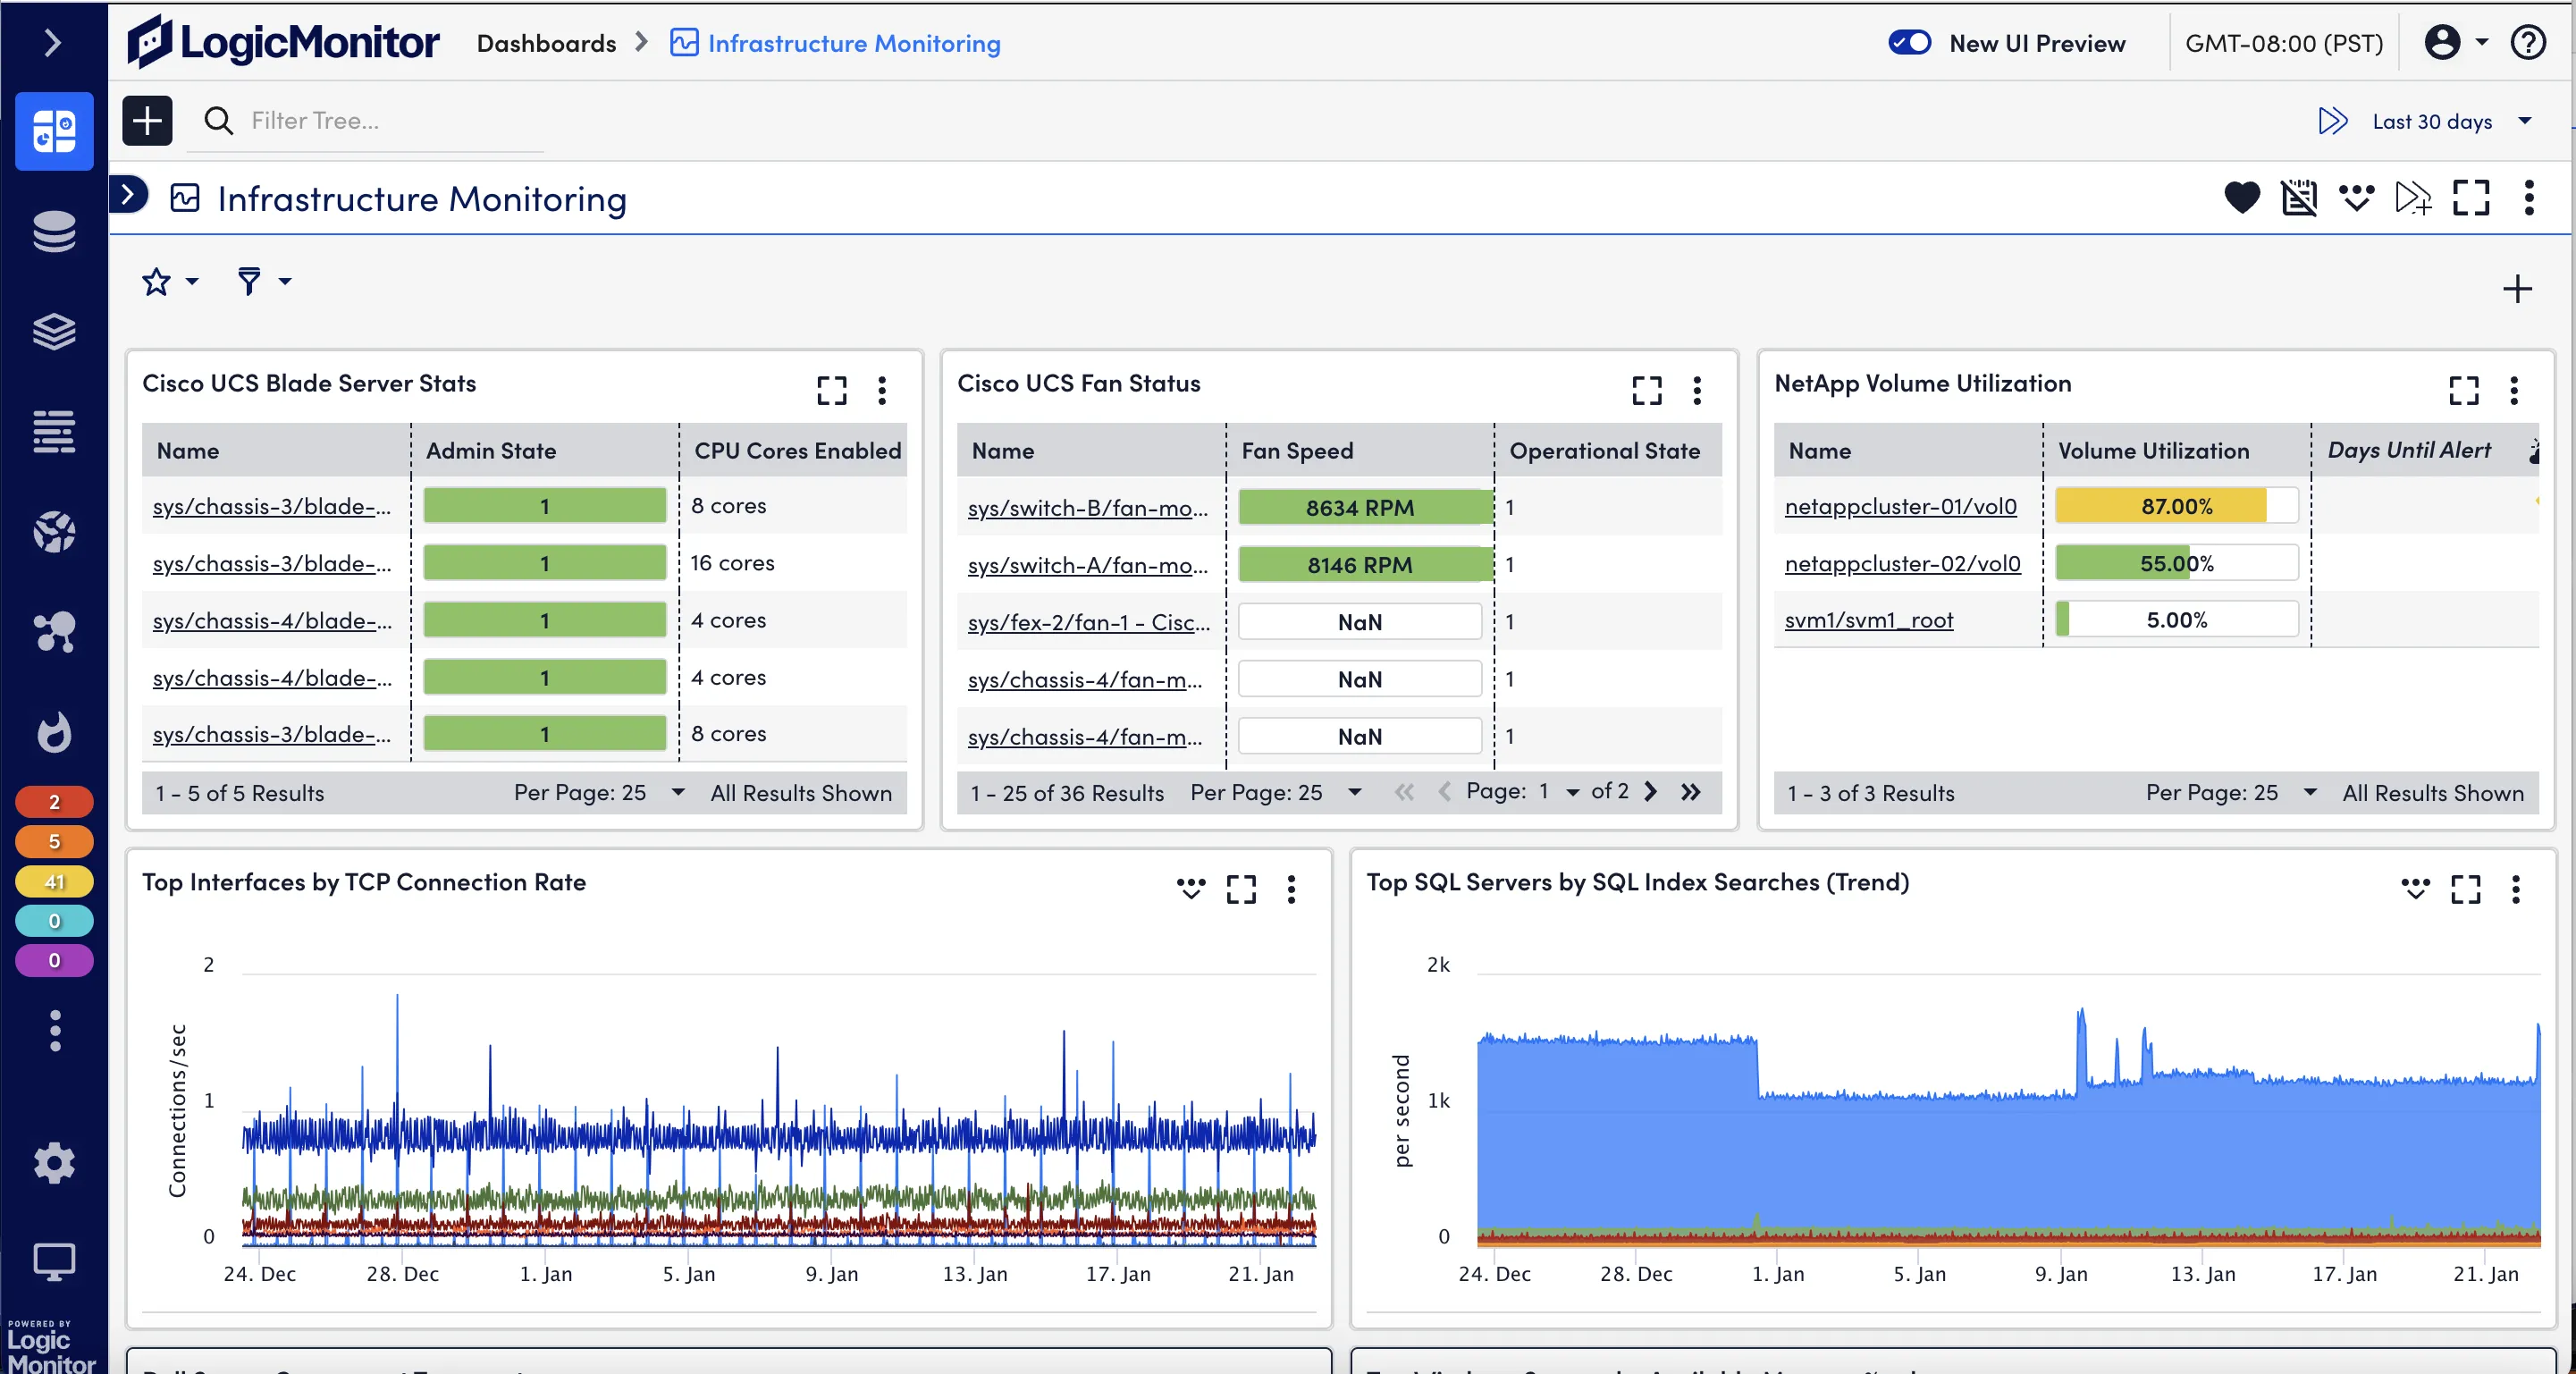
LogicMonitor
LogicMonitor is a cloud-based unified infrastructure monitoring platform that serves as a good Dynatrace alternative, particularly for those seeking robust infrastructure monitoring capabilities. It supports a vast array of over 2000 integrations, provides real-time alerts, and incorporates AIOps features such as root cause analysis, anomaly detection, and predictive forecasting.
Key features of LogicMonitor include:
- Infrastructure Monitoring
- Network Monitoring
- Server Monitoring
- Database Monitoring
- Application Performance Monitoring
- Cloud Monitoring (AWS, Google and Azure)
The LogicMonitor pricing model is also decentralized, with rates varying based on the product. While they offer a free trial, for the paid version, potential customers must contact the LogicMonitor sales team to obtain a customized quote tailored to their unique infrastructure requirements. More details regarding their pricing can be found on their official pricing page.
Sumo Logic
Sumo Logic is a cloud-based data analytics platform specializing in security, operations, and business intelligence use cases. It is designed to provide real-time insights into the performance, security, and operational facets of an organization's IT landscape.
Notable features of Sumo Logic include:
- Infrastructure Monitoring
- Out-of-the-box monitoring with prebuilt dashboards
- Log and Analytics
- Application Observability
- Kubernetes Monitoring
Sumo Logic's pricing structure is segmented by product or service type and the geographical location of your services. They offer a free trial, and for their paid services, the general starting cost is $3.00 per GB in the North American US region for services such as logs and compliance audits. For other services, potential customers should contact the Sumo Logic sales team to discuss pricing. More information on their pricing can be found on their official pricing page.
Splunk
Splunk is a cloud-based platform that empowers organizations to discover, analyze, and visualize data from a multitude of sources across various timeframes.
Key features of Splunk include:
- Infrastructure Monitoring
- Application Performance Monitoring
- Log Management
- Security Information and Event Management (SIEM)
Splunk's pricing model is divided into four primary categories: workload, ingest, entity, and activity-based pricing. Workload pricing is based on the types of workloads running on Splunk; ingest pricing is tied to the volume of data ingested into Splunk; entity pricing is determined by the number of hosts utilizing Splunk observability products; and activity-based pricing is based on the specific activities monitored by Splunk observability products, such as metric time series (MTS), traces analyzed per minute, sessions, or uptime requests. Detailed pricing information can be found on their official pricing page.
How to Choose the Right Dynatrace Alternative
Selecting the ideal Dynatrace alternative requires careful consideration of your organization's specific needs:
-
Assess your requirements: Identify your primary pain points with Dynatrace and prioritize features that address these issues.
-
Evaluate scalability: Consider your growth projections and ensure the chosen solution can scale accordingly.
-
Check integrations: Verify compatibility with your existing tools and workflows to ensure seamless adoption.
-
Analyze costs: Look beyond initial pricing—consider the total cost of ownership, including training and maintenance.
-
Test before committing: Take advantage of free trials or proof-of-concept periods to ensure the solution meets your needs in practice.
The above Dynatrace alternatives can be a good option to meet your monitoring needs. If you're moving out of Dynatrace, a good option can be to move out of closed SaaS vendors and shift towards open source solution. Many application owners are now shifting to OpenTelemetry for their observability data. OpenTelemetry is an open-source collection of APIs, SDKs, and tools. It can be used to instrument, generate, collect, and export telemetry data (metrics, logs, and traces) to help you analyze your software’s performance and behavior.
Using OpenTelemetry to generate telemetry data fress you from vendor lock-in as it gives you an option to export the data to a backend of your choice. For an OpenTelemetry backend, SigNoz can be a great choice. It is built to support OpenTelemetry data natively.
Getting started with SigNoz
SigNoz Cloud is the easiest way to run SigNoz. Sign up for a free account and get 30 days of unlimited access to all features.

You can also install and self-host SigNoz yourself since it is open-source. With 24,000+ GitHub stars, open-source SigNoz is loved by developers. Find the instructions to self-host SigNoz.
Key Takeaways
- Dynatrace alternatives offer diverse features and pricing models to suit various needs.
- Open-source options like SigNoz provide cost-effective solutions without compromising on functionality.
- Consider factors like scalability, integration capabilities, and specific monitoring requirements when choosing an alternative.
- Evaluate the total cost of ownership and long-term value, not just initial pricing.
- Take advantage of trial periods to ensure the chosen solution meets your practical needs.
FAQs
What are the main reasons to consider Dynatrace alternatives?
Common reasons include:
- Reducing costs
- Simplifying the monitoring stack
- Seeking more specialized features
- Exploring open-source options for greater control and customization
How do open-source APM tools compare to commercial solutions?
Open-source tools like SigNoz offer:
- Cost-effectiveness
- Full control over data and customization
- Community-driven development and support
- Transparency in code and security
However, they may require more technical expertise to set up and maintain compared to some commercial solutions.
What factors should be prioritized when choosing a Dynatrace alternative?
Key factors to consider include:
- Specific monitoring needs (infrastructure, applications, user experience)
- Scalability and performance for your environment
- Integration with your existing tech stack
- Total cost of ownership
- Ease of use and learning curve
- Support and documentation quality
Prioritize these factors based on your organization's unique requirements and constraints.
What are the top alternatives to Dynatrace?
The top alternatives to Dynatrace include SigNoz (open-source), Datadog, AppDynamics, New Relic, ManageEngine Applications Monitor, Sematex, LogicMonitor, Sumo Logic, and Splunk. Each of these tools offers unique features and pricing models to suit different organizational needs.
Why might someone look for Dynatrace alternatives?
People might look for Dynatrace alternatives due to its complexity, which can make it less accessible for quick data utilization. Additionally, Dynatrace's pricing model can be expensive for large enterprises with extensive monitoring needs, and the costs may not always align perfectly with usage patterns.
What is SigNoz and how does it compare to Dynatrace?
SigNoz is an open-source Application Performance Management (APM) solution that provides application metrics, distributed tracing, and logging capabilities under a single dashboard. It offers a user-friendly interface, is built to support OpenTelemetry natively, and provides a SaaS-like experience. SigNoz can be a cost-effective alternative to Dynatrace, especially for organizations looking for an open-source solution.
How does the pricing of Dynatrace alternatives compare?
Pricing models vary among Dynatrace alternatives. Some, like SigNoz, offer usage-based pricing starting at $49 per month. Others, like Datadog and New Relic, have decentralized pricing models based on specific products or data ingestion. Many alternatives offer tiered pricing structures, including free plans for basic usage. It's important to evaluate each tool's pricing structure based on your specific monitoring needs and scale.
What are the key features to look for in a Dynatrace alternative?
When considering Dynatrace alternatives, look for features such as:
- Application Performance Monitoring (APM)
- Infrastructure Monitoring
- Distributed Tracing
- Log Management
- Real-User Monitoring
- Custom Dashboards
- Alerting and Anomaly Detection
- Integrations with your existing tech stack
- Scalability and pricing that aligns with your usage patterns
Is it possible to use open-source tools as Dynatrace alternatives?
Yes, open-source tools like SigNoz can serve as viable alternatives to Dynatrace. These tools often provide similar functionality at a lower cost and with more flexibility. However, it's important to consider factors such as community support, documentation, and the resources required for self-hosting when opting for open-source alternatives.
Further Reading
