Top 14 ELK alternatives [open source included] in 2026
ELK is the acronym Elasticsearch, Logstash, and Kibana, and combined together, it is one of the most popular log analytics tools. Elastic changed the license of Elasticsearch and Kibana from the fully open Apache 2 license to a proprietary dual license. The ELK stack is also hard to manage at scale. In this article, we will discuss 14 ELK alternatives that you can consider using.

The ELK stack started with Elasticsearch which is a search and analytics engine. Logstash is the data processing engine, and Kibana lets users visualize data in Elasticsearch with charts and graphs. The ELK stack can either be self-hosted, or users can opt for a cloud version provided by Elastic. The Elk stack is a very popular solution for log analytics. But scaling an ELK stack can be costly, and there are many alternatives available that you should explore.
What is log management?
Log management is the method of collecting, parsing, storing, analyzing, and utilizing log files and log messages from your applications, servers, and other infrastructure components to provide insights for troubleshooting, debugging performance issues, and identifying security threats.
Reasons to look for ELK alternatives
Though ELK is a popular log management tool, there are use-cases that it might not be best suited for. Some of the scenarios where people look out for ELK alternatives are:
Cost Concerns: While ELK offers a powerful stack, its cost can escalate quickly, especially at scale.
Complex Setup and Maintenance: The ELK stack can be complex to set up and maintain, particularly for small teams or projects with limited operational capabilities.
Performance Issues at Scale: Although ELK is designed to scale, some users may experience performance issues as their data volume grows.
- Limited Customization and Extensibility: Users who require more customization and extensibility than what ELK offers may look for alternatives that provide more flexibility in terms of data processing, visualization, and integration with other tools.
We have prepared a list of 14 ELK alternatives that you can consider in place of the ELK stack.
Top 14 ELK stack alternatives
Below are the top 14 ELK stack alternatives:
- SigNoz
- Logz.io
- Graylog
- Logtail
- Sumologic
- Grafana Loki
- Splunk
- Loggly
- Sematext
- DataDog
- New Relic
- Dynatrace
- Mezmo
- Papertrail
SigNoz (Open Source)
SigNoz is a full-stack open source APM that provides log collection and analytics. SigNoz uses a columnar database ClickHouse to store logs, which is very efficient at ingesting and storing logs data. Columnar databases like ClickHouse are very effective in storing log data and making it available for analysis.
Big companies like Uber have shifted from the Elastic stack to ClickHouse for their log analytics platform. Cloudflare too was using Elasticsearch for many years but shifted to ClickHouse because of limitations in handling large log volumes with Elasticsearch.
In a logs performance benchmark with SigNoz and ELK, there were two key findings:
- For ingestion SigNoz is 2.5x faster than ELK and uses 50% less resources.
- SigNoz is about 13 times faster than ELK for aggregation queries.
- Storage used by SigNoz for the same amount of logs is about half of what ELK uses.
SigNoz uses OpenTelemetry for instrumenting applications. OpenTelemetry, backed by CNCF, is quietly becoming the world standard for instrumenting cloud-native applications.
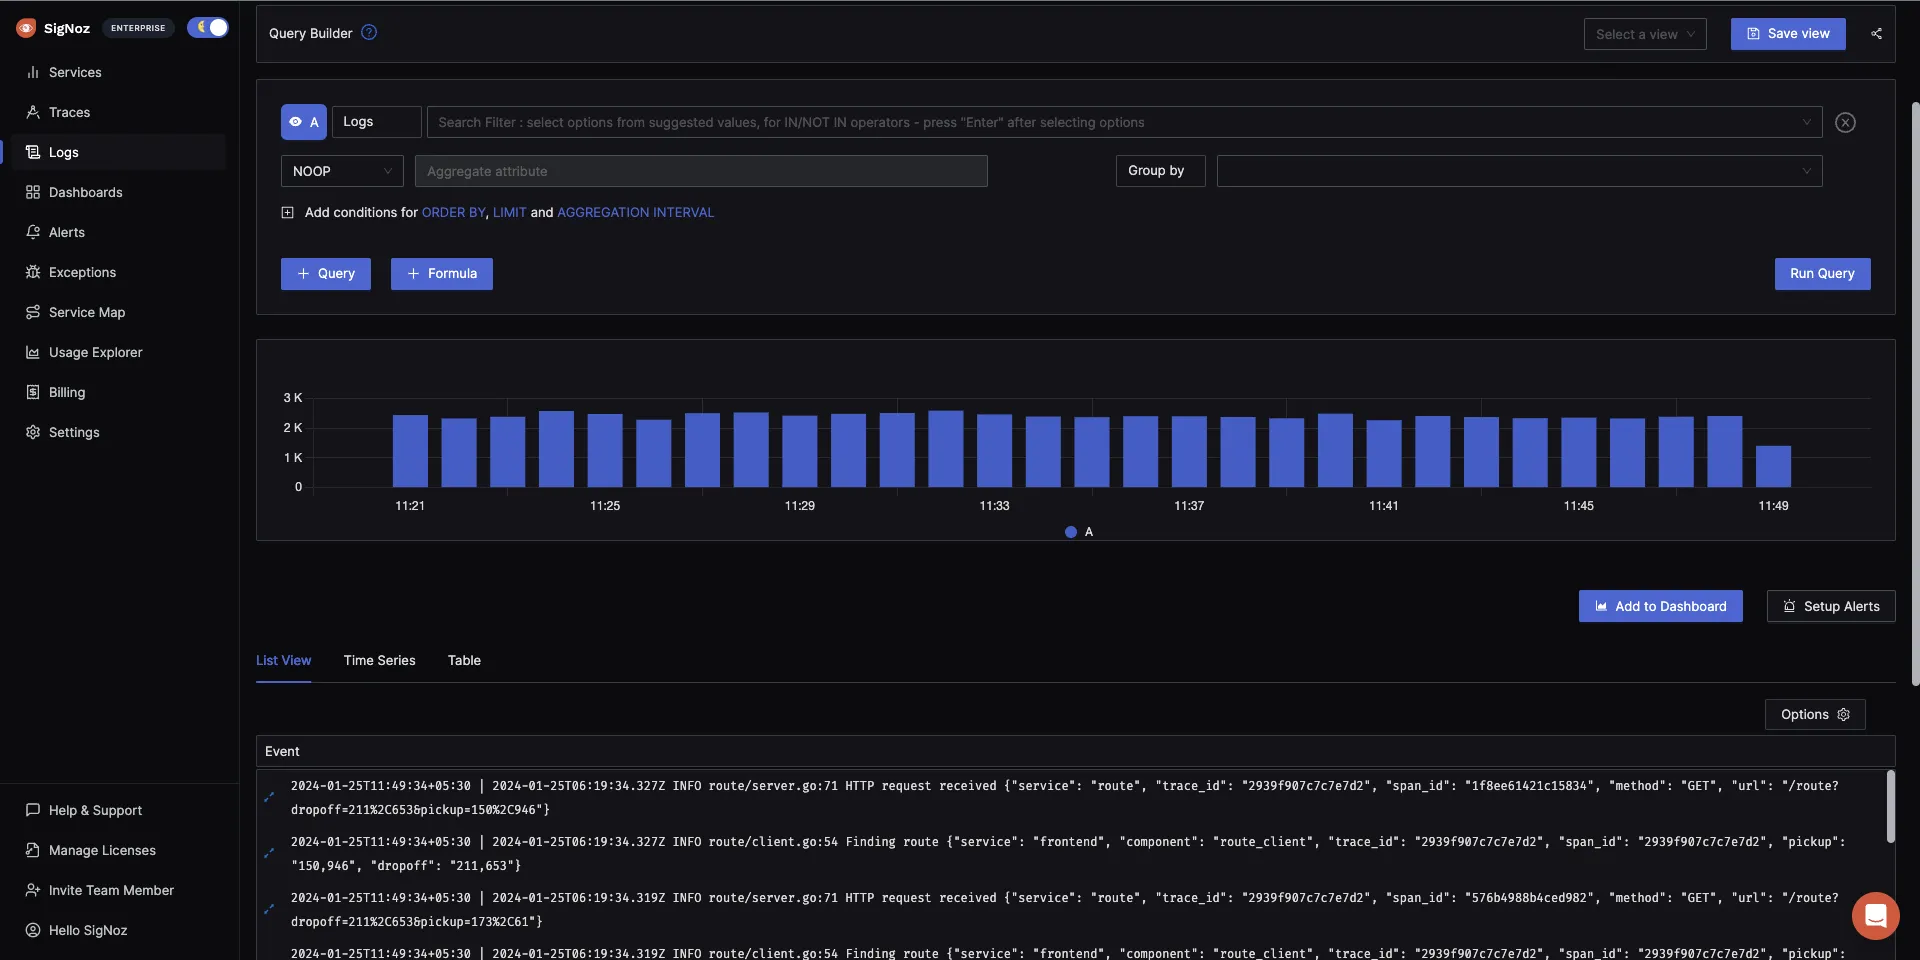
The logs tab in SigNoz has advanced features like a log query builder, search across multiple fields, structured table view, JSON view, etc.
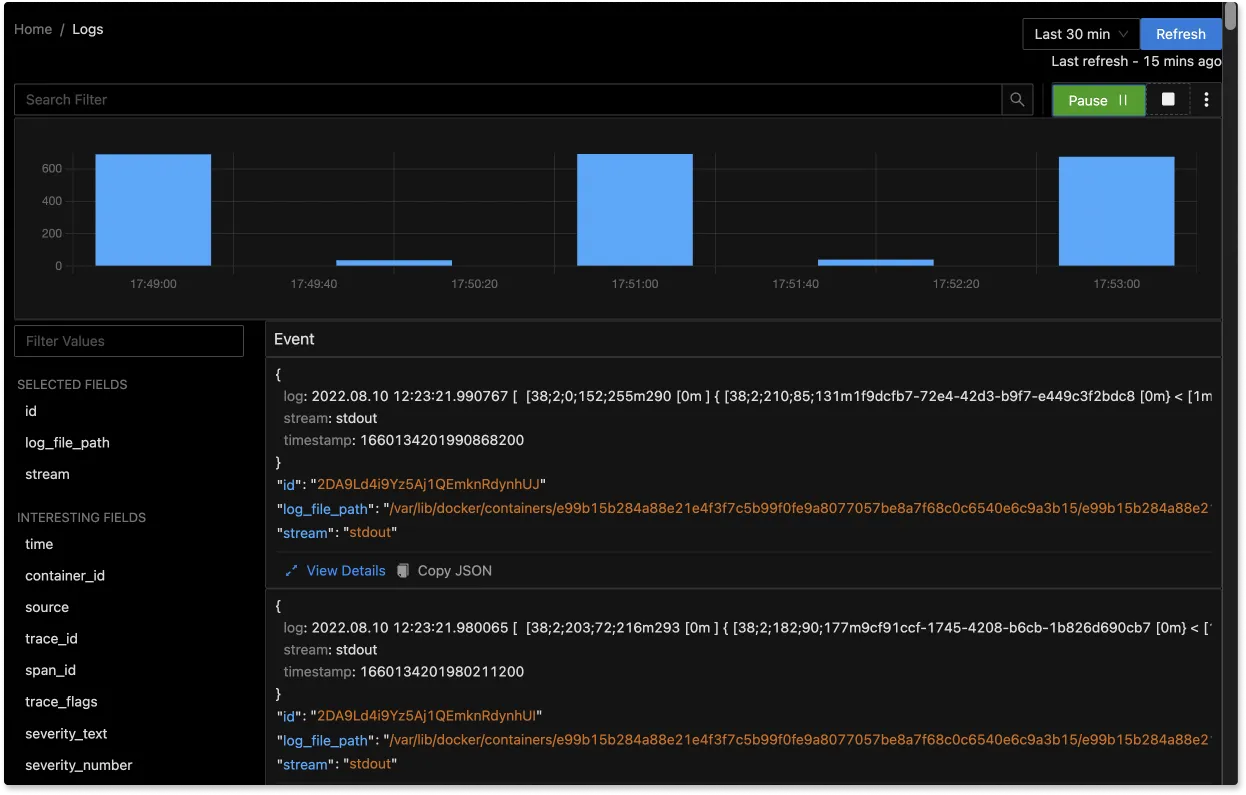
You can also view logs in real time with live tail logging.
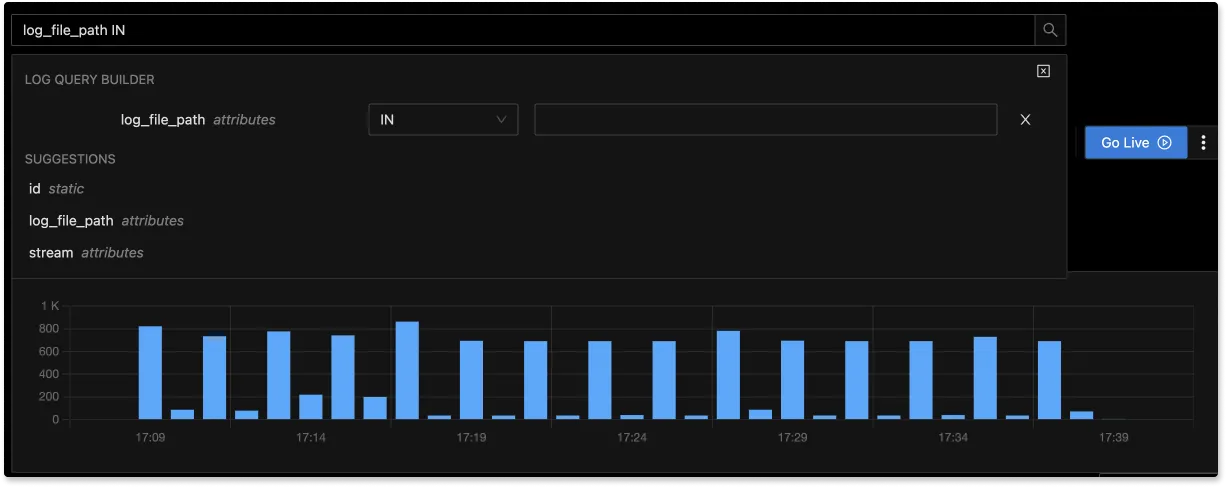
With advanced Log Query Builder, you can filter out logs quickly with a mix and match of fields.
It's very easy to get started with SigNoz. It can be installed on macOS or Linux computers in just three steps by using a simple install script.
The install script automatically installs Docker Engine on Linux. However, on macOS, you must manually install Docker Engine before running the install script.
git clone -b main https://github.com/SigNoz/signoz.git
cd signoz/deploy/
./install.sh
Logz.io
Logz.io provides cloud-hosted services based on the ELK stack. It is based on OpenSearch and OpenSearch dashboards, which are the open source version of Elasticsearch and Kibana respectively. You can monitor your logs with visualizations and dashboards while setting alerts to notify your team.
Logz.io provides different tiers for storing logs efficiently. Critical data is kept in the real-time tier, smart tier for active data, and historical tier with archiving.
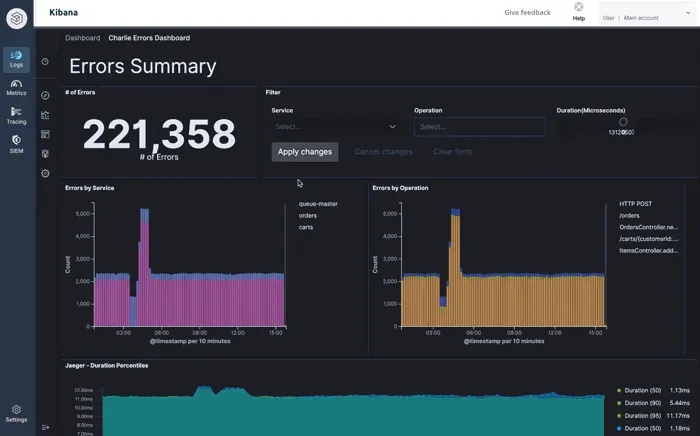
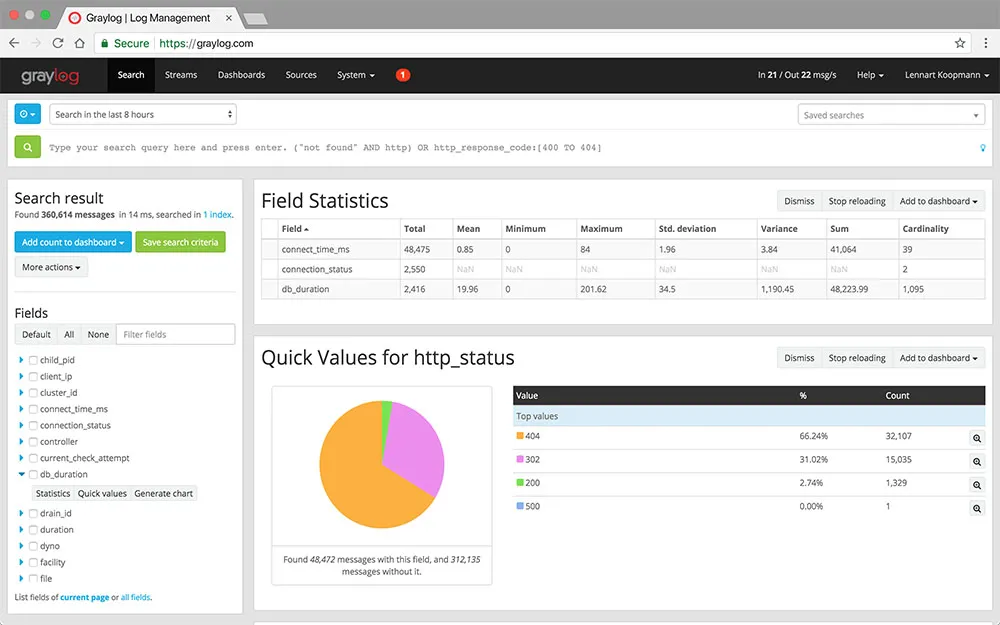
Graylog (Open Source)
Graylog is a centralized log management platform that provides two solutions - log management and Security Information Event Management (SIEM). Graylog also provides an open-source version called the Graylog Open. Graylog Open offers the core centralized log management functionality that you need to collect, store, and analyze logs data.
The open source version is free to download and use, while you need to contact sales for other solutions. You can find more details here.
Logtail
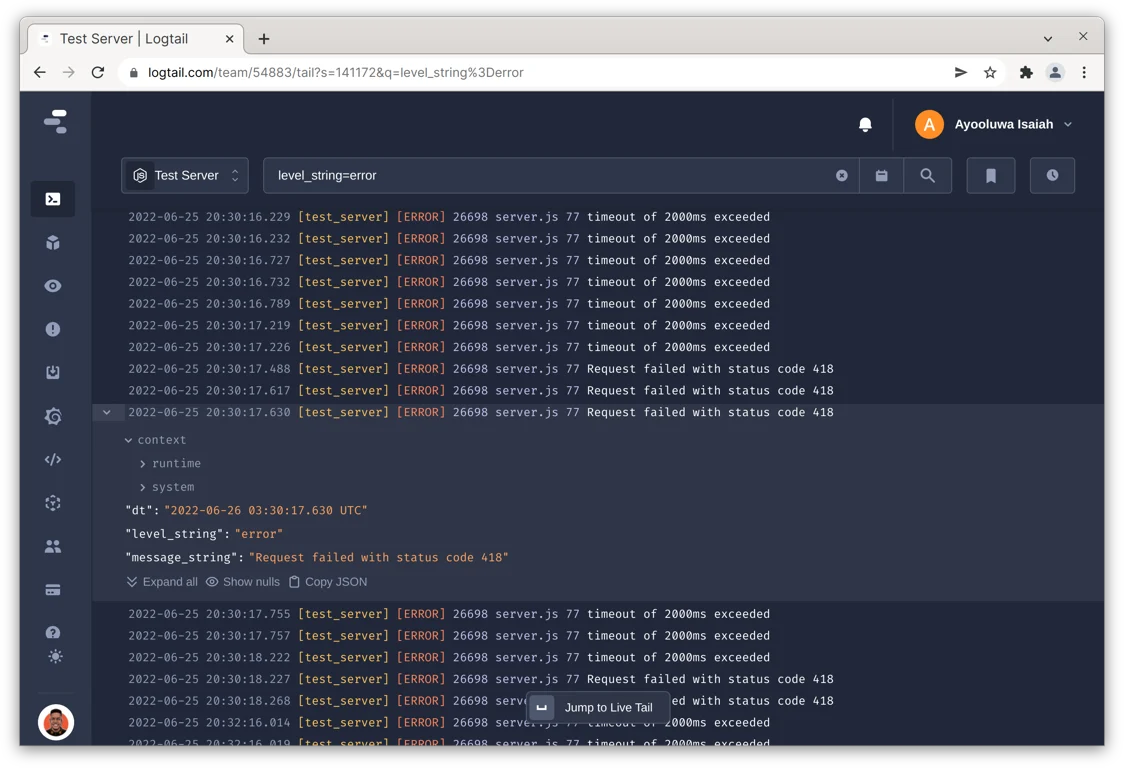
LogTail provides SQL-compatible structured log management based on ClickHouse, an OLAP database. In Logtail, you can analyze your logs by writing custom SQL queries. You can also connect Logtail to any BI tool directly. For visualization, it provides hosted Grafana dashboards which you can use to create custom charts and dashboards.
You can also archive your audit logs into an S3 glacier or other popular data stores. The pricing of Logtail starts at $0.25 per GB.
Sumo Logic
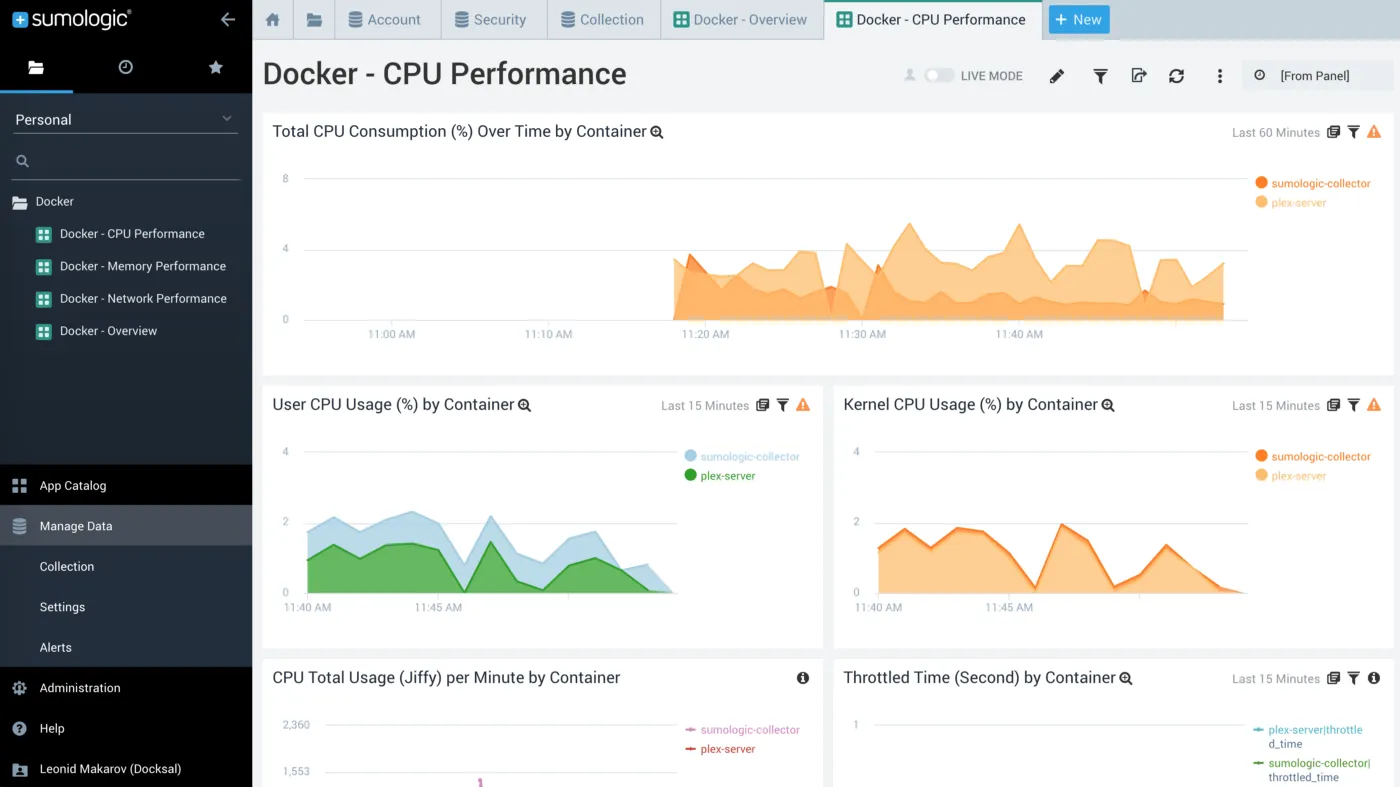
Sumo Logic is a SaaS analytics platform that provides Log management as one of its features. Sumo Logic provides a set of pre-built dashboards for a number of technologies like NGINX, Kubernetes, Docker, etc.
For example, once you install the Sumo Logic collector container on your Docker host, you can see the data sources in your Sumo Logic dashboard. Once the data sources are set up, you can directly access Docker dashboards. You can find the pricing details here.
Grafana Loki (Open Source)
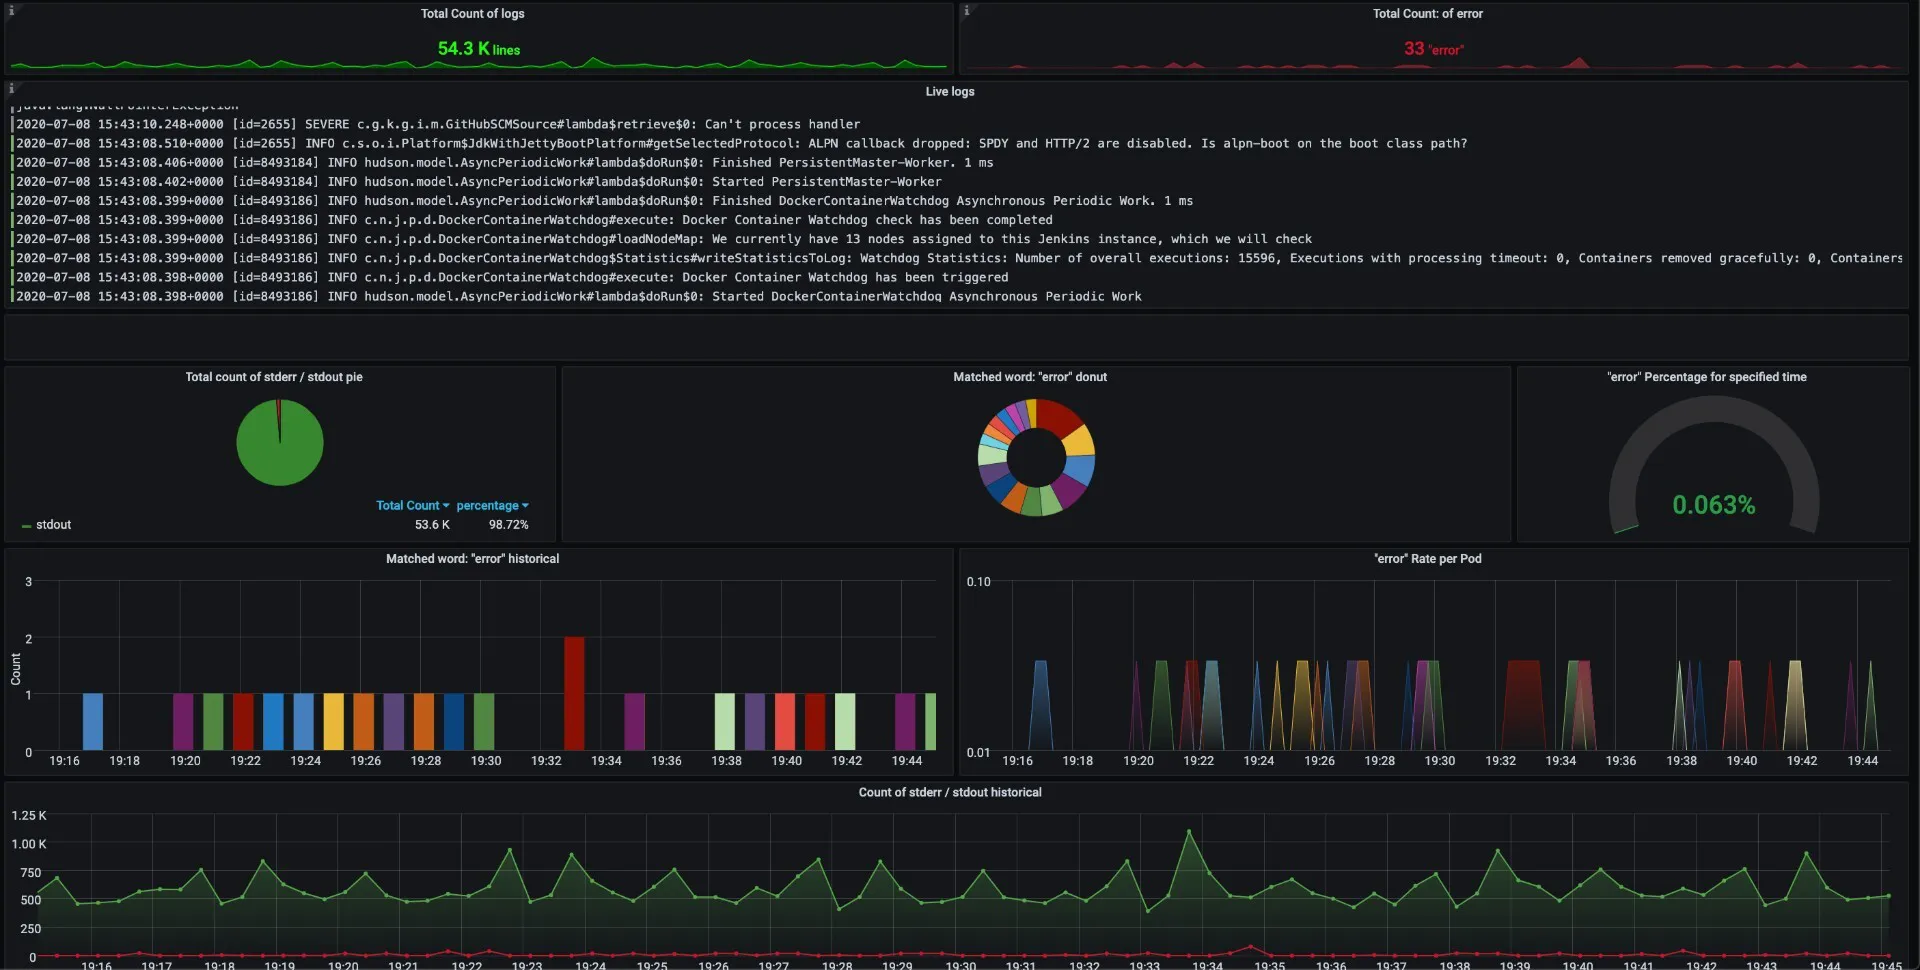
Loki is a log analytics tool that can be used as an ELK alternative. It is designed to store and query logs from your application and infrastructure. Grafana Loki is inspired by Prometheus and is a horizontally scalable multi-tenant log aggregation system.
It was started by Grafana Labs, and Grafana also offers Loki under its cloud offering. Loki indexes the metadata instead of the entire log line. This helps Loki users to store logs efficiently. You can build metrics from your logs and set alerts. You can also tail your logs in real-time. Loki uses Grafana for dashboarding and visualizations.
Splunk
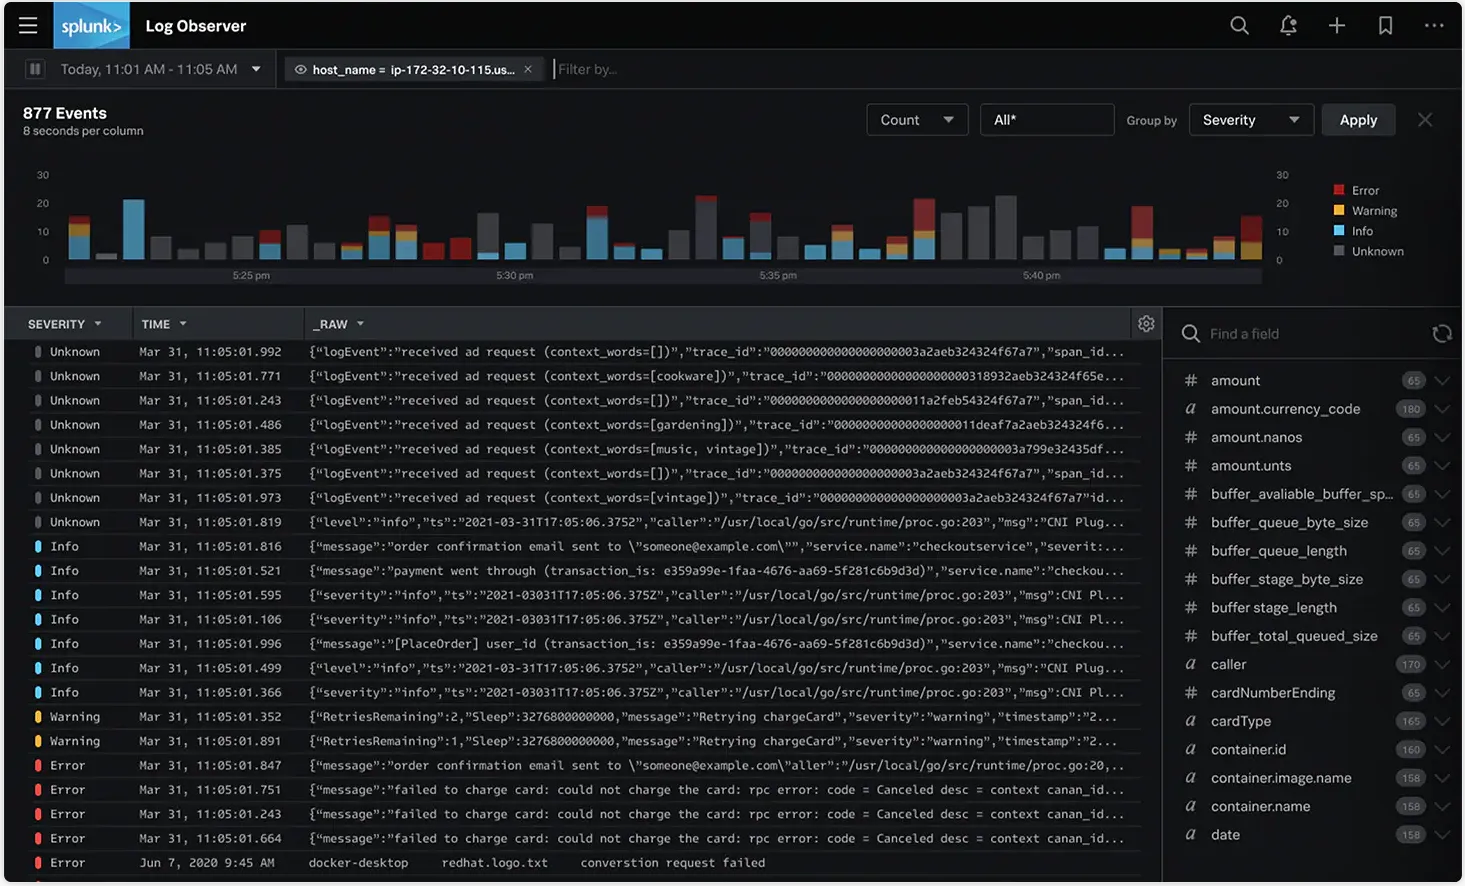
Splunk is one of the leading cloud-based analytics products for log analytics. Splunk Log Observer can be used to collect logs data from popular sources like Kubernetes, Fluentd, AWS services, etc. It provides a no-code search experience for logs that can be used to reduce MTTR.
Log data can also be converted to metrics to power real-time dashboards and alerts. Log data can be correlated with trace attributes for quicker troubleshooting.
Loggly
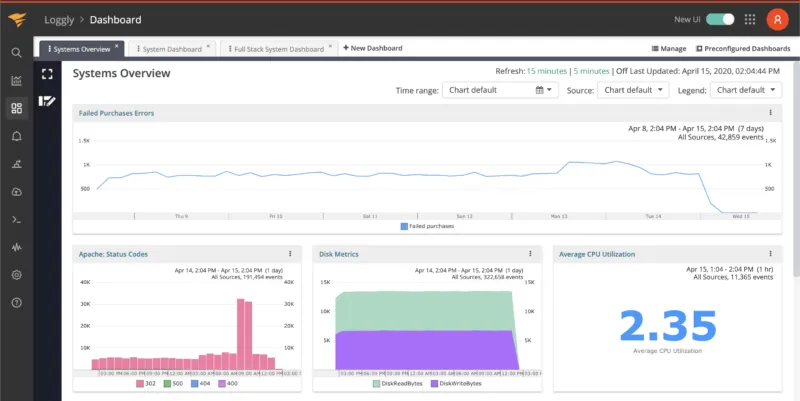
Loggly is a cloud-based log monitoring and analytics service. Under the hood, Loggly uses Elasticsearch as the primary storage and search engine for all the log data it processes. Loggly supports a large number of log sources to help you get started quickly.
Loggly helps you correlate logs with metrics and set alerts to get notified of critical issues. The pricing starts at $79 per month. You can find more details here.
Sematext
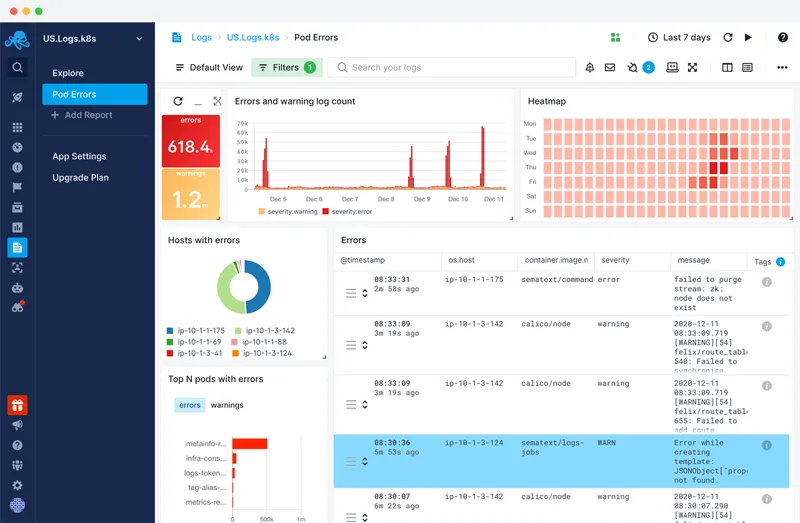
Sematext provides log management as a service that you can use as an ELK alternative. It provides a hosted ELK stack that you don’t need to maintain or scale. Its centralized logging management solution allows you to create your own queries using the Elasticsearch API. It also provides a simpler query syntax.
It supports sending alerts via e-mail, slack, Pagerduty, and various other 3rd party integrations. You can send your log data using Logstash, Filebeat, or Logagent. You can also use any tool that works with Elasticsearch’s REST API.
DataDog
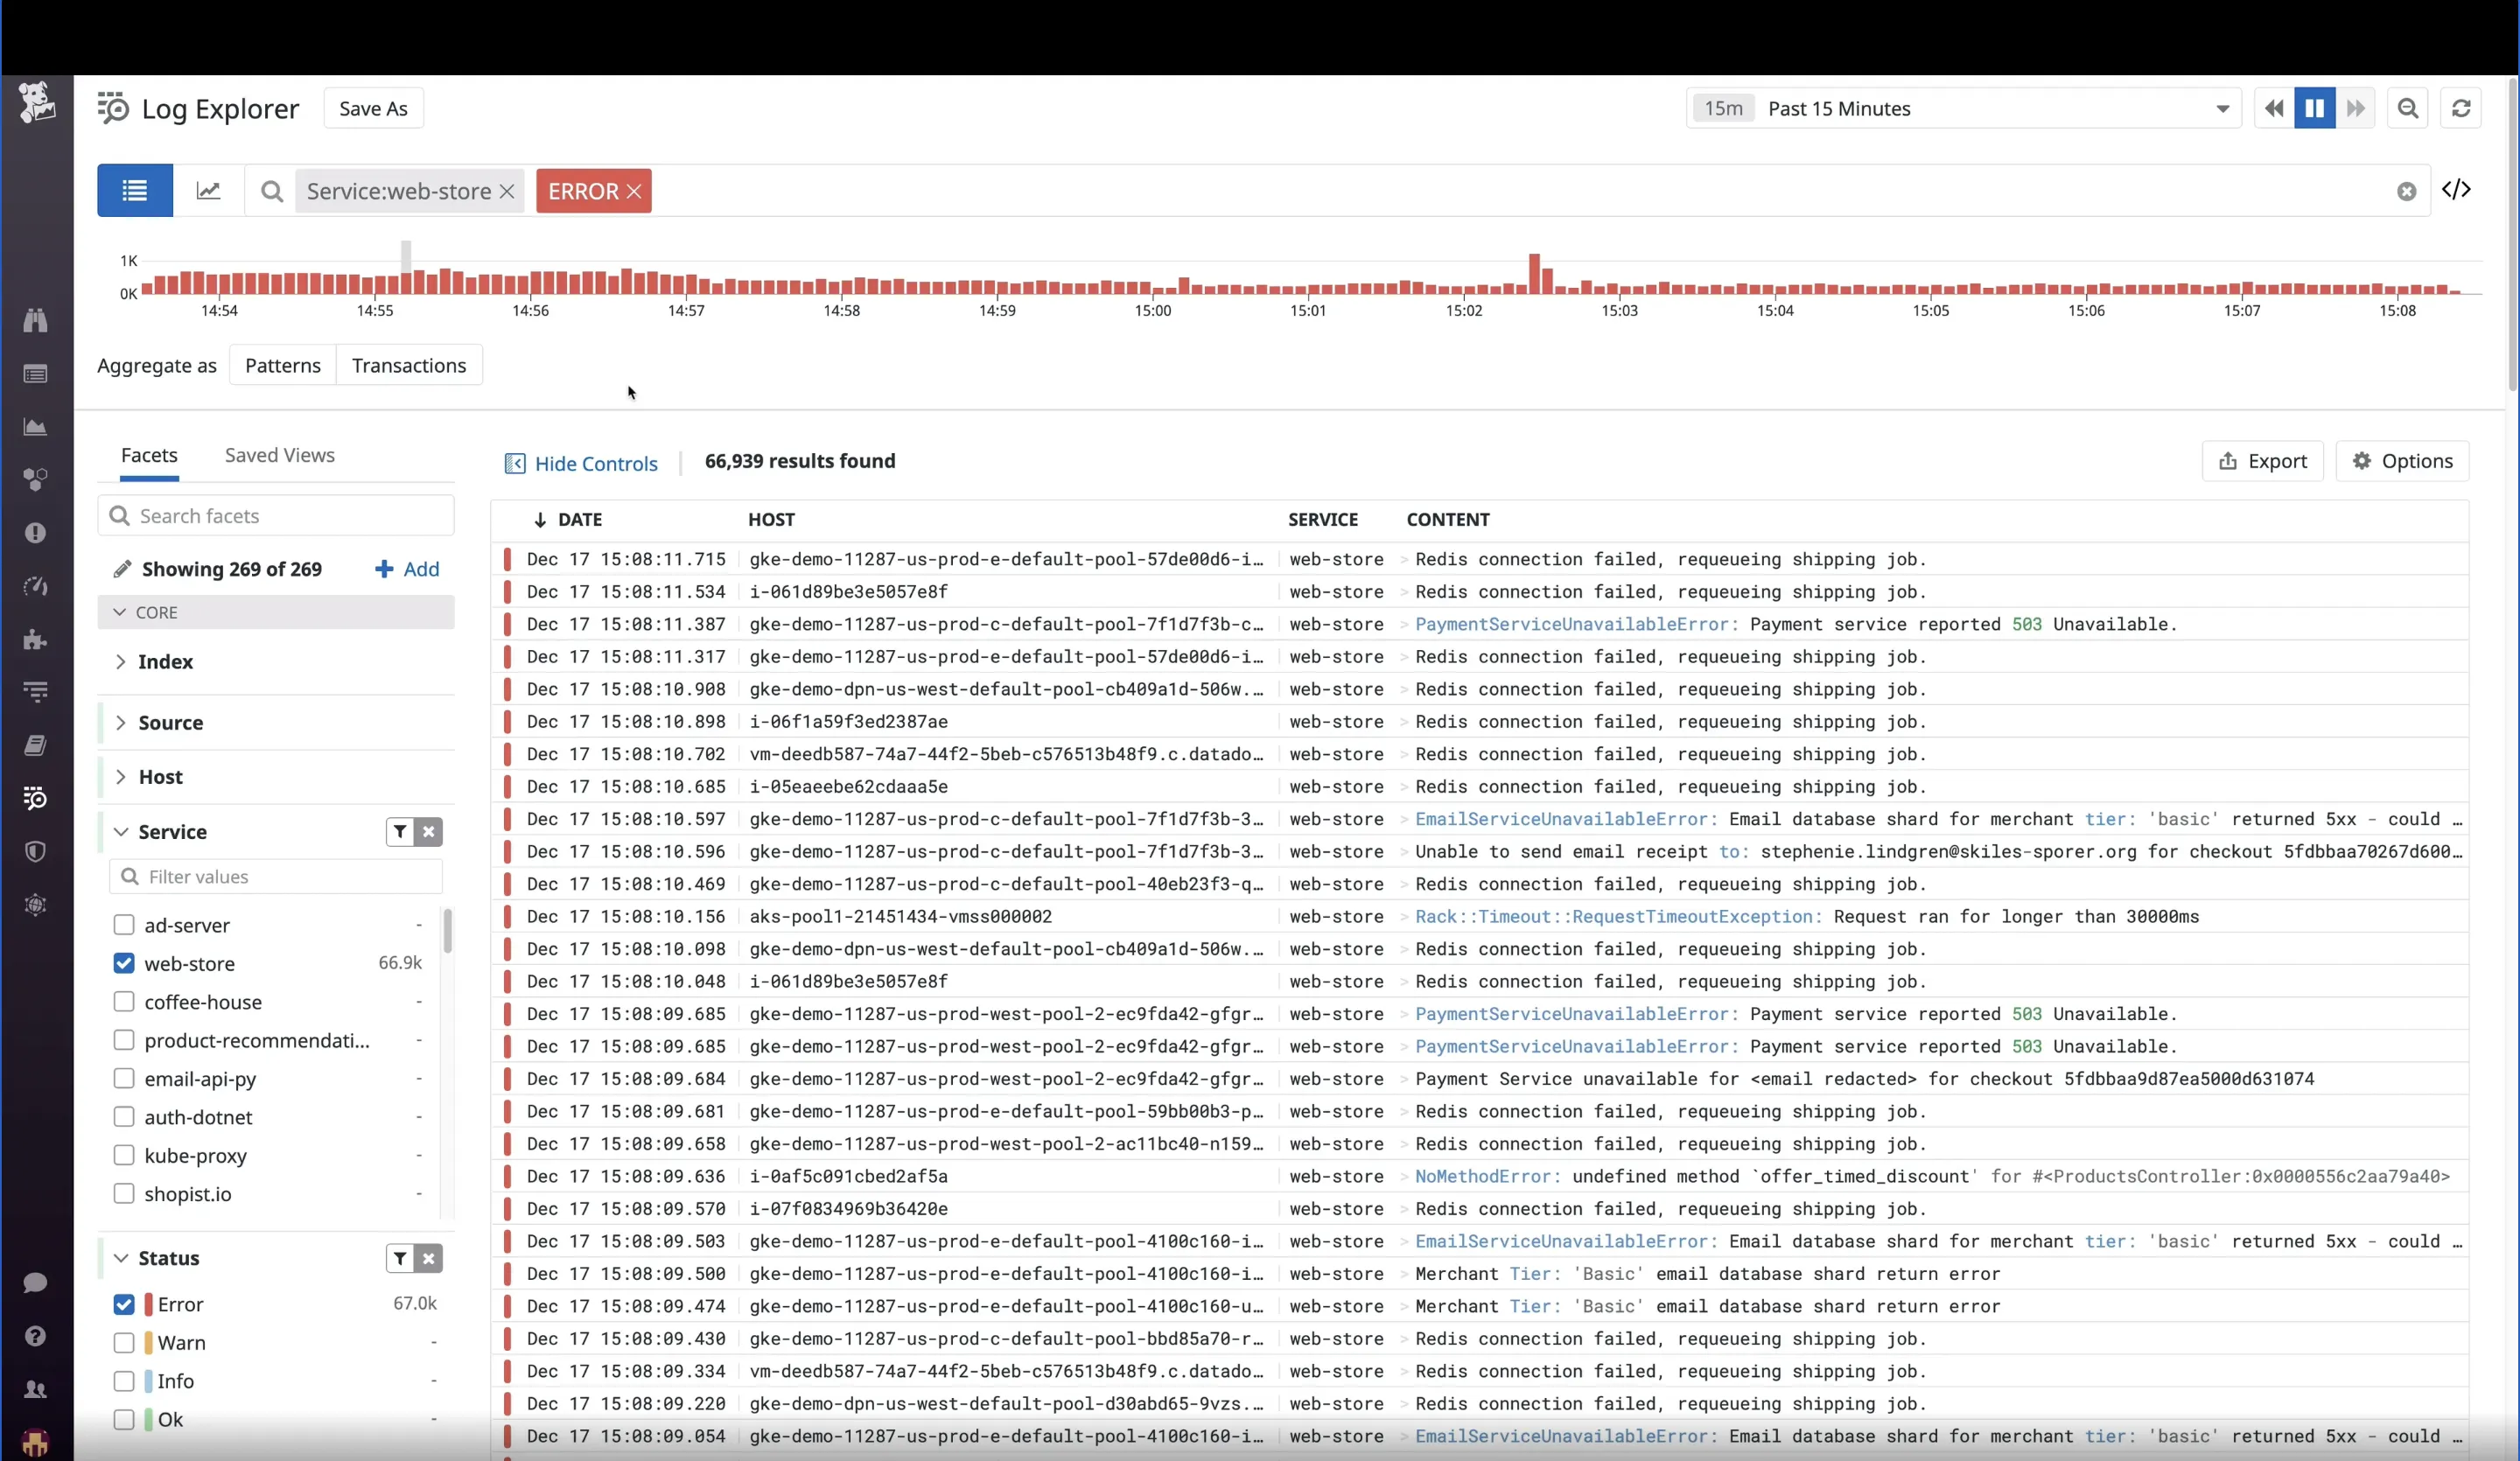
DataDog is a SaaS-based data analytics platform that provides log analytics as one of its features. It can be used as a replacement for elastic stack. DataDog decouples log ingestion from log indexing, thus allowing you to ingest all logs. It provides a Log Explorer that you can use to explore and analyze logs.
Using the Log explorer, you can search and filter logs, group queried logs into higher-level entities. You can also create log visualizations for quicker troubleshooting.
DataDog is a full-stack observability solution, and you can either use the entire suite of products or just opt in for its log management product. The pricing starts at $0.10 per GB of uncompressed data ingested. You can find more details here.
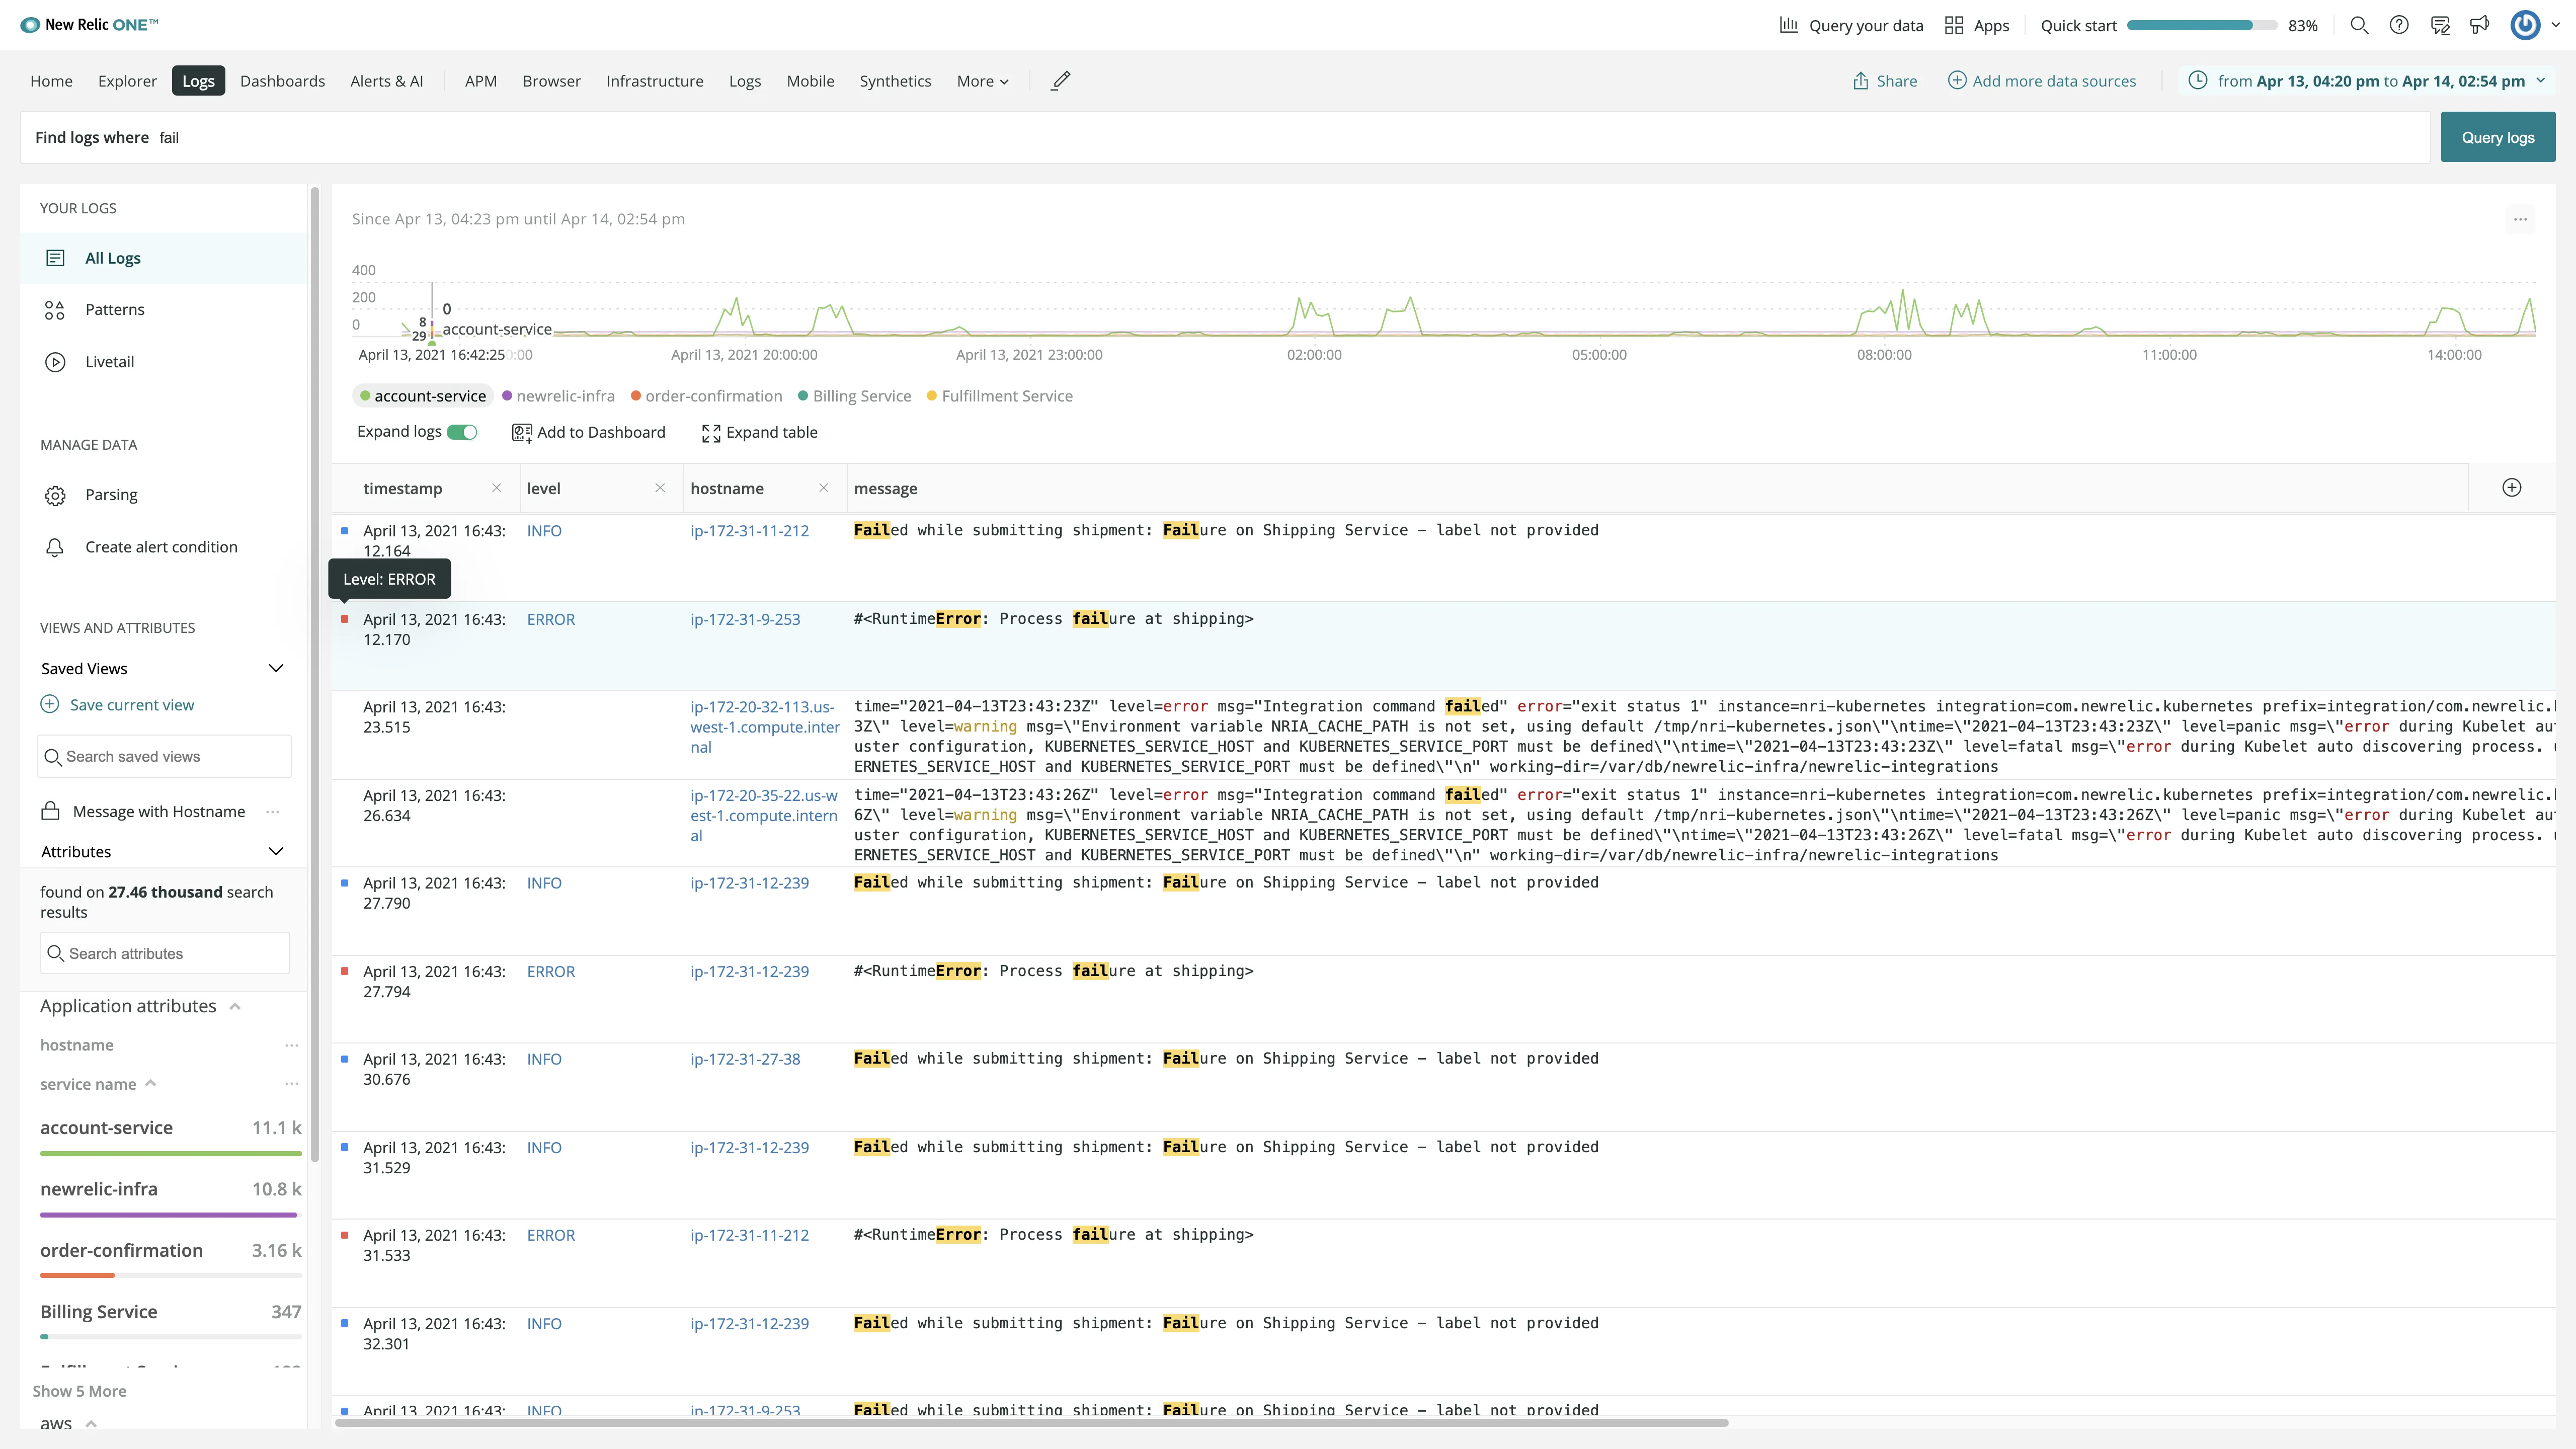
New Relic
New Relic provides log management with the ability to quickly search through your logs. You can create custom charts and dashboards and set alerts to get notified of critical issues. New Relic also provides many other products like infrastructure monitoring, network monitoring, browser monitoring, etc. Using the other platforms, you can view your logs with context.
It lets you connect your log data with the rest of your application and infrastructure data. If you are using New Relic’s APM agent, you can directly forward the log data to New Relic without using any third-party tools. New Relic’s pricing is based on the amount of data ingested and user seats. You can also use this cost estimator to estimate your costs.
Dynatrace
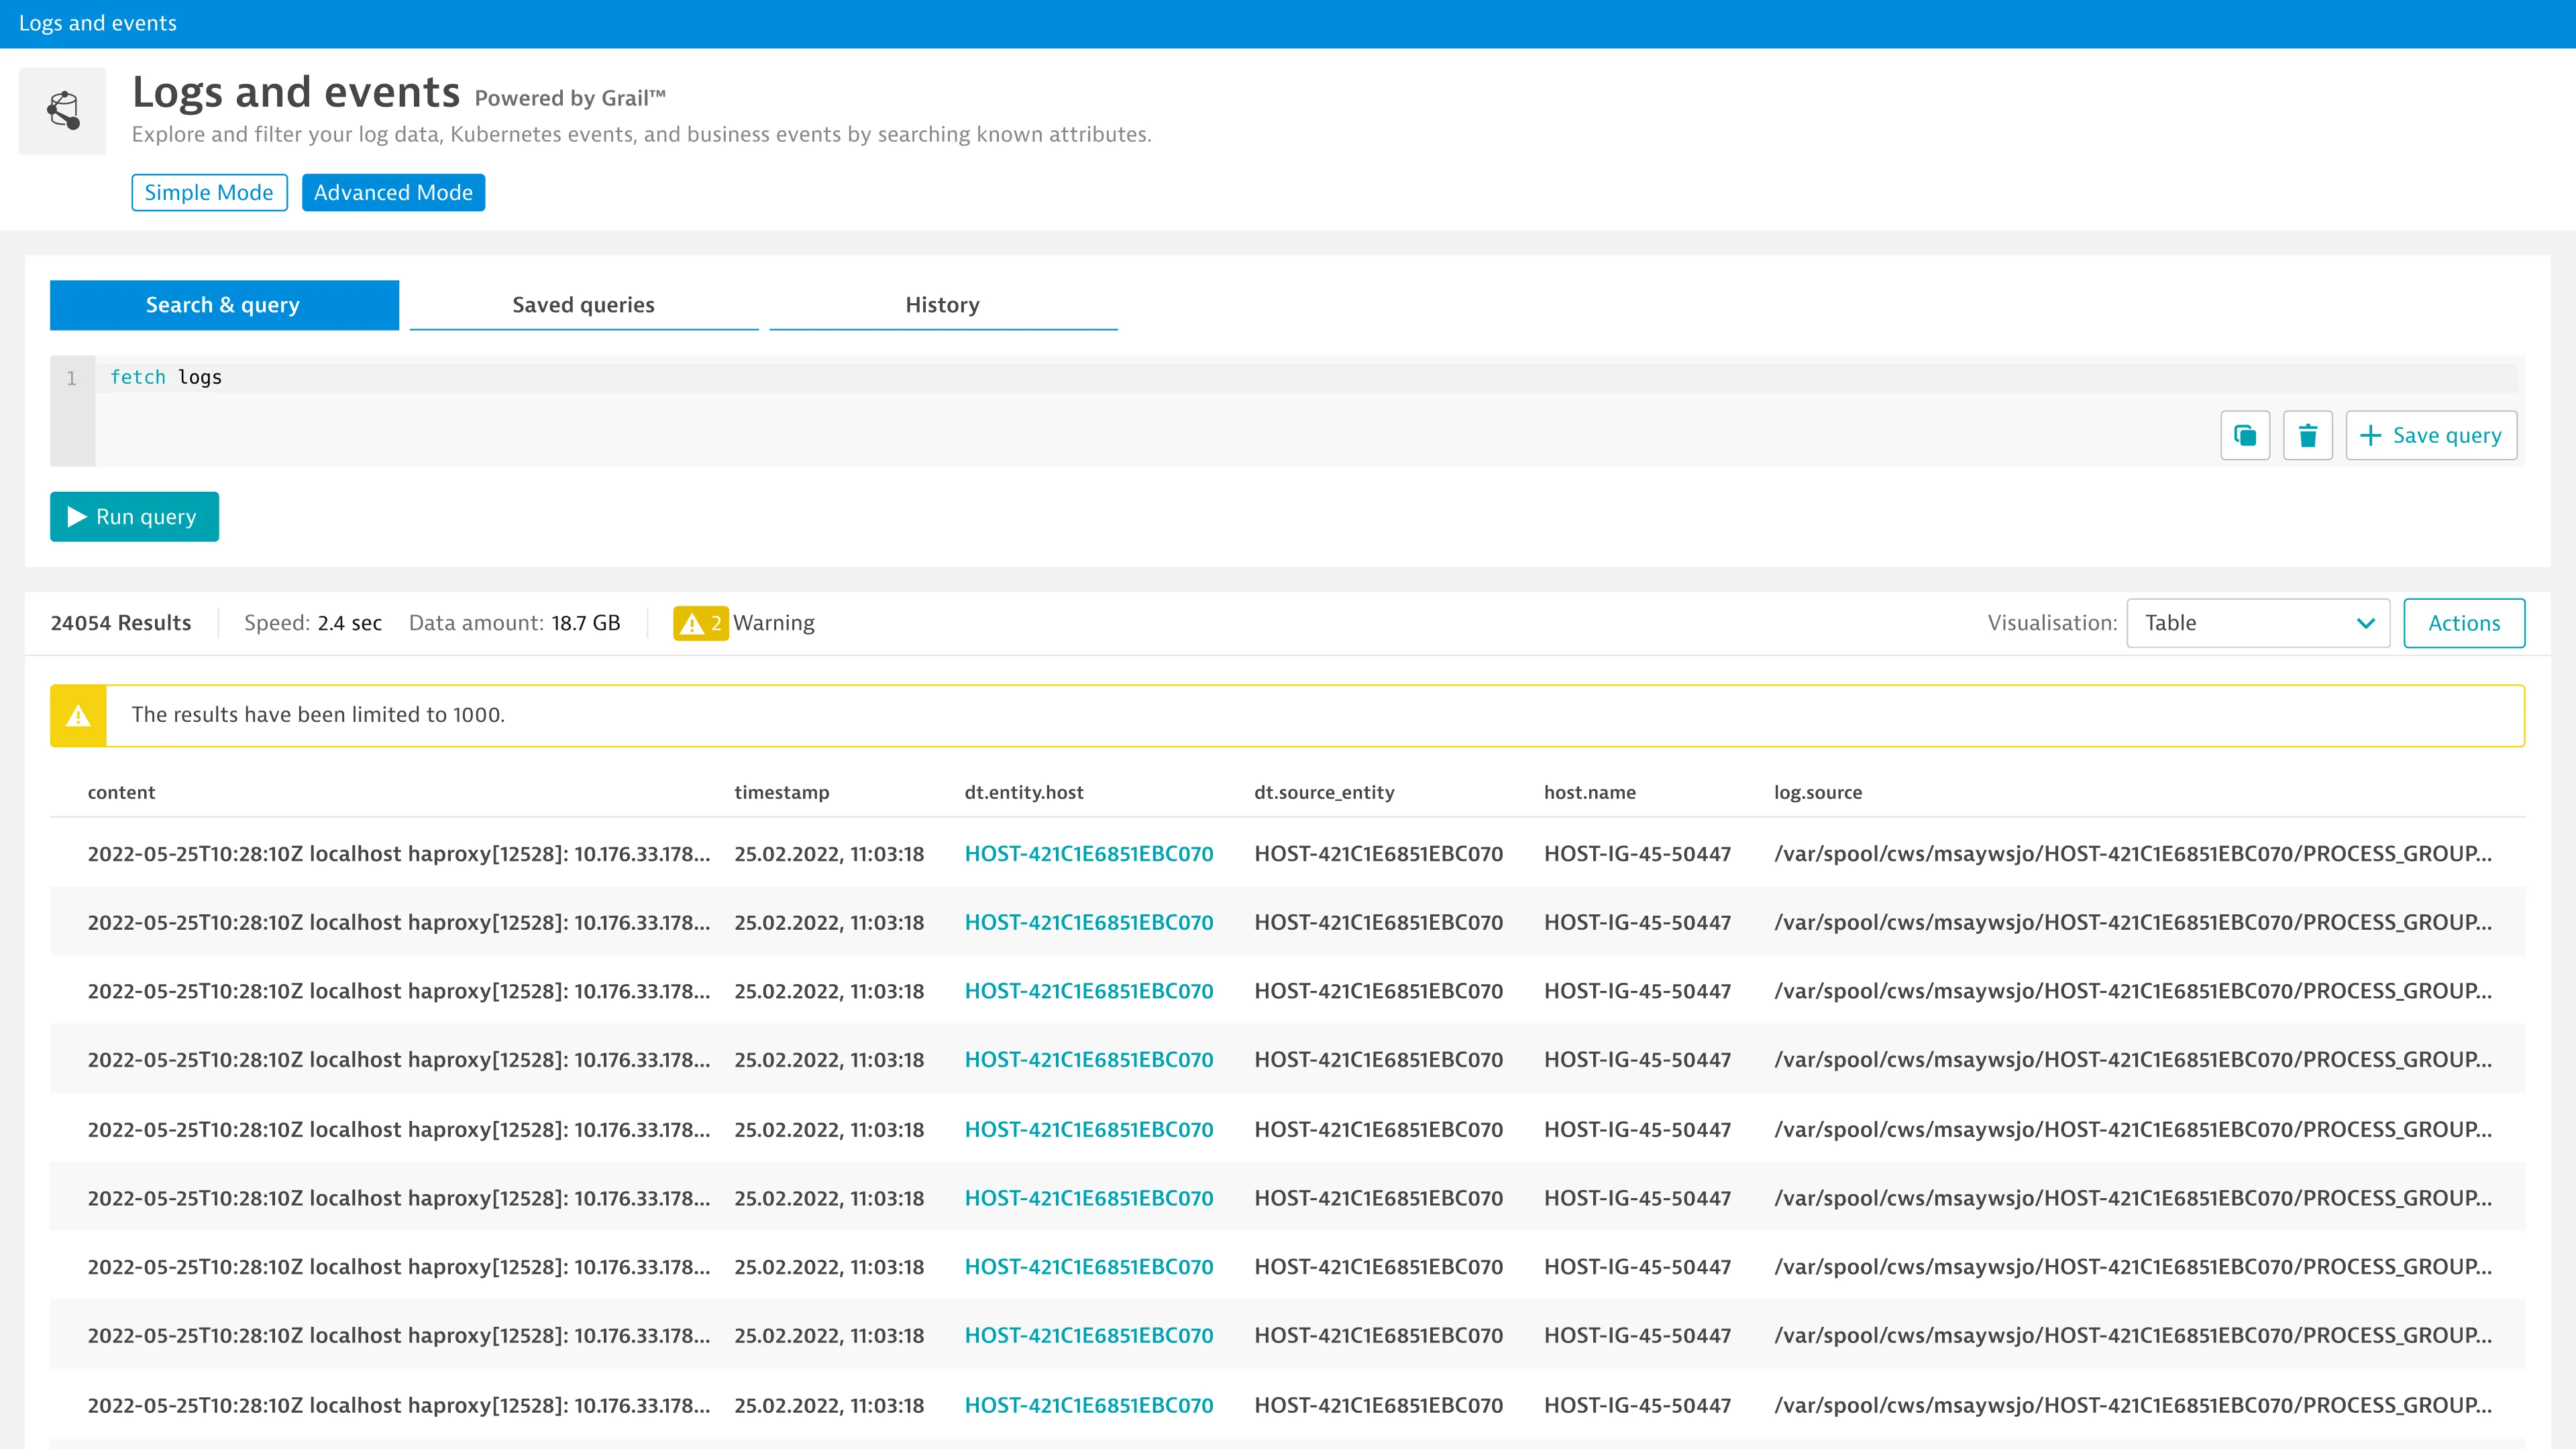
Dynatrace offers Log monitoring as part of the Dynatrace platform. You can use Dynatrace as an ELK alternative and collect logs from your applications, infrastructure, and cloud platforms. You can set up automatic log collection and processing from various data sources.
You can also define patterns, events, and custom log metrics and set alerts on them. For log data analysis, it provides a log viewer that enables you to browse logs in any specified timeframe. You can use advanced filtering capabilities to narrow down the logs you require.
Mezmo (Previously LogDNA)
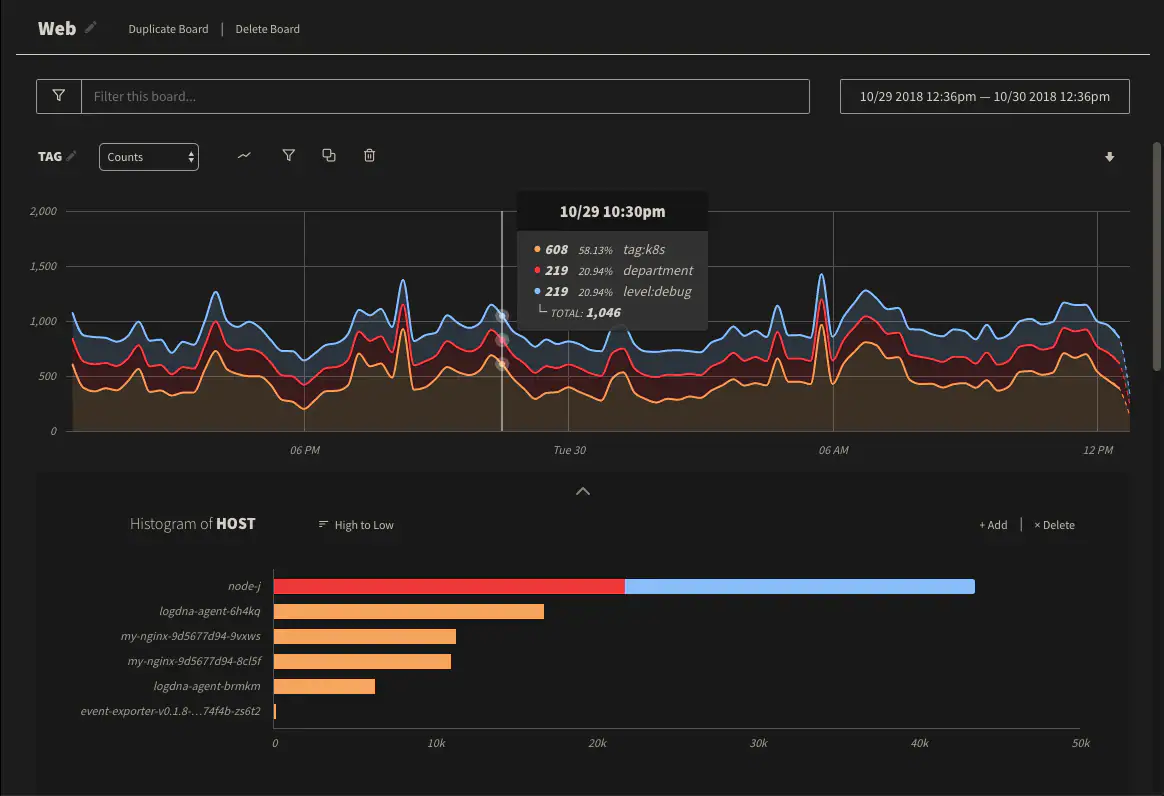
Mezmo provides an easy-to-use and scalable solution that can be used as an ELK stack alternative. You can search and filter logs using the log viewer. The search is conducted across the entire log line, but you can also search on a particular field if specified. Once you have searched your logs, you can save them as a view and set alerts on them when certain conditions are met.
Mezmo also provides a feature called Kubernetes enrichment that centralizes Kubernetes events, resource metrics, and logs under a single dashboard. The pricing for Mezmo starts at $0.80 per GB with 3-day retention. You can find more details here.
Papertrail
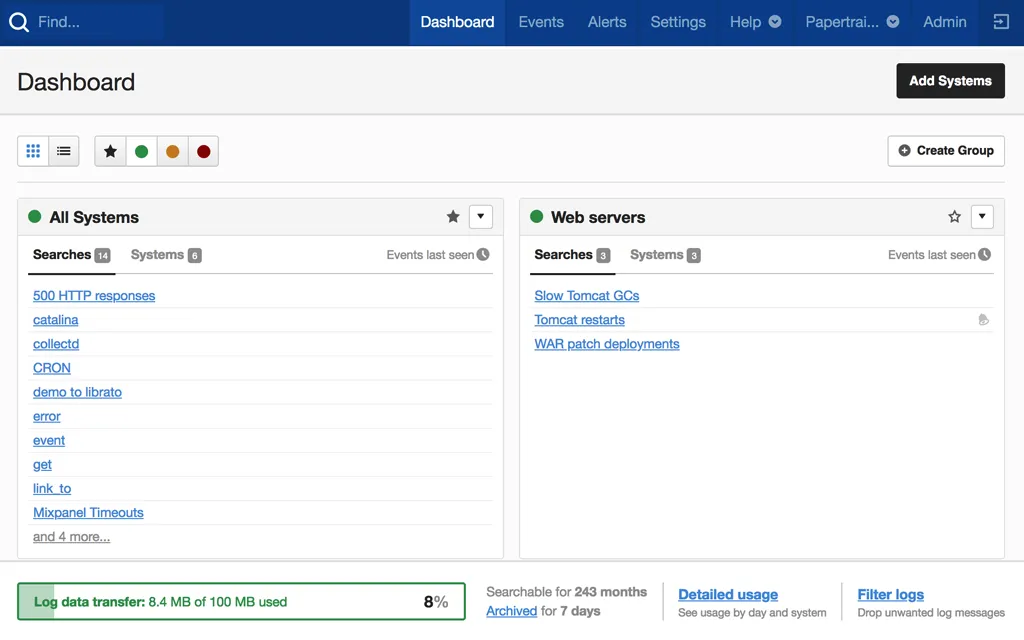
Papertrail is a cloud-hosted log management solution. You can search live log streams from multiple sources in a single search bar. Papertrail makes it easier to investigate the events that you want. You can also view events in context by digging deeper into attributes captured with the log data.
Any search can be saved to create a troubleshooting workflow. It also helps you to visualize logs data with charts and dashboards. You can view the live tail of logs. You can also connect Papertrail with SolarWinds APM Appoptics which can help you correlate different telemetry signals like logs, metrics, and traces.
Choosing the right log analytics tool
One of the most challenging parts of analyzing log data is the sheer volume of data generated. An effective log analytics tool should efficiently collect and store huge volumes of data. Once the data is collected and stored, log analysis is where tools can make a difference. Enabling users to search through logs quickly and run queries and aggregates to identify the root cause of issues in their application or infrastructure are critical aspects of a good log analytics tool.
While choosing a log analytics tool, a few factors should be kept in mind.
- How efficiently can the tool store logs?
- How easy is using the UI to analyze log data from multiple sources?
- Does the tool provide features to correlate log data with other telemetry signals like metrics and traces for deeper insights?
SigNoz supports efficient log storage, provides an intuitive UI, and lets you correlate your logs with traces and metrics for quicker analysis. SigNoz is also open source and can be self-hosted within your infrastructure.
Getting started with SigNoz
SigNoz Cloud is the easiest way to run SigNoz. Sign up for a free account and get 30 days of unlimited access to all features.
You can also install and self-host SigNoz yourself since it is open-source. With 24,000+ GitHub stars, open-source SigNoz is loved by developers. Find the instructions to self-host SigNoz.
Related Posts

