Understanding Flame Graphs for Visualizing Distributed Tracing
In the ever-evolving world of software development, one constant remains - the pursuit of better performance. As applications grow in complexity and demand, the need for tools to uncover performance bottlenecks becomes paramount.
Flamegraphs, a brainchild of Brendan Gregg, has emerged as an important visualization of insight, showing those dark corners of your codebase that need optimization. Before we dive into understanding how to use these instruments, let's first light the flames of curiosity by exploring what exactly a Flamegraph is and why it's a must-have in your performance optimization toolkit.

What is Flamegraph?
A Flamegraph is a visualization of hierarchical data created by Brendan Gregg, primarily used for performance profiling analysis of software applications by representing telemetry data of service latency, error causing those latencies, and pinpointing the service causing error.
It provides an in-depth representation of stack traces, their respective resource consumption, and microservice latency(s) and is particularly useful for identifying performance bottlenecks in software systems. It's a really handy visualization from a developer's point of view.
Now that we are done with the introduction let us see how they work!
How Flamegraphs Work:
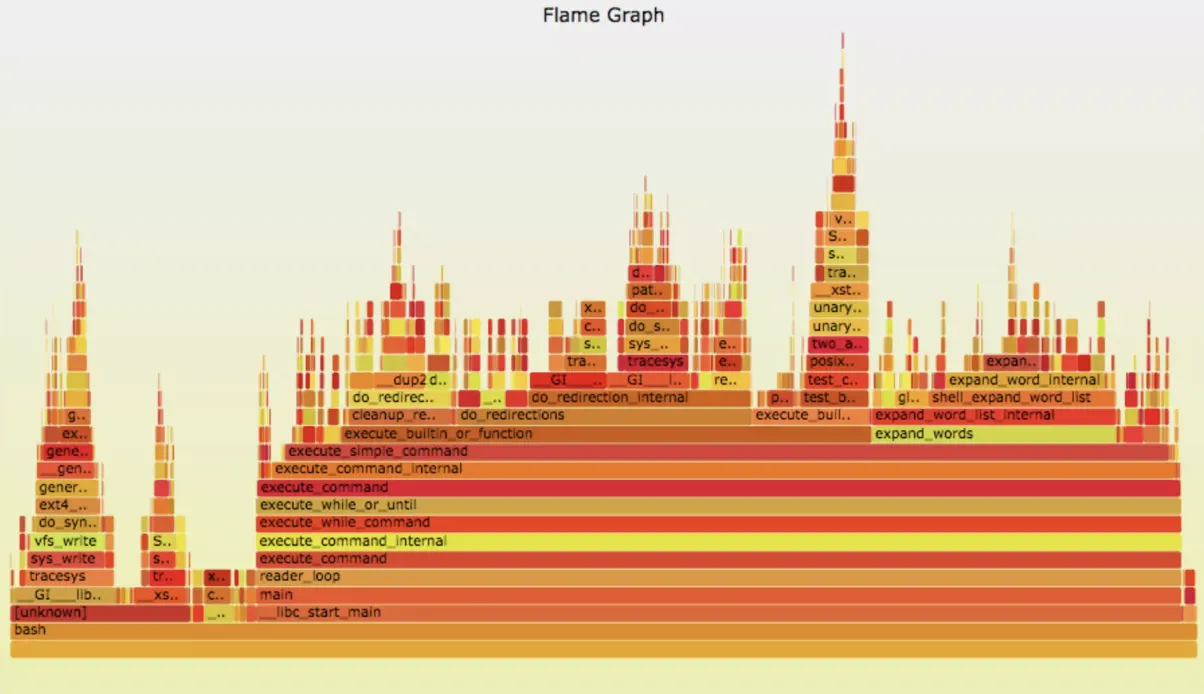
A Flamegraph is basically composed of a series of horizontally oriented blocks or rectangles, which are stacked vertically. Each block represents a function call or a portion of the code execution stack.
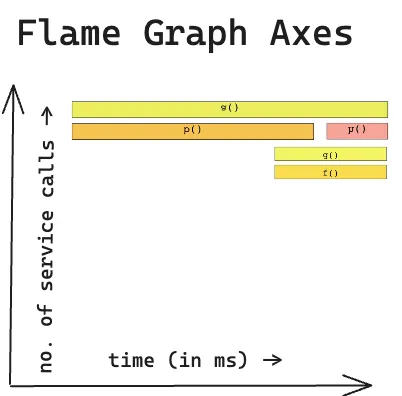
The x-axis of the graph corresponds to the stack depth, whereas the y-axis represents the time used by each function/function call/service request.
Here's a simple textual example of a Flamegraph:
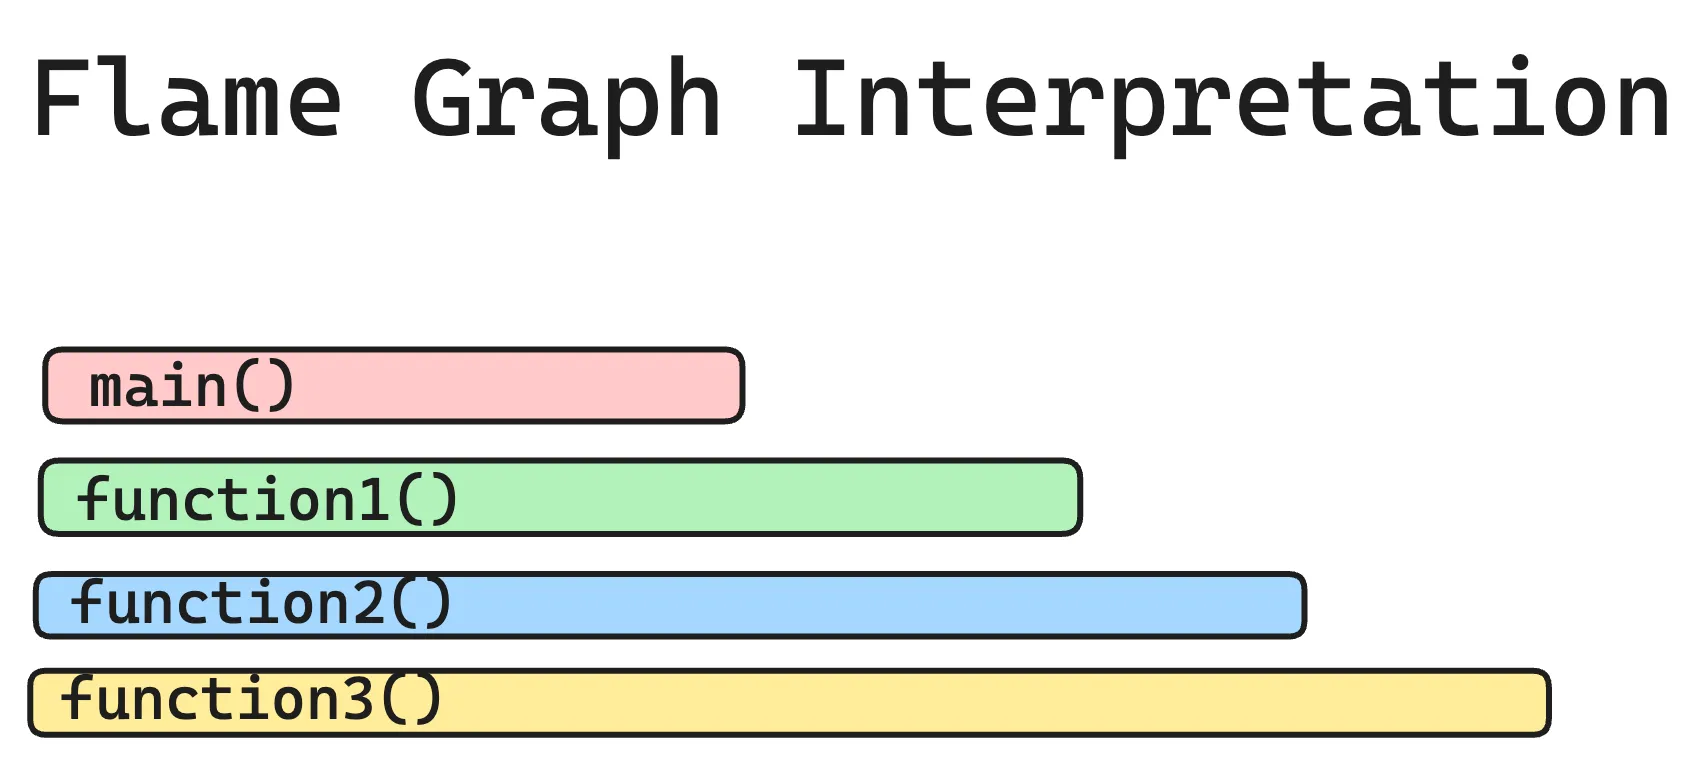
In this example, "main()" called "function1()", which in turn called "function2()", and so on. The width of each block reflects the time taken by that function and its children's functions.
Each bar or span in a flame graph typically represents a function or method call rather than individual units of work like API calls or database queries.
Why are Flamegraphs important?
Flamegraphs are the backbone of trace profiling tools; why? Due to their sheer ability to showcase so many crucial details in such vivid graphical representation. Here are several other reasons:
1. Identify Performance Bottlenecks:
Flamegraphs, in this regard, are helpful for identifying performance bottlenecks in your code. They allow you to see which code paths (db calls, timeouts, unoptimized parts, network delay, etc ) are consuming the most time.
By focusing on these hotspots, you can make targeted optimizations to improve your application's speed.
Example: Imagine you have a Python script that generates reports. By generating a Flamegraph, you can quickly identify that a specific data processing function is consuming a significant portion of the execution time.
Now, if you find that one (or many) function(s) that causes the most delay, you can optimize them.
2. Prioritize Optimization Efforts:
Now, instead of blindly optimizing random parts of your code, which most of us do anyway, you can focus on the functions with the widest blocks in the Flamegraph.
These functions are the most time-consuming and offer the most significant potential for improvement.
Example: In a Java application, you discover that a method responsible for database queries takes up a large portion of the Flamegraph. You can concentrate your optimization efforts on this method to reduce database query time.
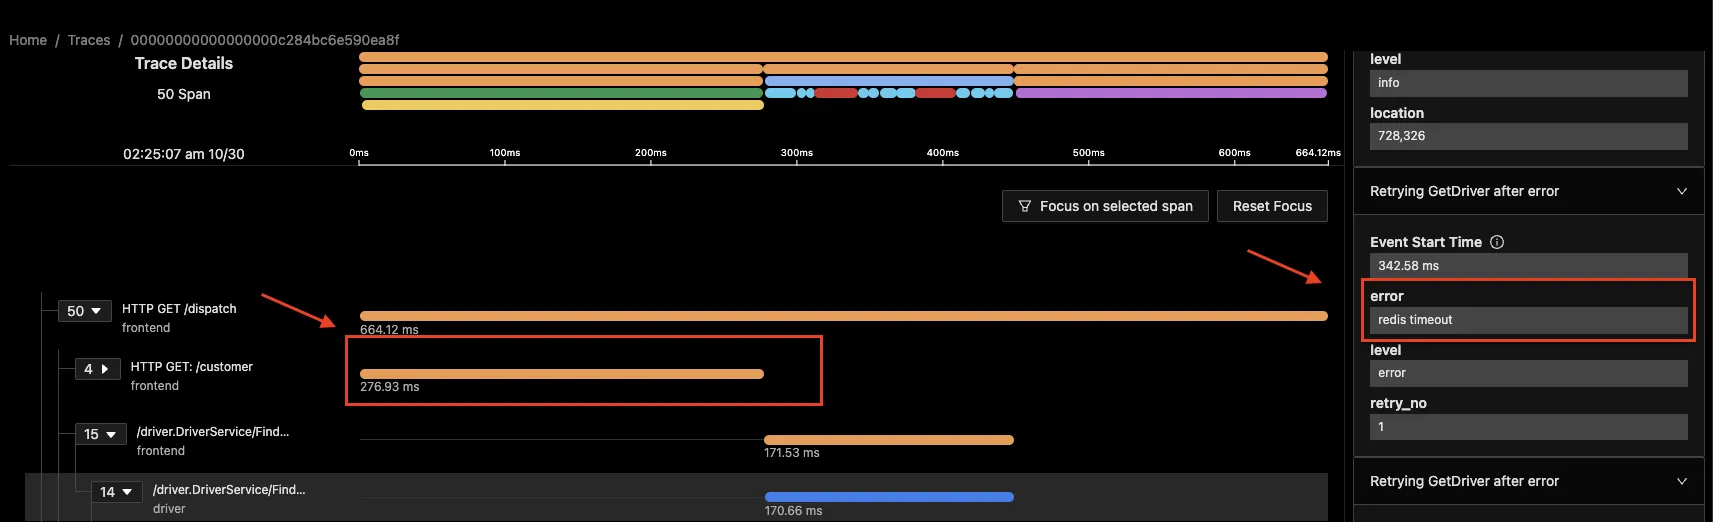
In the image below, you find out the longest trace is of redis and its a redis timeout, now that you know the cause for latency, you go back to your code and optimise it.
3. Detect Unintended Consequences:
Optimizing one part of your code can sometimes unintentionally impact other areas, and so flamegraphs help you detect such unintended consequences.
If you happen to see a new hotspot in the Flamegraph after an optimization, it might mean that you've shifted the bottleneck to another part of your code. That’s bad.
Example: You optimized memory usage in a C++ program, but the Flamegraph shows increased latency time in a previously insignificant function or connected service. This may mean that the optimization affected the working of the connected service, leading to a new performance bottleneck.
4. Collaborative Debugging:
When multiple devs work on a single project, a Flamegraph provides a visual representation of performance data that is easy to share and discuss.
Example: Your team is working on a Node.js application, and different members are responsible for different modules. Sharing a Flamegraph can quickly highlight which modules need attention, making collaboration more productive.
5. Distributed Tracing:
Finally, in the context of distributed systems, Flamegraphs can help trace request paths across multiple services and network boundaries.
Understanding Flamegraphs in Distributed Tracing
Distributed tracing is a crucial technique for monitoring and diagnosing the performance of complex, microservices-based applications.
Flamegraphs, originally designed for profiling single applications, have been adapted to visualize distributed tracing data, offering many deep insights into how requests propagate across our multiple services and microservices.
Here's a detailed explanation of how Flamegraphs are used in the context of distributed tracing:
What Are Flamegraphs in Distributed Tracing?
In distributed tracing, Flamegraphs visually represent the execution path for requests as they traverse various services and components.
Each horizontal bar in a Flamegraph represents a function or a service, and the width of the bar reflects the amount of time spent within that function or service during the request's lifecycle.
By examining Flamegraphs, you can identify bottlenecks, latency issues, and service dependencies.
Generating Traces
You can use OpenTelemetry to generate traces from your application. OpenTelemetry is an open-source standard for generating telemetry data like logs, metrics, and traces.
For distributed tracing, you can check out these docs to implement it in different programming languages.
Once you have instrumented your application with OpenTelemetry, you can send the traces to a backend observability tool like SigNoz for visualization.
Visualizing Distributed Traces with Flamegraphs
Once you have captured trace data from your services, you can feed it into a tool like SigNoz, which processes the data and generates Flamegraphs. The Flamegraph displays the execution path of requests, showing how time is spent across different functions or services.
Getting started with Flamegraphs for traces
Getting started with Flamegraphs for traces involves a series of steps to collect and visualize performance data. We'll use OpenTelemetry (OTel) and SigNoz as examples to walk you through the process.
1. Instrument Your Code with OpenTelemetry:
To start collecting tracing data for Flamegraphs, you need to instrument your code. OpenTelemetry provides libraries for various programming languages.
Here are detailed guidelines to instrument your application(s) and visualize the trace data in SigNoz dashboards- https://signoz.io/docs/instrumentation/
2. Generate Flamegraphs:
Once you've instrumented your code, you can configure your SDK or OpenTelemetry exporter to send data to SigNoz.
- Run your application and perform actions or generate load to capture traces.
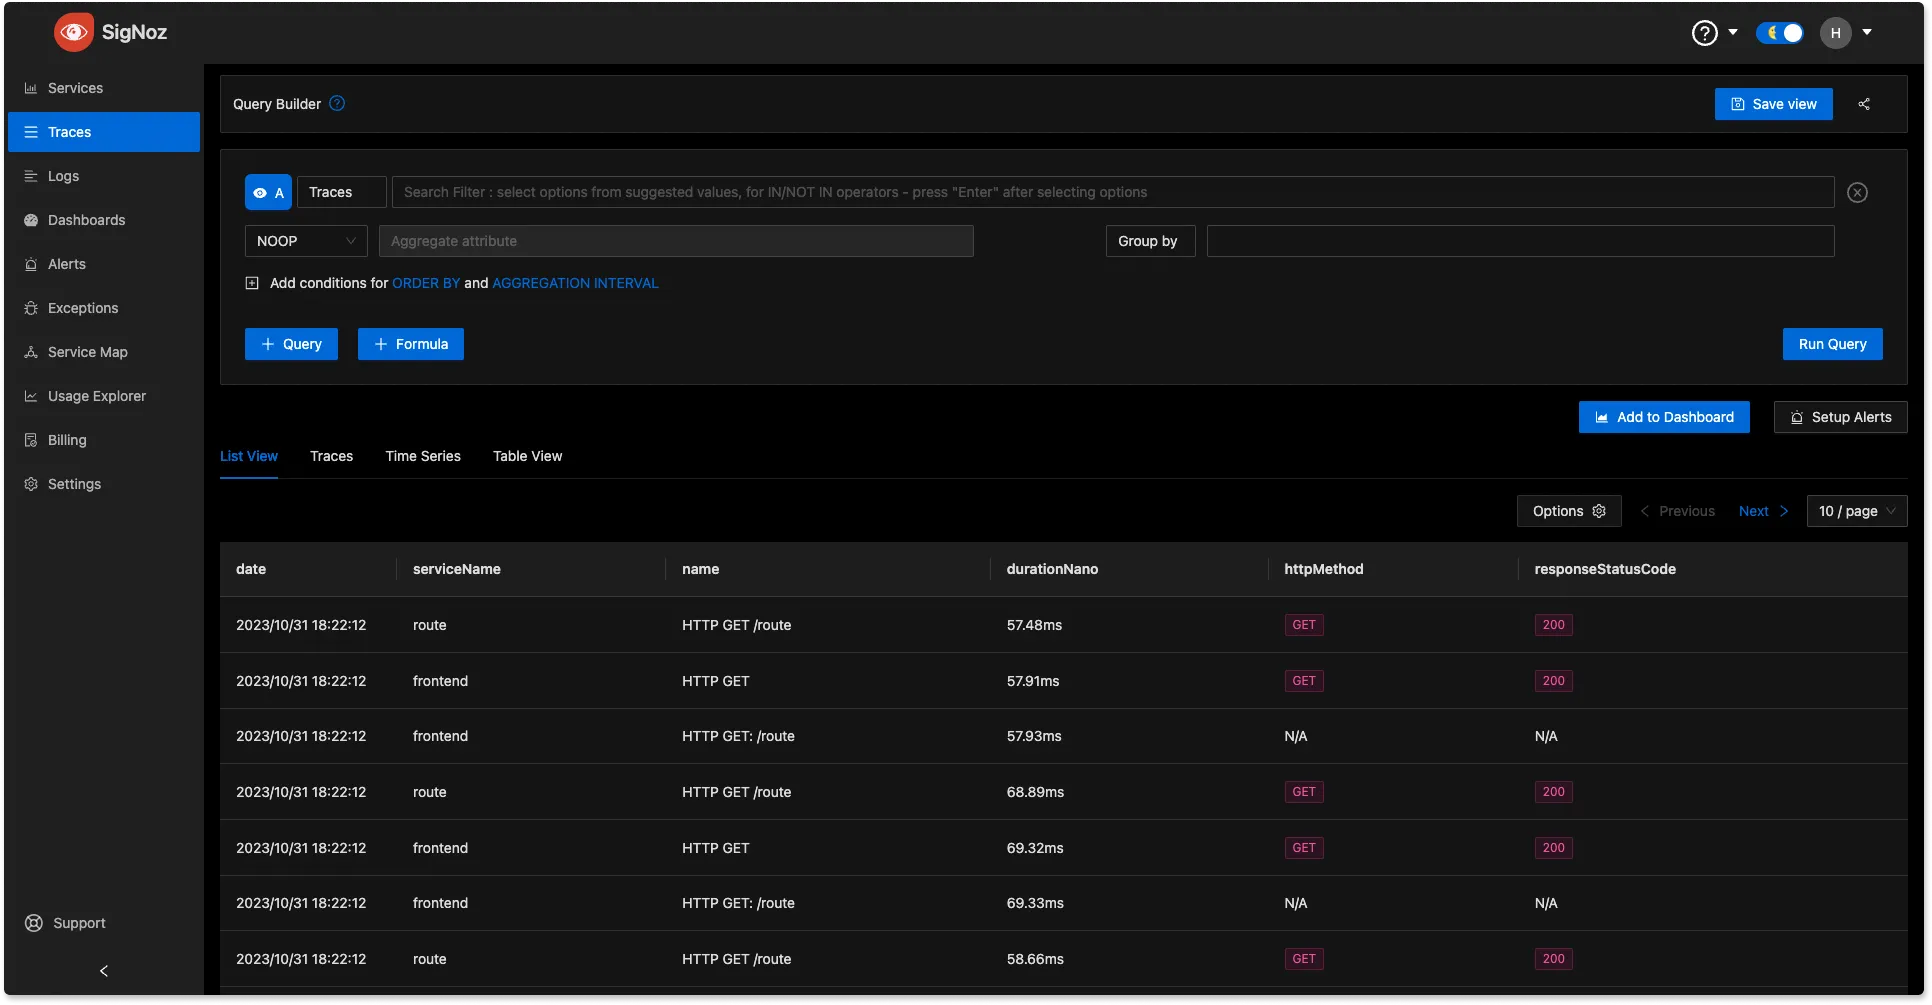
- In SigNoz, navigate to the trace data section and select the span you want to analyze. Spans are fundamental building blocks of distributed tracing. A single trace in distributed tracing consists of a series of tagged time intervals known as spans.
3. Analyze Flamegraphs:
The generated Flamegraphs will typically display a graphical representation of the a single trace. You can then click on any span to see detailed information about time spent. The wider the block, the more time it consumed. Spans also come with rich contextual data in the form of key-value attributes.
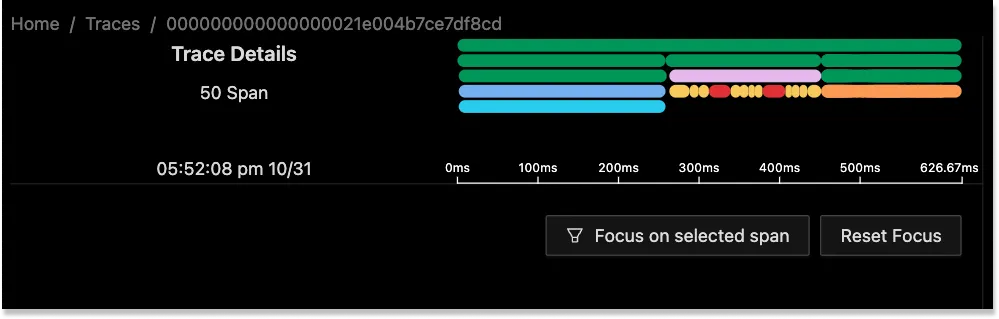
The following illustration shows the Span Details page:
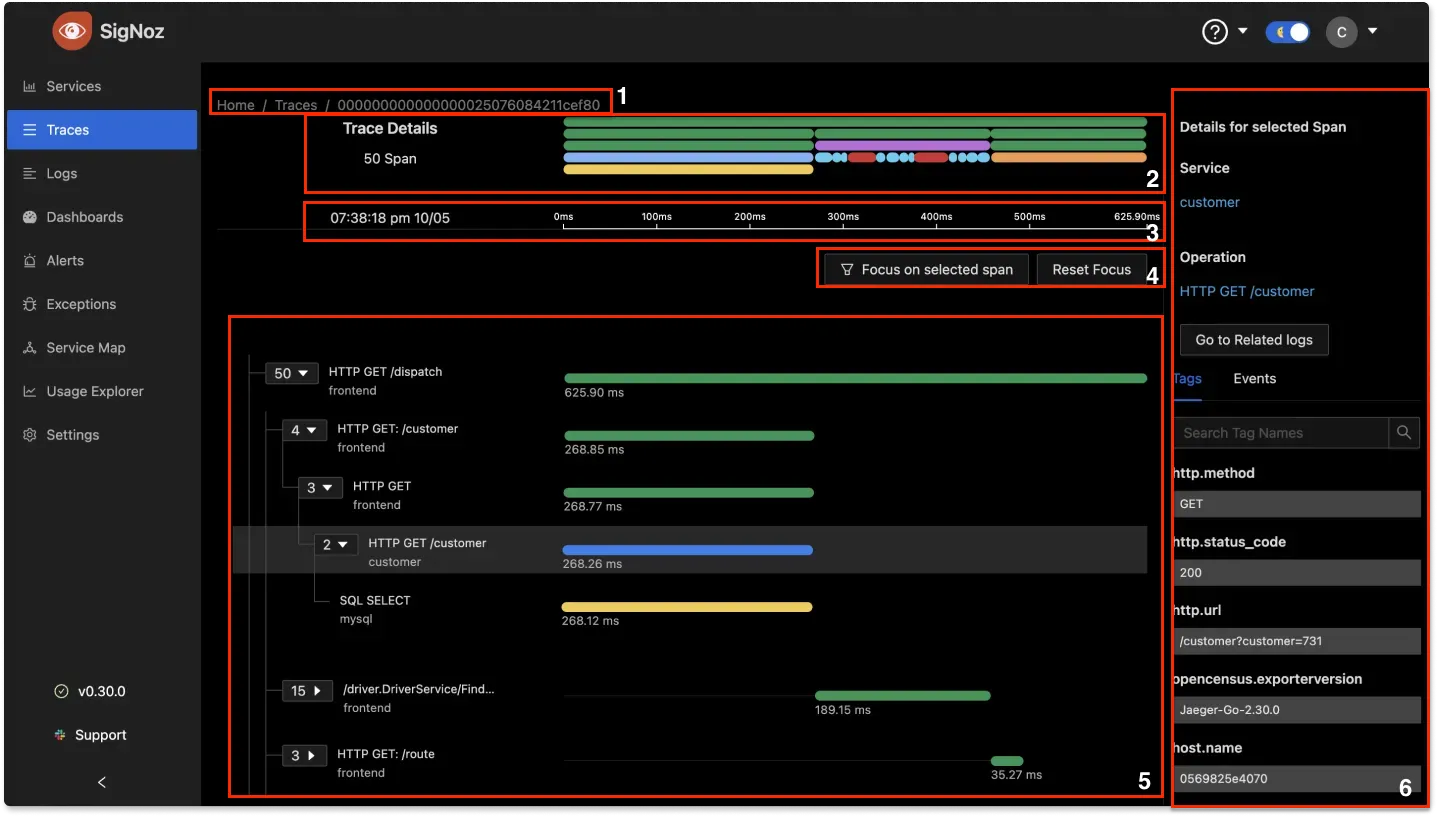
Legend:
- Trace ID: At the top of the page, SigNoz displays the ID of the currently selected trace.
- Flame Graph: Shows the flame graph.
- Time: Displays the start time and duration of the currently selected trace.
- Focus: Allows you to focus on a specific span.
- Main content area: Displays all the spans as a tree structure. You can expand or collapse individual nodes in the tree to show or hide its children nodes. For each node, SigNoz displays the number of children nodes.
- Span Details: Displays the tags and events for the currently selected span.
Getting started with SigNoz
SigNoz Cloud is the easiest way to run SigNoz. Sign up for a free account and get 30 days of unlimited access to all features.

You can also install and self-host SigNoz yourself since it is open-source. With 24,000+ GitHub stars, open-source SigNoz is loved by developers. Find the instructions to self-host SigNoz.
Further Reading
