Comparing Datadog and New Relic's support for OpenTelemetry data
"Trade isn't about goods. Trade is about information. Goods sit in the warehouse until information moves them.”
C. J. Cherryh
OpenTelemetry is the future of Observability, APM, Monitoring, whatever you want to call ‘the process of knowing what our software is doing.’ It’s becoming common knowledge that your time is better spent gaining experience with an open, standardized system for telemetry than closed-source or otherwise proprietary standard. This truth is so universally acknowledged that all the big players in the market have made announcements of how they’re embracing OpenTelemetry. Often these statements mention how ‘open is the future’ et cetera. But how committed are these teams to OpenTelemetry? In this series, we’ll talk about how native OpenTelemetry tools compare to APM products that have adopted OpenTelemetry only partially. In this article, we will explore how, in both New Relic and Datadog, OpenTelemetry data is a ‘second class citizen.’

Data: first and second class
For over a decade, APM companies have loved to add new and exotic kinds of monitoring data to their dashboards. The disconnect has often come in where that data appears. Back when Application Performance Monitoring was so connected to web frameworks that it was often referred to as RPM (Rails Performance Monitoring), only the performance of web requests was displayed front-and-center on the application dashboard, with custom metrics, cache metrics, database metrics, and everything else relegated to a secondary menu, or worse still entirely hidden unless you set up a custom dashboard.
It became standard to discuss as technical debt, the fact that a data type that was beloved by users was still relegated to a backwater in the dashboard.
Another issue is ease of data ingress: The standard APM data gathered by a SaaS company’s monitoring agent can be very very easy to report, while other types require custom configuration, settings, and tool chains that make it more brittle than the default.
The result is a system that is gently sloped. It guides the user, without them even knowing it, back to the happy path of using the proprietary monitoring information reported by Datadog and New Relic, and away from open source tools.
The Big Gap Between Datadog’s Marketing and their Tools
Right from the installation stage… something feels amiss when trying to use OpenTelemetry with Datadog. There seem to be no actual use cases listed for OpenTelemetry. The guide on their documentation for trying OpenTelemetry reporting with a simple Python app is out of date, and there’s something kind of odd about the linked of articles from their OpenTelemetry overview:
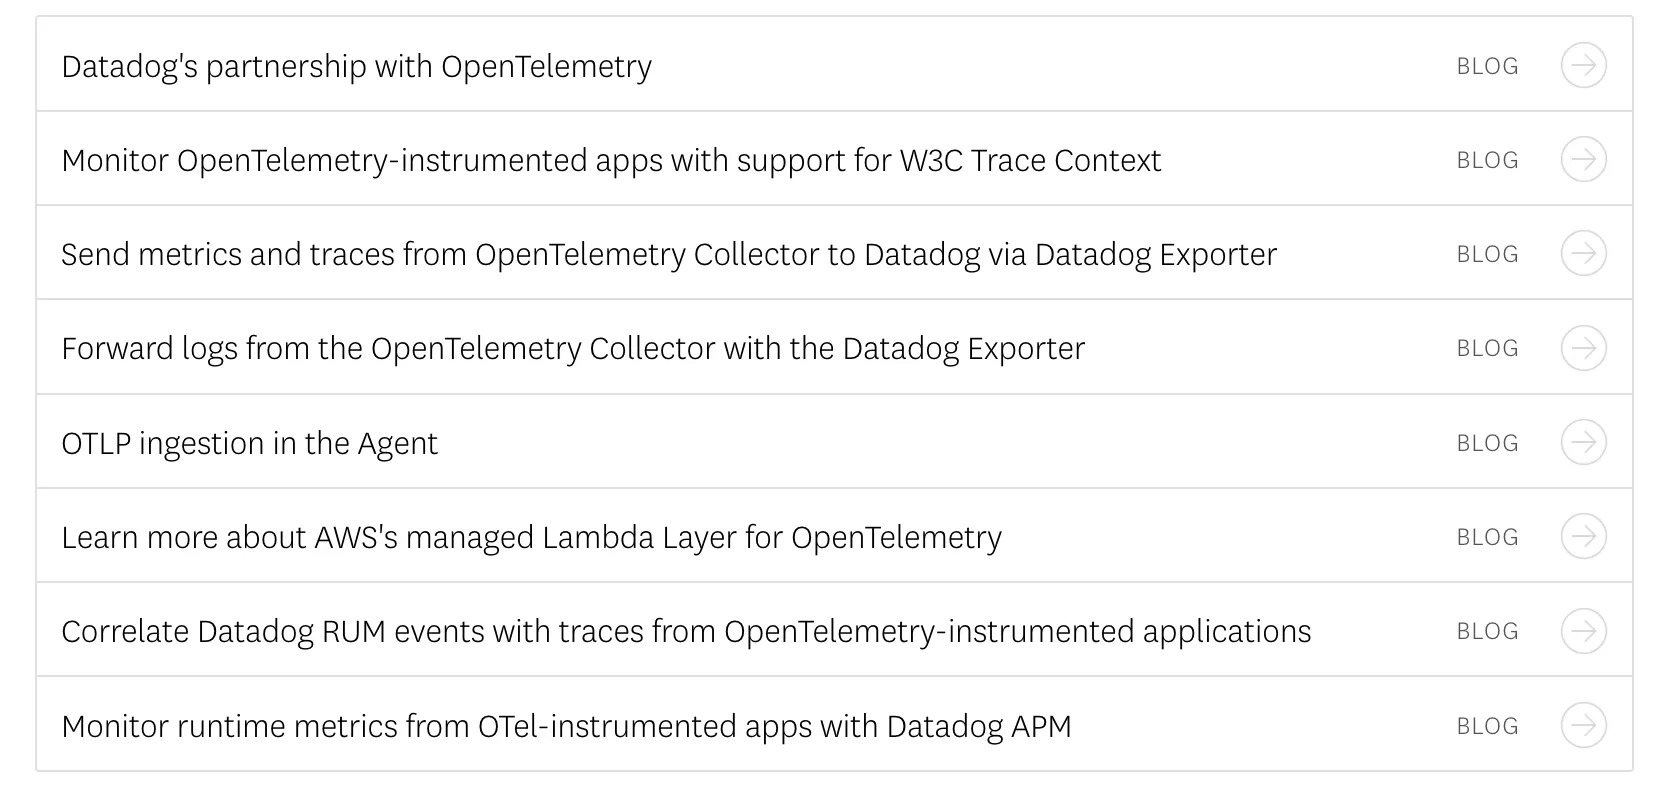
Out of all these articles, only one mentions an actual use case for OpenTelemetry: AWS’s excellent OpenTelemetry Layer for Lambda. Even that single guide still ends with steering the user to use DataDog’s proprietary Lambda instrumentation instead. Otherwise everything seems to be about reporting OpenTelemetry data that you’ve already set up. The overall message seems to be: if you insist on using OpenTelemetry, we can accept the data. For new services, Datadog never recommends adding OpenTelemetry.
While the message of ‘we will accept OpenTelemetry data but don’t want to encourage OpenTelemetry adoption’ is only implicit in the documentation, in private Datadog was recently revealed to be acting against the adoption of OpenTelemetry. While Datadog is happy to accept OpenTelemetry data, the org actively acts to prevent Datadog data from being part of an OpenTelemetry ecosystem.
OpenTelemetry data in Datadog: What's working
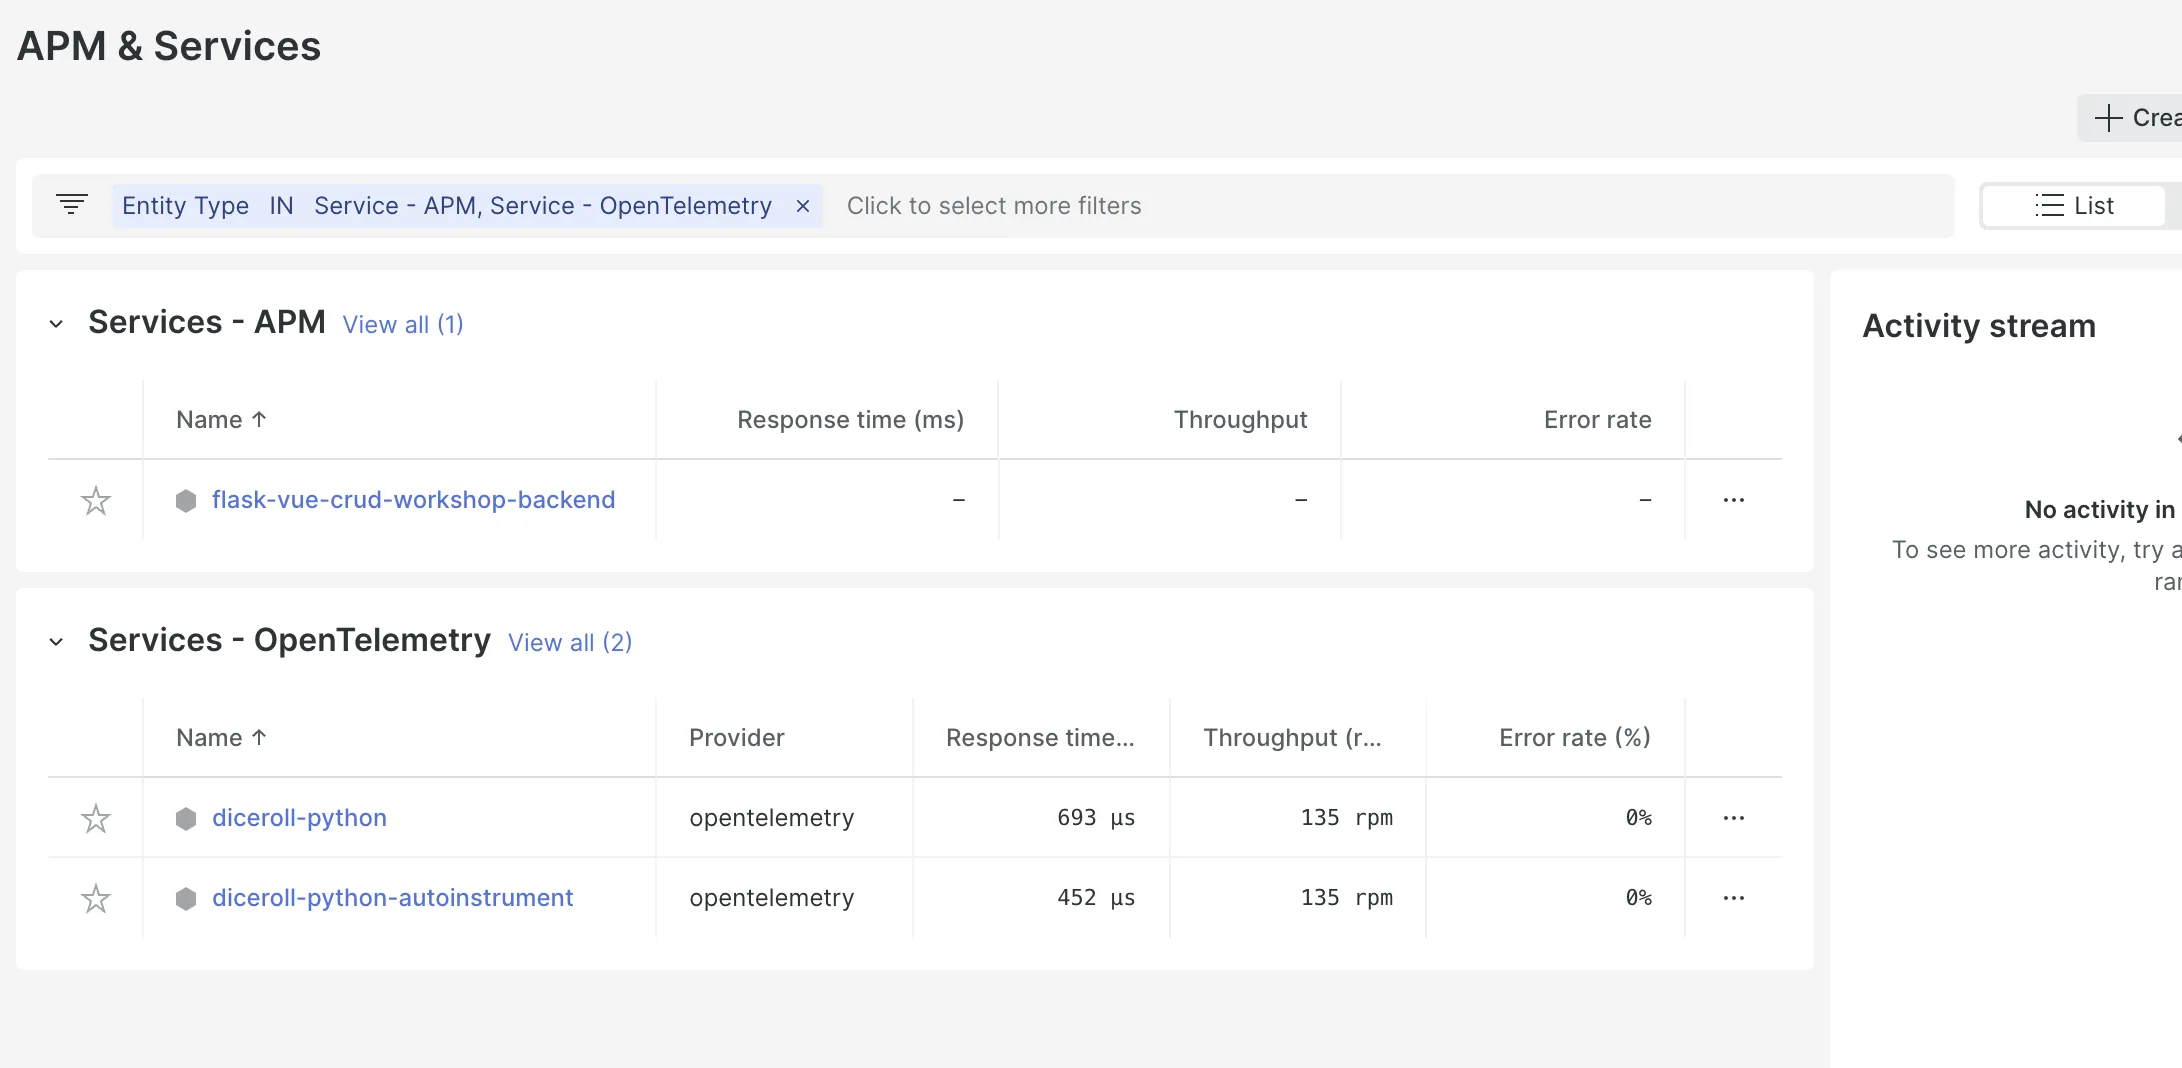
At first blush the basic integration of OpenTelemetry data looks okay within Datadog: new services are listed right along with their counterparts reporting data from the proprietary Datadog instrumentation. If both Datadog and OpenTelemetry are used with the same service.name the result is an integrated dashboard with traces listed together chronologically. Once we try to dive into this data, however, cracks begin to show.
OpenTelemetry data in Datadog: roadblocks
The theme mentioned above holds true in my experience: Datadog accepts OpenTelemetry data but grudgingly, and doesn’t always treat it the same way as the data produced by its proprietary tools. For this example I used the same Python application I’d previous instrumented with the Datadog auto-instrumentation agent. The path to send in data was the default path in the OpenTelemetry docs for Python applications: sending custom metrics to the DataDog agent.
Limitations in OpenTelemetry docs on Datadog
The first roadblock you’ll encounter when trying to report OTel data to Datadog is documentation: fully half of the tutorials on their blog and docs site are outdated and nonfunctional. In Python several still refer to the opentelemetry-exporter-datadog package, despite its deprecation some time ago. Another large section of docs refers to the even older OpenTracing, though this at least has a deprecation note.
After several failed attempts to follow documentation, it turned out that it is possible to send data from a python application directly to the Datadog agent. For other frameworks, the only path is to export data from the OpenTelemetry collector directly to the Datadog backend.
Whatever path you take, you’ll find that once your data is in Datadog, the experience is similar to using proprietary Datadog data, but far from identical.
Limitations: Linking Traces and Logs
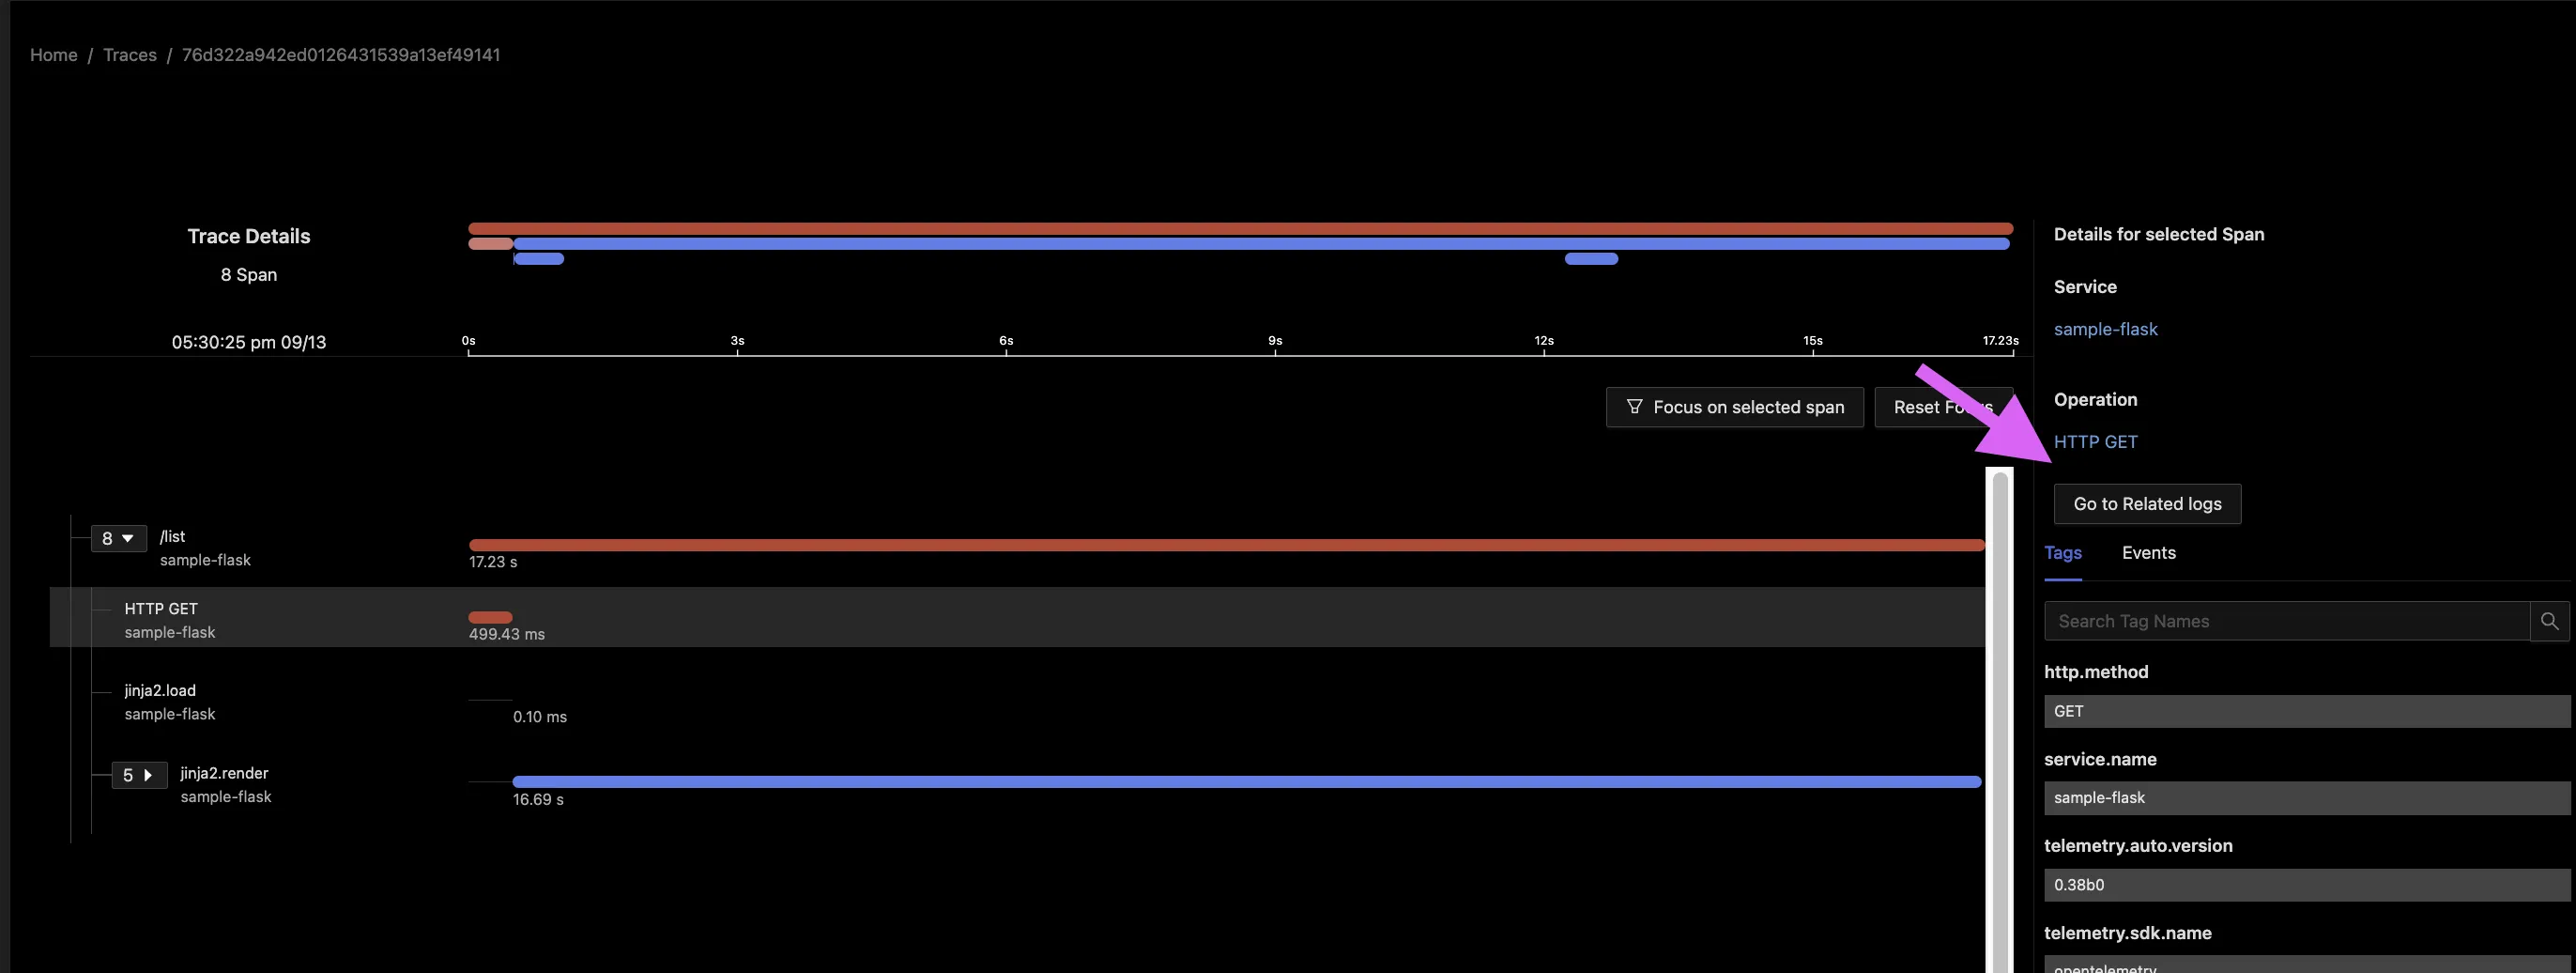
You cannot link traces and logs automatically with the DataDog OpenTelemetry tools. It’s necessary to manually patch your particular logging module or library with a processor that adds the aforementioned translated TraceId and SpanId as Log attributes marked dd.trace_id and dd.span_id, respectively.
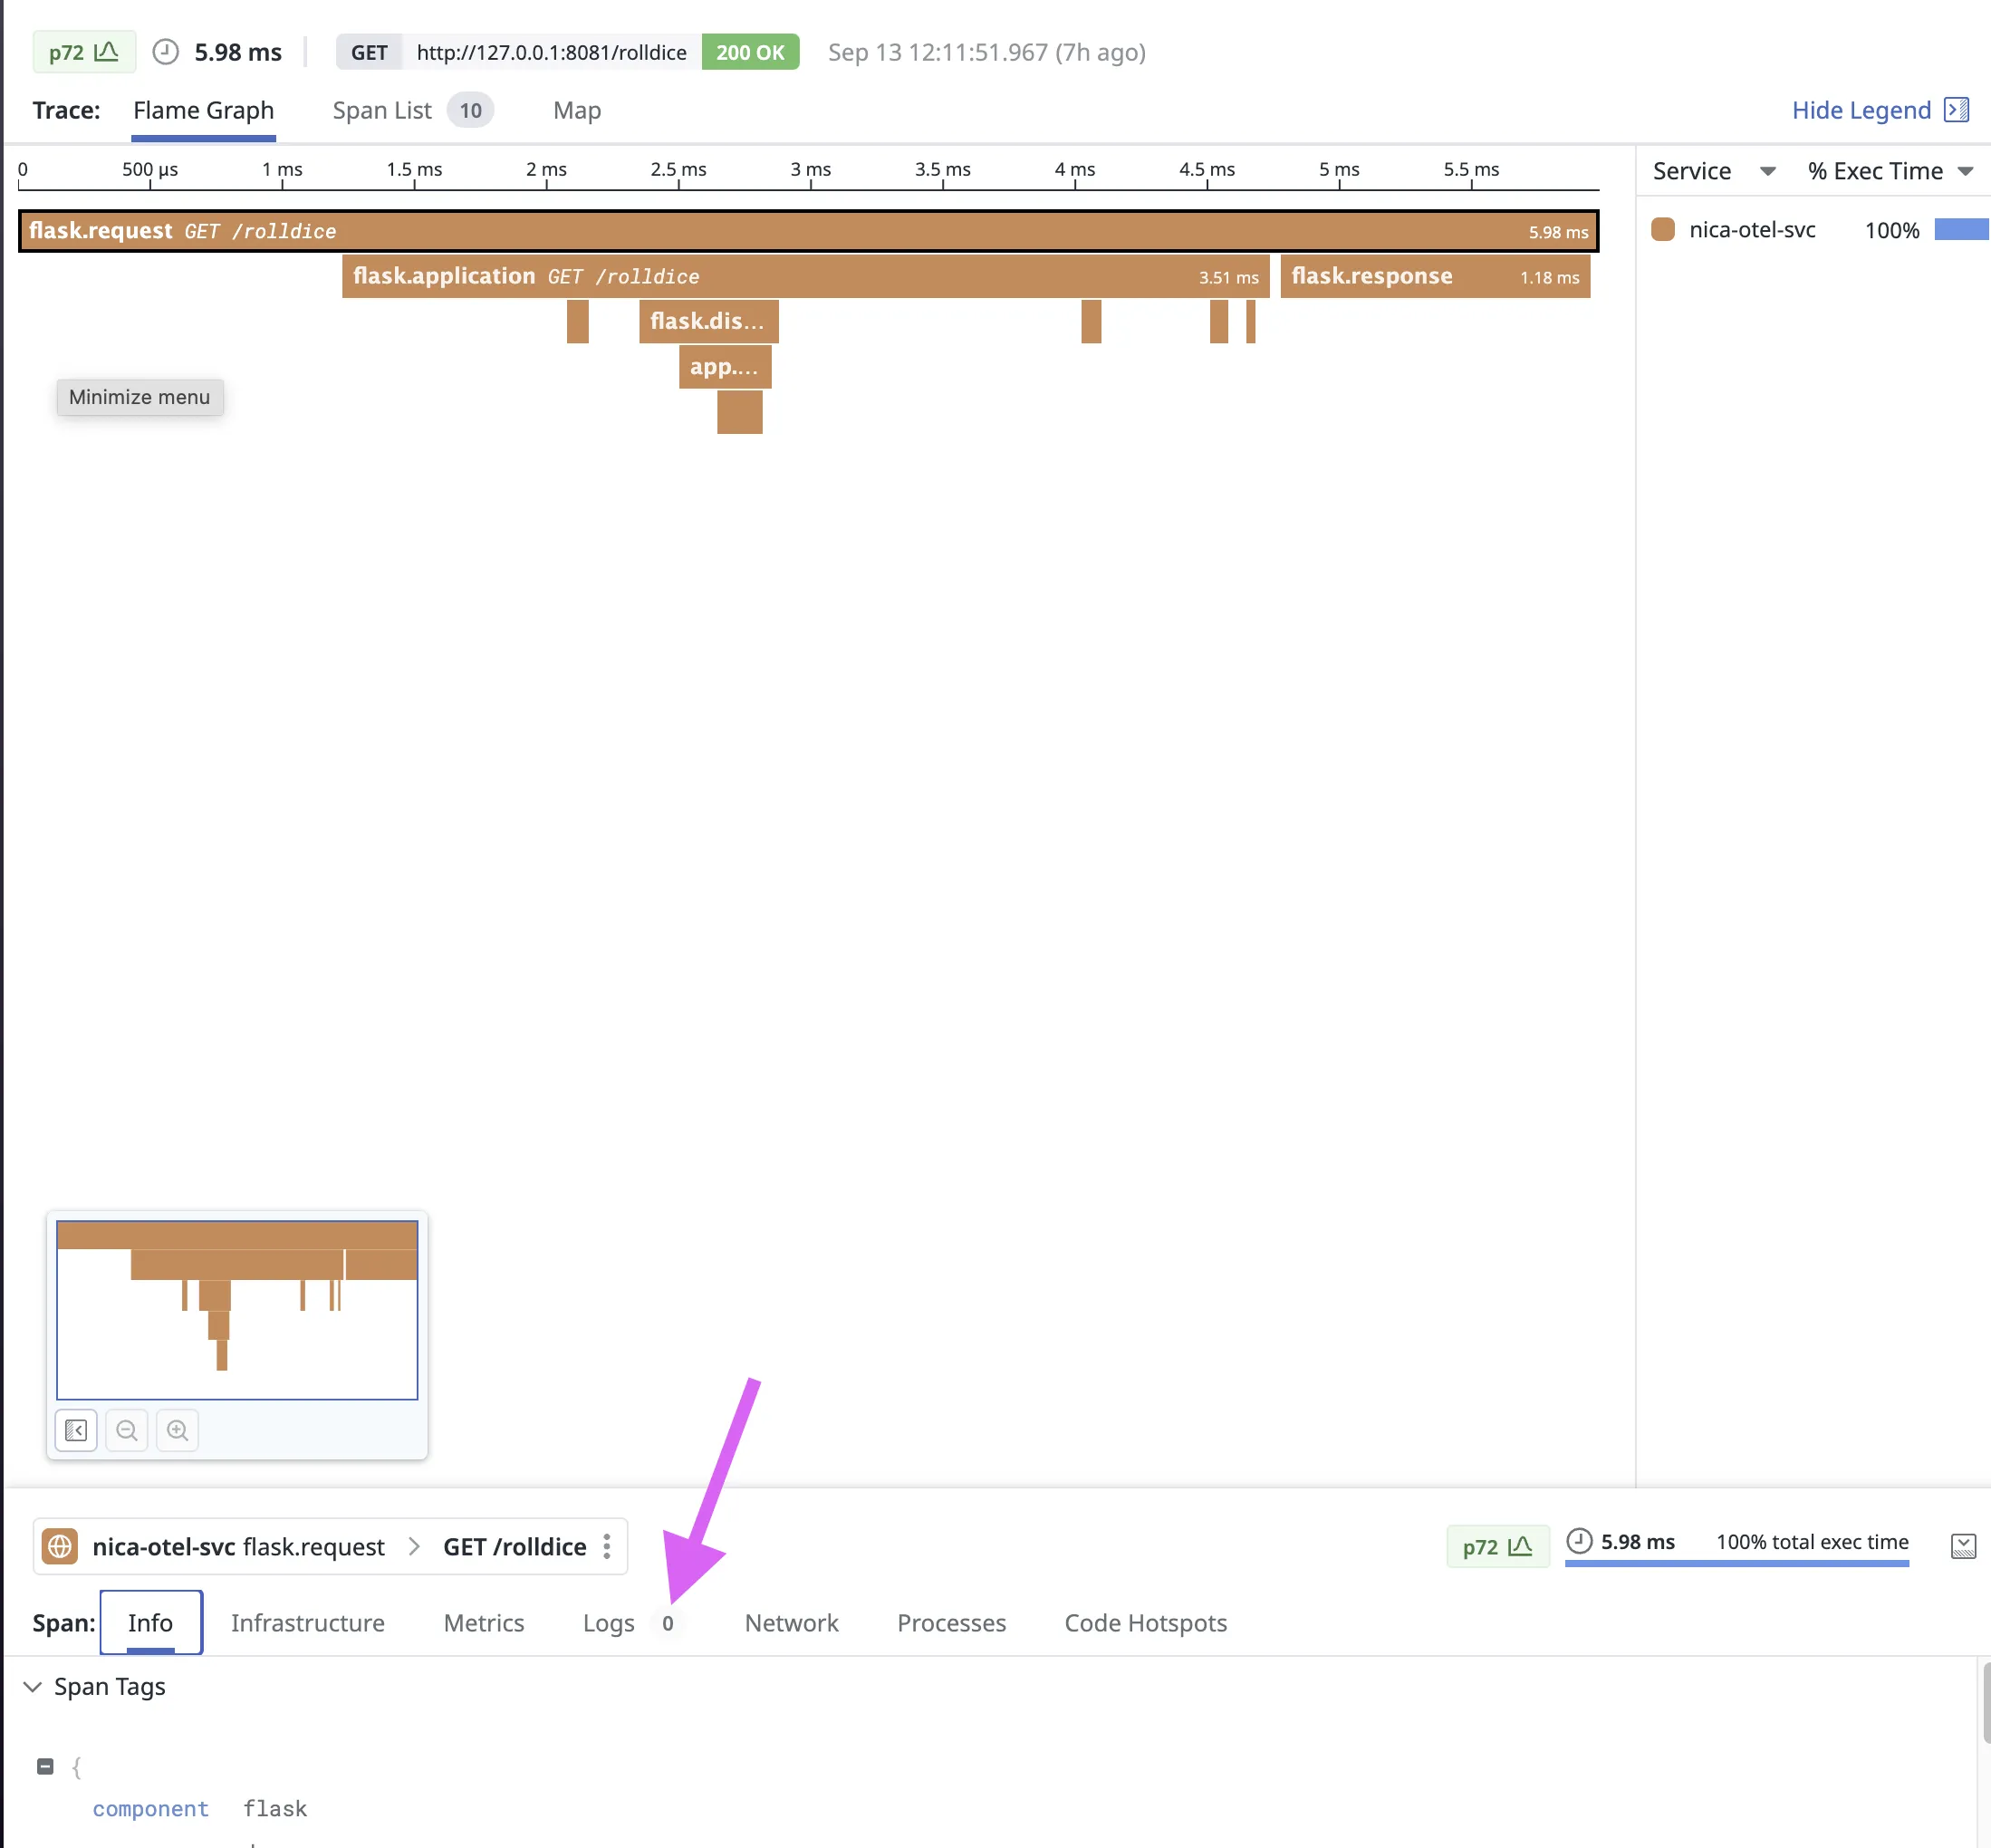
By contrast, with just the automatic instrumentation for Python in OpenTelemetry, an OpenTelemetry native tool like SigNoz can connect traces to related logs without the needed for an additional processor.
These disconnects will make it harder to 'zoom in' on traces that look interesting, and missing annotations make the situation worse.
Limitations: missing annotations
One piece of tracing that appears to be un-implemented in Datadog is events within traces. A Span Event can be thought of as a structured log message (or annotation) on a Span, and they can be added to a trace with a simple call.
def do_roll():
    with tracer.start_as_current_span("do_roll") as rollspan:
        res = randint(1, 6)
        current_span = trace.get_current_span()
        current_span.add_event("Gonna try it!")
        # try some
        current_span.add_event("Did it!")
        rollspan.set_attribute("roll.value", res)
        return res
However in all my experiments these span events didn’t show up anywhere in Datadog, not as metrics, not as events, not even present within the span info
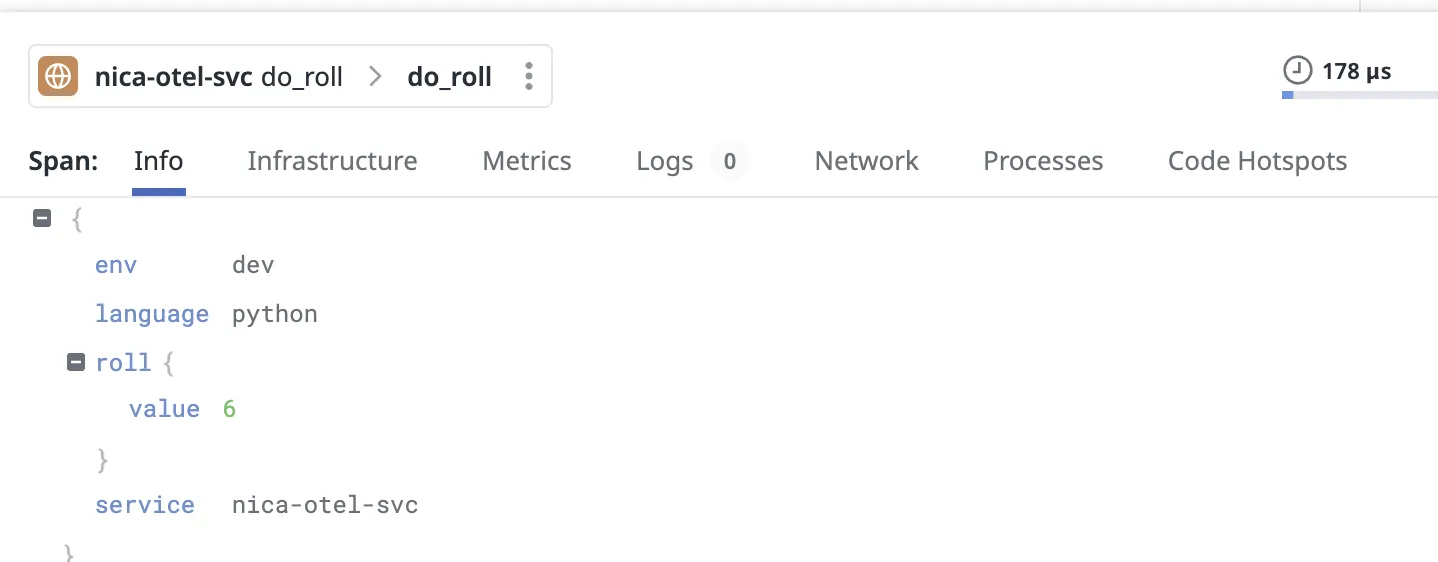
Not only is this data missing from the trace, no failure is logged in the Datadog trace logging. The closest analogy to span events within Datadog’s tracing standard was a custom span tag, but this showed no information no matter how I checked my OpenTelemetry traces.
This gap exemplifies the drawbacks of Datadog’s attempt to fully integrate OpenTelemetry data: OpenTelemetry is a different standard for monitoring. Where the two standards don’t align, Datadog’s solution seems to be a choice to ‘eat’ the data that doesn’t match.
Limitations: a separate path for metrics
One of the central tenets of OpenTelemetry is that, at some point in the near future, the project will achieve a consistent standard for measuring all three observability signals and correlating them with a single point of collection such that even metrics can be implicitly tied to particular traces and logs. This vision isn’t perfectly achieved yet, but it is surprisingly easy to report logs, traces, and metrics with consistent tagging to a native OpenTelemetry backend.
In datadog, however, metrics and logging are gathered in a way quite separate from traces.
- Logs are gathered by tailing a target file
- Metrics require you to either connect an OpenTelemetry collector to datadog or use
DogStatsD. TheStatsDroute appears to be unsupported by any OpenTelemetry SDK
Adding calls to send metrics with the OpenTelemetry SDK on an application reporting traces to Datadog, much like the trace span events mentioned above, appears to be a noop. The agent and Datadog tracing neither logs an error nor reports any data.
One limitation did surprise me: it doesn’t appear that span data is available as a ‘metric’ to be queried in Datadog.
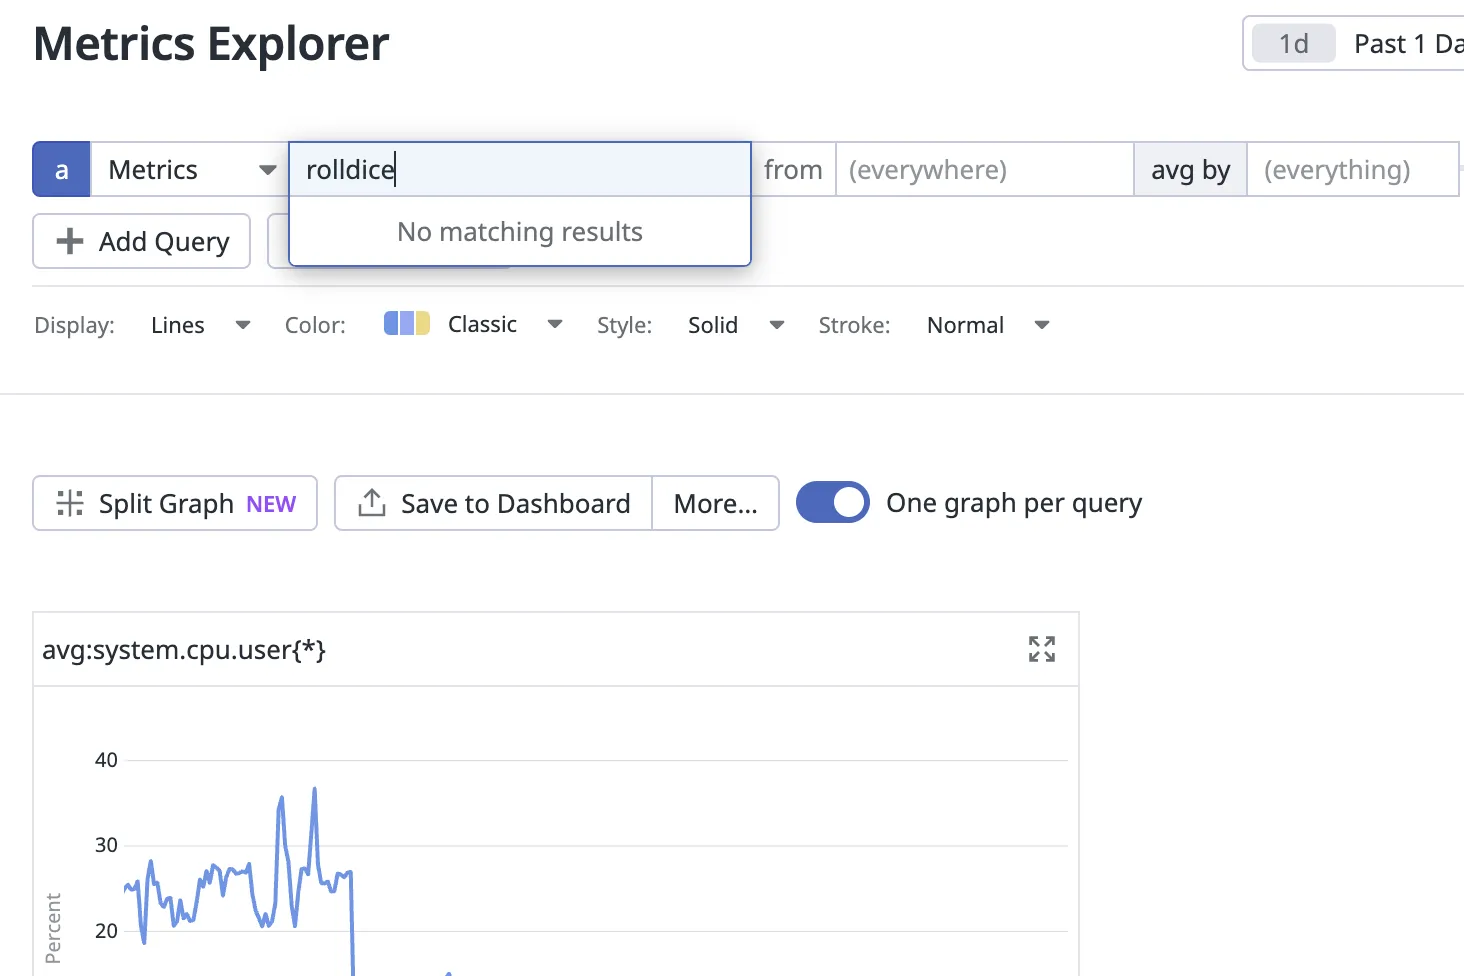
Our uniquely named /rolldice isn't listed. This is also true for proprietary Datadog traces.
OpenTelemetry in New Relic
In stark contrast to Datadog, the New Relic team does a great job of documenting a happy path for OpenTelemetry data. One route is clearly deprecated, while the other clearly documented. And both automatic and manual instrumentation are clearly documented with an example repo that works on the first run (except for one line which, at least for me, needed to be fixed). I was reporting OTel data to New Relic in less than an hour, a great onboarding experience.
Once data is reporting, the experience again shows significant gaps between OpenTelemetry and proprietary data.
The Island of New Relic’s OpenTelemetry Data
Right from when you first get data reported, you’ll see the biggest difference with New Relic’s approach to OpenTelemetry data: all data is segregated.
Setting the same service name won’t fix the issue: application data, traces, and logs will always show up in a separate listing making a blended approach difficult.
A whole different experience
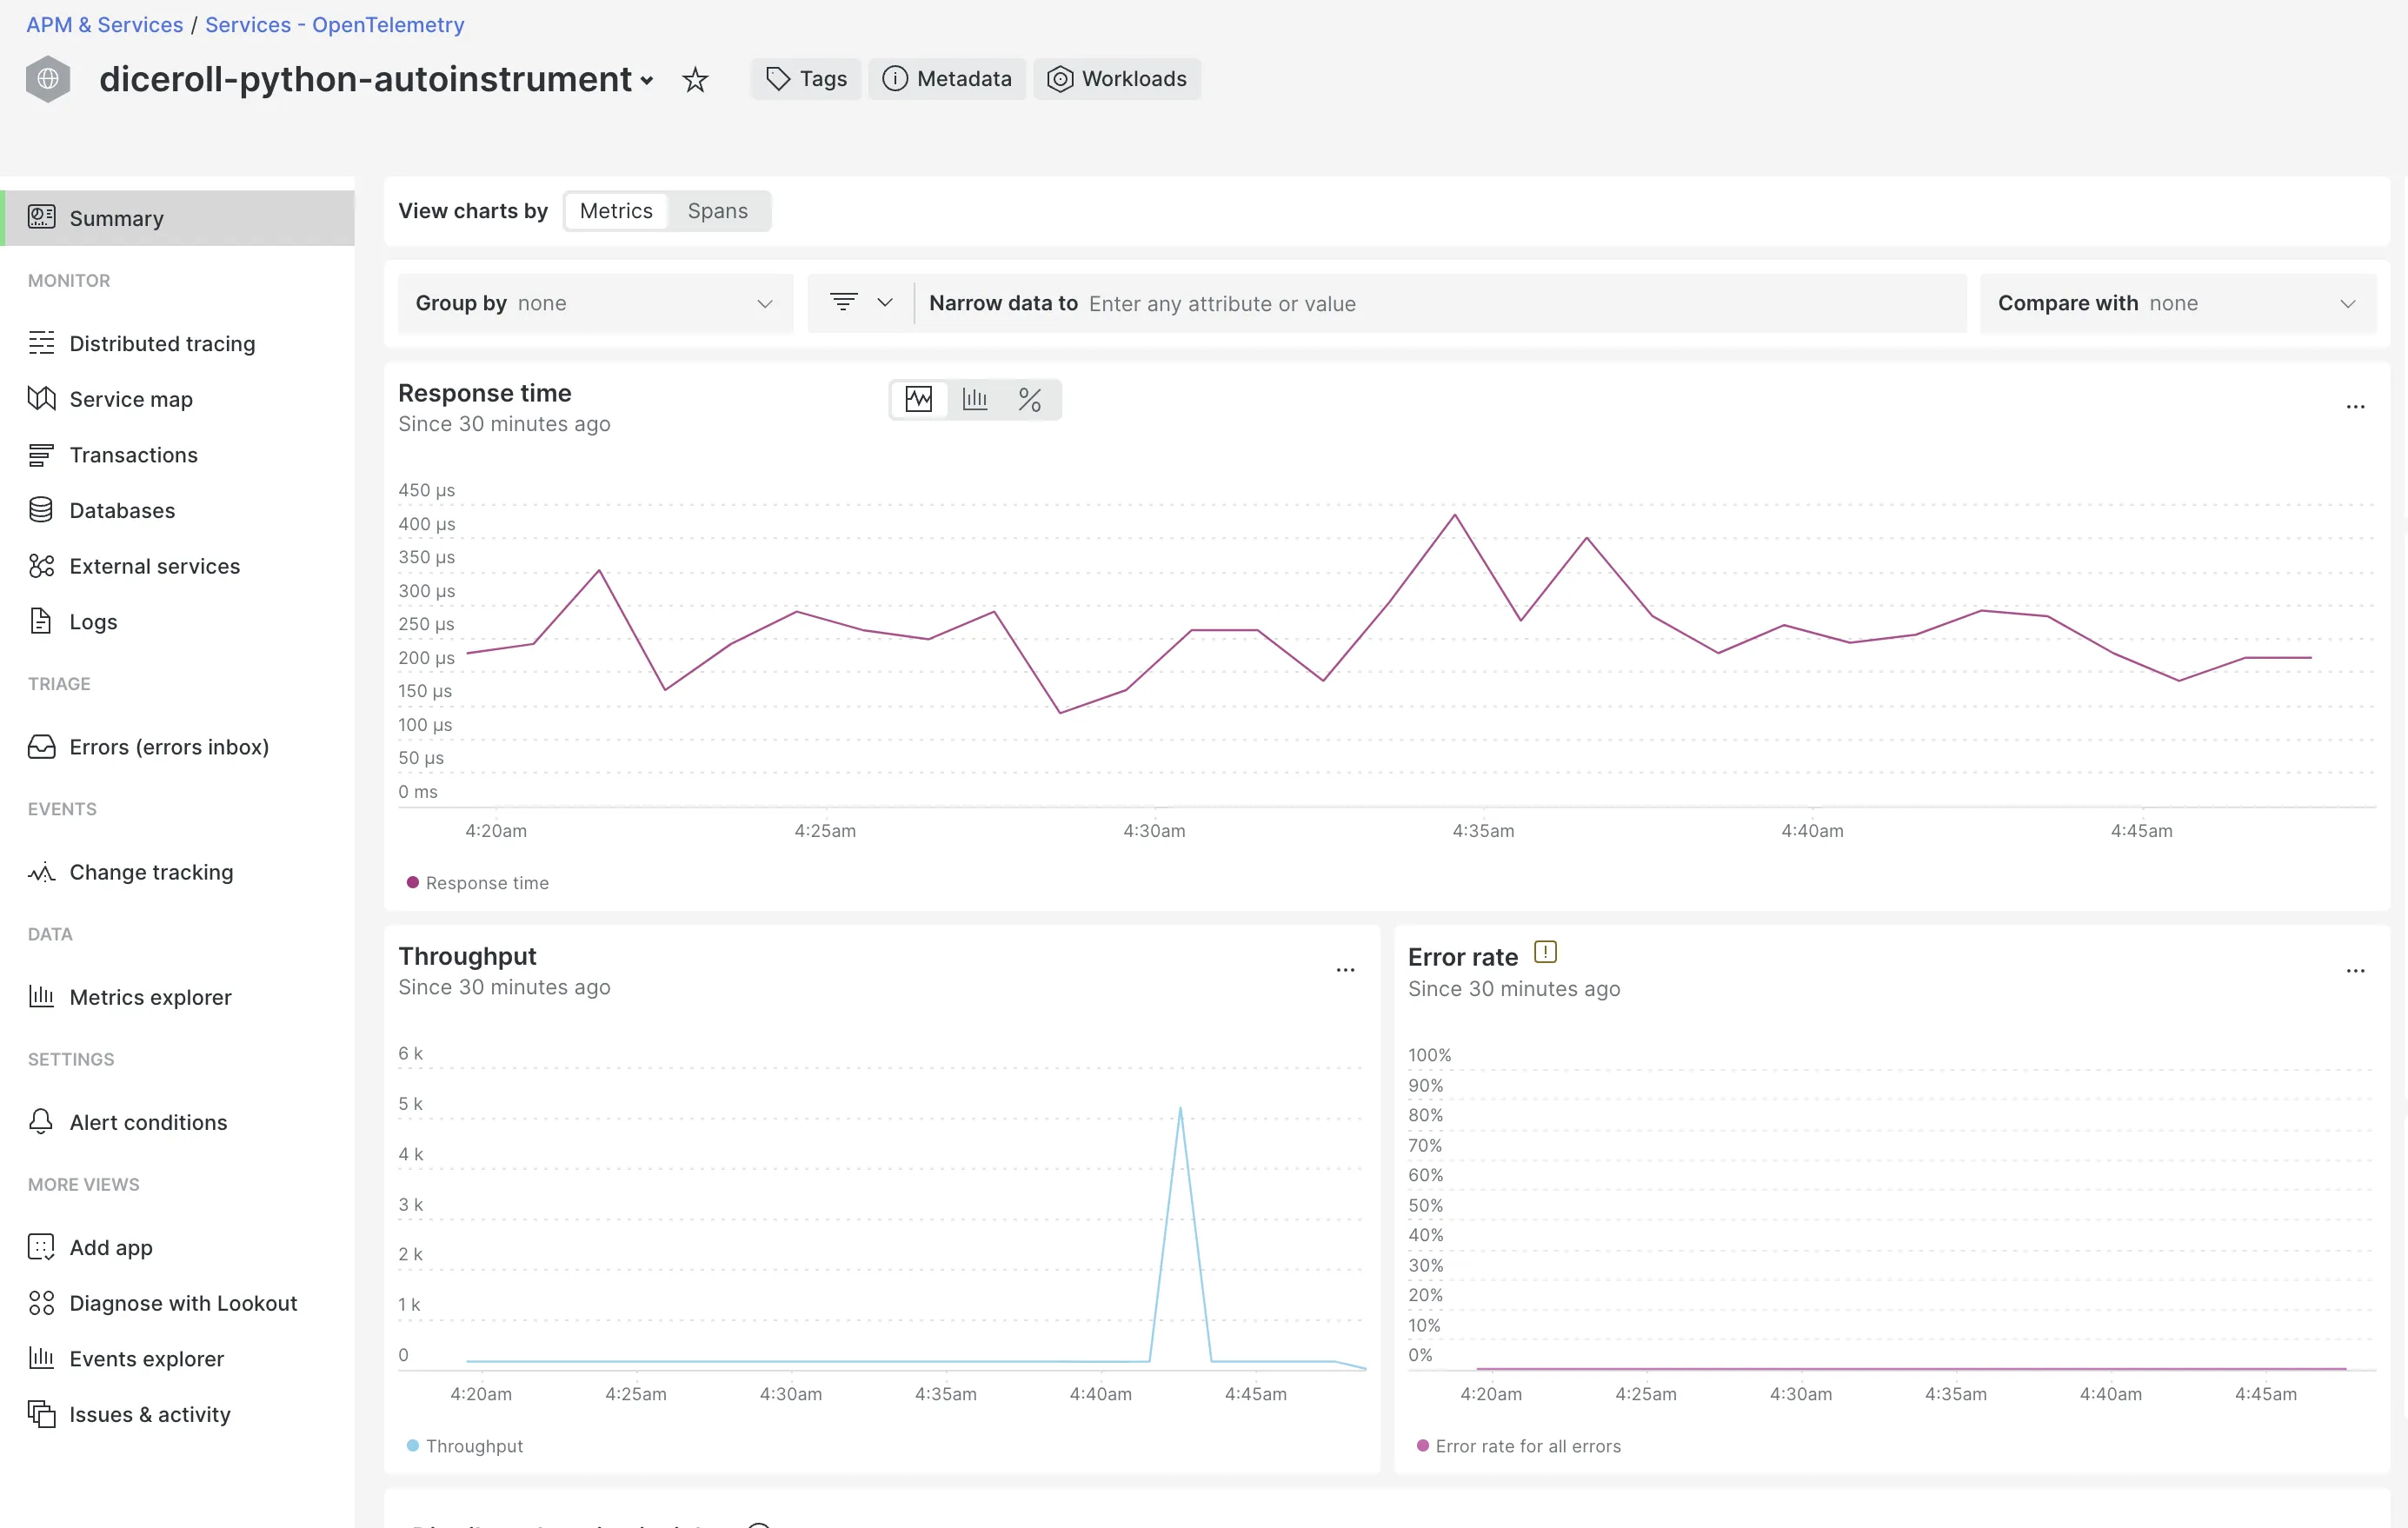
Clicking into the dashboards for our two applications gives a very different experience for OpenTelemetry. Starting with the New Relic view its users are used to:
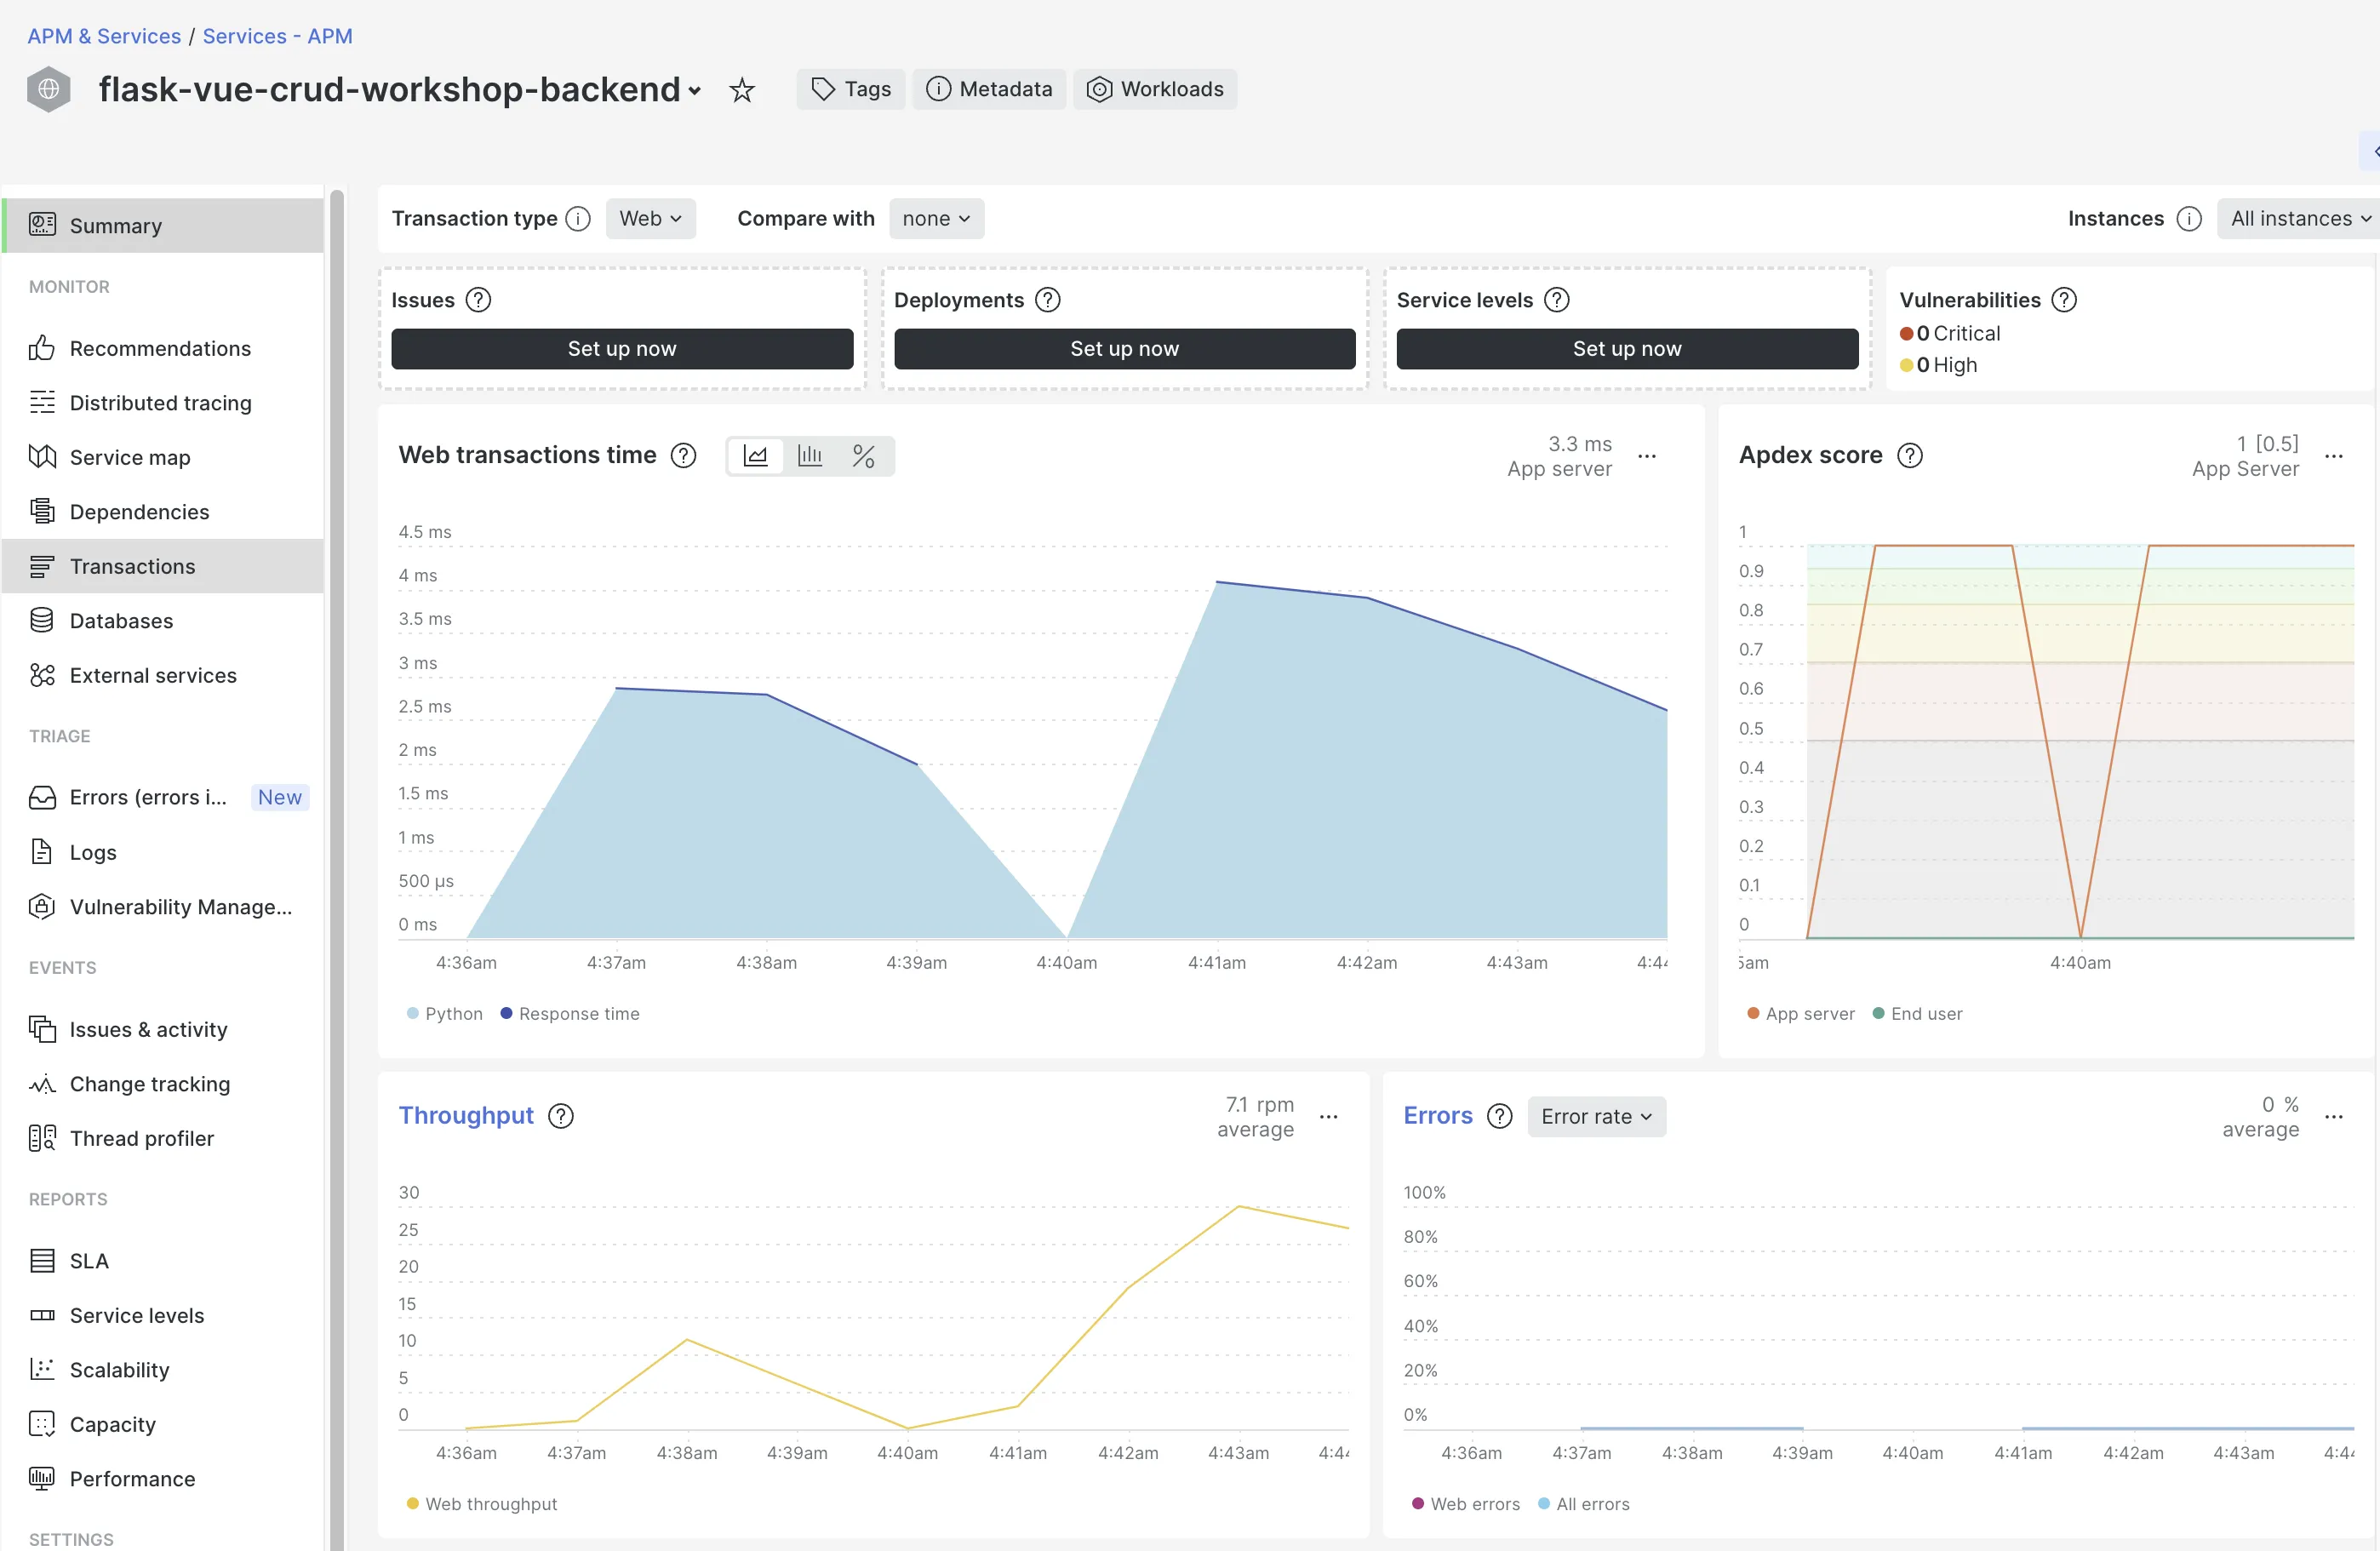
The differences are subtle with an OpenTelemetry-monitored application, but an experienced New Relic user will know right away that something’s amiss
Despite these requests being handled by the web framework Flask, the New Relic interface doesn’t seem to recognize that this, too, is a web application.
Behind the scenes: different data
New relic has a very useful feature to see the query that behind any chart in the UI. Looking at the queries for even a very basic statistic like ‘throughput’ shows the problem: even with a custom query or dashboard, it’s not possible to ‘stitch’ OpenTelemetry data together with proprietary New Relic monitoring.
Query 1: throughput on a New Relic-instrumented app,
SELECT rate(count(apm.service.transaction.duration), 1 minute) as 'Web throughput'
FROM Metric WHERE (entity.guid = 'NDExMjc2NXxBUE18QVBQTElDQVRJT058MTA5NjA1MzQ4Ng')
AND (transactionType = 'Web') LIMIT MAX TIMESERIES
Query 2: throughput on an OpenTelemetry app
SELECT rate(count(%.server.duration), 1 minute) AS 'Throughput'
FROM Metric WHERE (entity.guid = 'NDExMjc2NXxFWFR8U0VSVklDRXwtMzM1MzYxNjkxNjU2MzIzNTU3Mg')
AND ((http.server.duration IS NOT NULL OR rpc.server.duration IS NOT NULL OR messaging.producer.duration IS NOT NULL)) TIMESERIES
charts like ‘response time’ have even more divergent query formats and labels. The result is that you won’t be able to average between applications and comparison will be difficult.
Conclusions
Comparing DataDog and New Relic Support for OpenTelemetry
Perhaps it’s my fondness for the team at New Relic, but my impression is that their attitude to OpenTelemetry as a whole is significantly better: examples are clear, limitations aren’t obfuscated, and examples are recently updated and functional. I’m keenly aware of the massive data management problem of merging two datasets with different schemas, and all the limitations I listed above seem to be a result of that issue.
Over at Datadog, the story inspires even less confidence. The documentation featured on their support site seems calculated to leave the impression that OpenTelemetry is fully supported at Datadog just like any other data source, with little concern with how someone might ever actually report OTel data. Almost as if support of OpenTelemetry is fine as a selling point to close a deal, but there’s no plan to encourage users to actually use the standard. Even once data is reporting, we see real limitations once we ‘zoom in’ and try to annotate traces in depth.
The Difficulty of Competing with OpenTelemetry Native Tools
It’s surprising that two companies with highly mature products, hundreds of thousands of hosts under monitoring, and massive product teams would struggle so much to support OpenTelemetry. While OTel may have a different standard, it is after all data with a familiar purpose: telling users how their software is running. But it’s the gaps with their proprietary data that show the problem: Neither New Relic nor Datadog can devote all their time to OpenTelemetry, they have far too many legacy customers to stop development on their proprietary monitoring and dashboards. Even a small team, if they go ‘all in’ on supporting OpenTelemetry as the sole way to monitor applications, can produce a better experience for engineers than can New Relic or Datadog.
The proof is in the pudding. Teams less than 1/10th the size of either company have delivered amazing results. From the deep tracing and long storage of Honeycomb or the single pane of glass for OpenTelemetry delivered by SigNoz, we see that engineering teams focused on single common goal can achieve great things no matter their size.
While purchasing decisions will always be personal to your team, the concerns raised here should give any team lead pause if your primary data source is OpenTelemetry.
